| Param | Original file | Final file |
|---|---|---|
| Filename | modeM0/AS1A11_059T08_9000005160_36158cztM0_level2.evt | modeM0/AS1A11_059T08_9000005160_36158cztM0_level2_quad_clean.evt |
| Size (bytes) | 424,684,800 | 89,242,560 |
| Size | 405.0 MB | 85.1 MB |
| Events in quadrant A | 2,807,441 | 573,591 |
| Events in quadrant B | 3,207,269 | 611,553 |
| Events in quadrant C | 3,121,732 | 585,004 |
| Events in quadrant D | 3,352,977 | 549,003 |
| Mode M9 | |||
|---|---|---|---|
| Quadrant | BADHDUFLAG | Total packets | Discarded packets |
| A | 0 | 38 | 0 |
| B | 0 | 38 | 0 |
| C | 0 | 38 | 0 |
| D | 0 | 38 | 0 |
| Mode M0 | |||
|---|---|---|---|
| Quadrant | BADHDUFLAG | Total packets | Discarded packets |
| A | 0 | 11659 | 3 |
| B | 0 | 12885 | 2 |
| C | 0 | 12428 | 2 |
| D | 0 | 13514 | 2 |
| Mode SS | |||
|---|---|---|---|
| Quadrant | BADHDUFLAG | Total packets | Discarded packets |
| A | 0 | 114 | 0 |
| B | 0 | 114 | 0 |
| C | 0 | 114 | 0 |
| D | 0 | 114 | 0 |
| Quadrant | Total seconds | Saturated seconds | Saturation percentage |
|---|---|---|---|
| A | 5478 | 15 | 0.273823% |
| B | 5478 | 70 | 1.277839% |
| C | 5478 | 49 | 0.894487% |
| D | 5478 | 132 | 2.409639% |
Noise dominated data is calculated using 1-second bins in cleaned event files. If a bin has >2000 counts, and if more than 50% of those come from <1% of pixels, then it is considered to be noise-dominated and hence unusable.
| Quadrant | # 1 sec bins | Bins with >0 counts | Bins with >2000 counts | High rate bins dominated by noise | Noise dominated (total time) | Noise dominated (detector-on time) | Marked lightcurve |
|---|---|---|---|---|---|---|---|
| A | 9244 | 5480 | 6 | 6 | 0.06% | 0.11% | 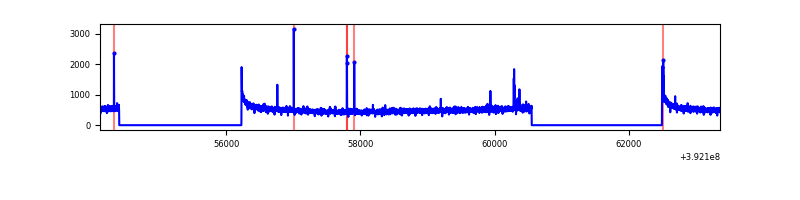 |
| B | 9244 | 5480 | 38 | 38 | 0.41% | 0.69% | 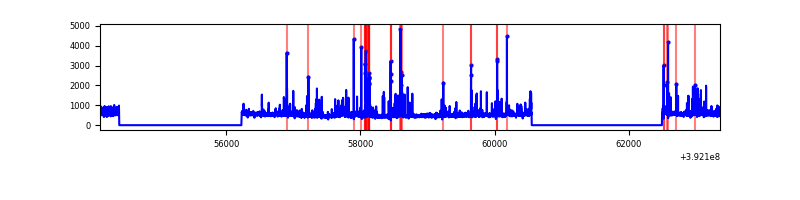 |
| C | 9244 | 5480 | 33 | 33 | 0.36% | 0.60% | 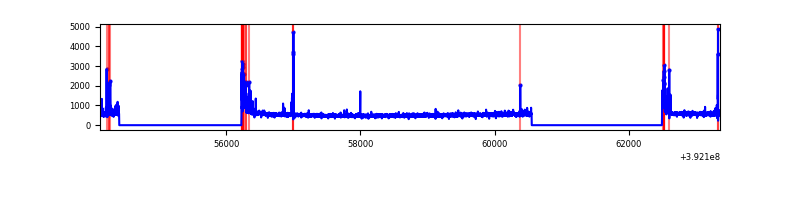 |
| D | 9244 | 5479 | 94 | 94 | 1.02% | 1.72% | 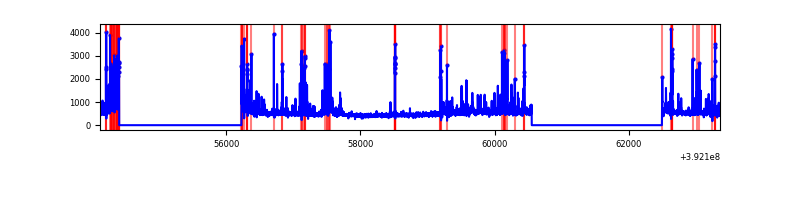 |
Top three noisy pixels from each quadrant. If the there are fewer than three noisy pixels in the level2.evt file, extra rows are filled as -1
| Pixel properties | Quadrant properties | ||||||
|---|---|---|---|---|---|---|---|
| Quadrant | DetID | PixID | Counts | Sigma | Mean | Median | Sigma |
| A | 10 | 83 | 173868 | 1294.2 | 667 | 656 | 133.8 |
| A | 9 | 143 | 37632 | 276.28 | 667 | 656 | 133.8 |
| A | 13 | 254 | 9209 | 63.91 | 667 | 656 | 133.8 |
| B | 5 | 172 | 382994 | 2979.78 | 675 | 658 | 128.3 |
| B | 0 | 246 | 51493 | 396.19 | 675 | 658 | 128.3 |
| B | 0 | 190 | 48496 | 372.83 | 675 | 658 | 128.3 |
| C | 15 | 214 | 233082 | 1515.36 | 664 | 672 | 153.4 |
| C | 0 | 10 | 134242 | 870.9 | 664 | 672 | 153.4 |
| C | 0 | 207 | 106246 | 688.36 | 664 | 672 | 153.4 |
| D | 13 | 249 | 219038 | 1370.33 | 655 | 637 | 159.4 |
| D | 12 | 17 | 188716 | 1180.08 | 655 | 637 | 159.4 |
| D | 2 | 250 | 119263 | 744.31 | 655 | 637 | 159.4 |
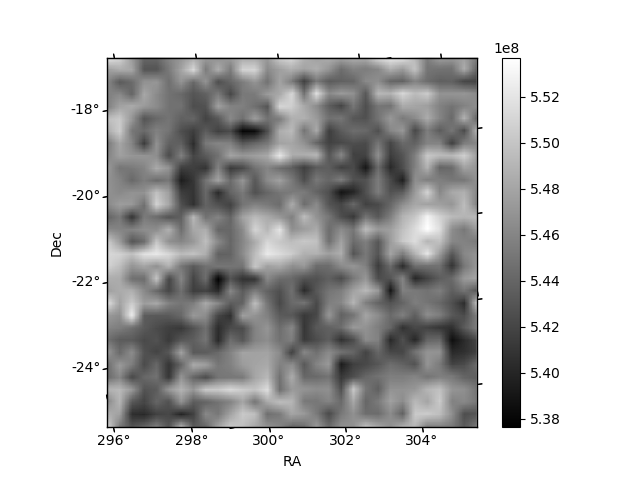
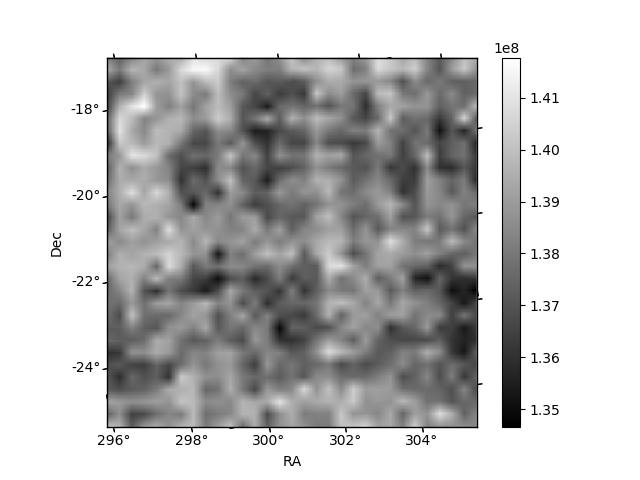
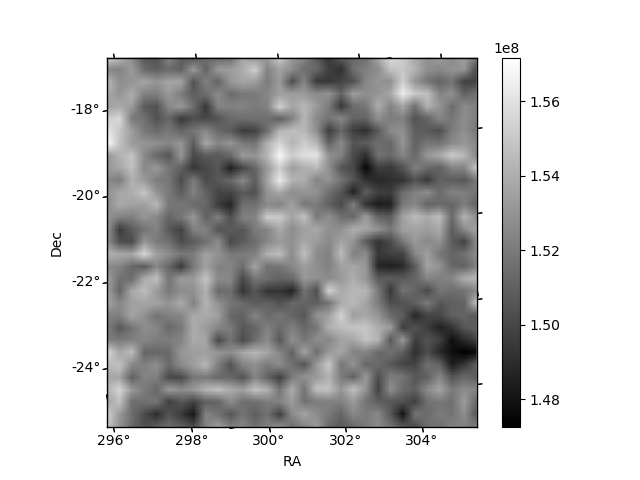
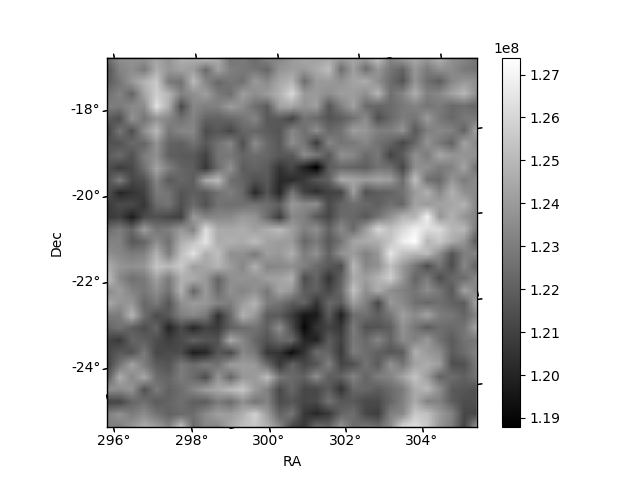
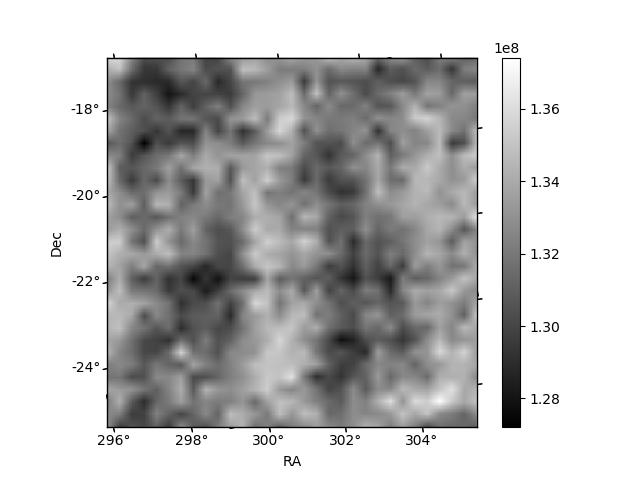
Histogram calculated using DETX and DETY for each event in the final _common_clean file
| Quadrant A | 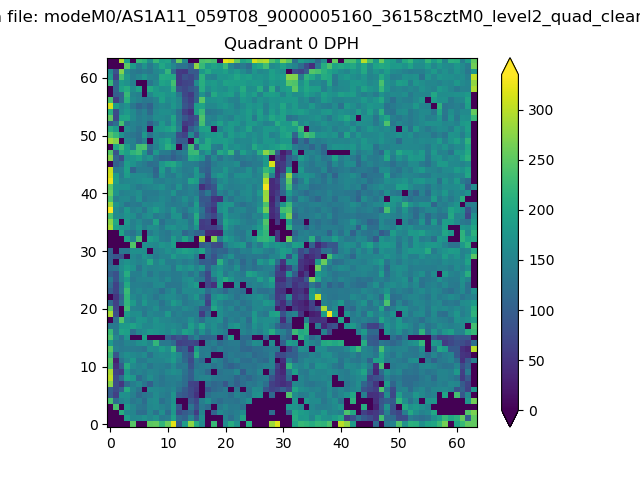 |
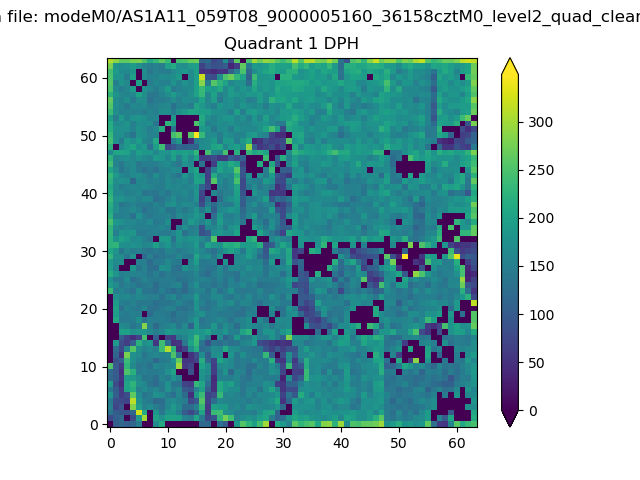 |
Quadrant B |
|---|---|---|---|
| Quadrant D | 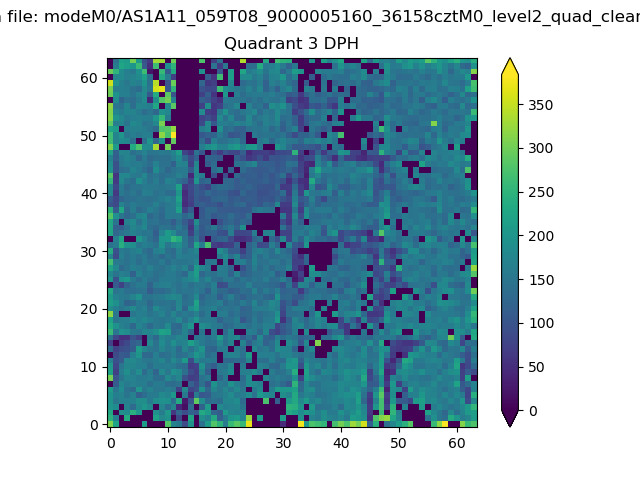 |
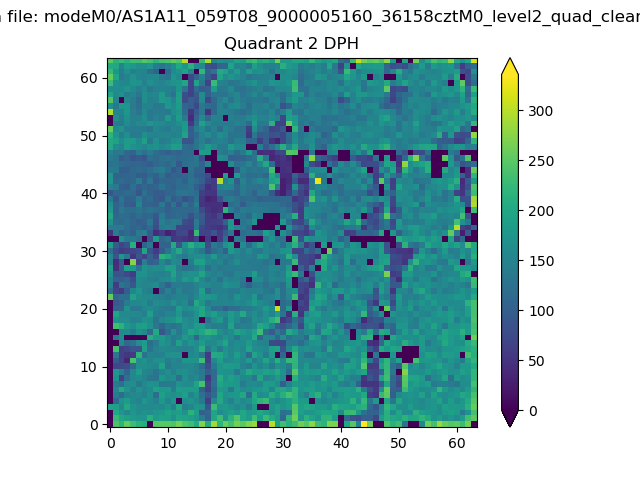 |
Quadrant C |
| Plot type | Count rate plots | Images |
|---|---|---|
| Comparison with Poisson distribution Blue bars denote a histogram of data divided into 1 sec bins. Red curve is a Poisson curve with rate = median count rate of data. |
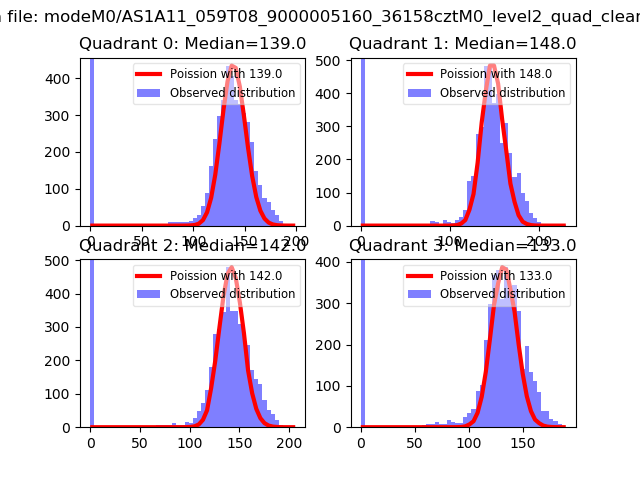 |
 |
| Quadrant-wise count rates Data is divided into 100 sec bins |
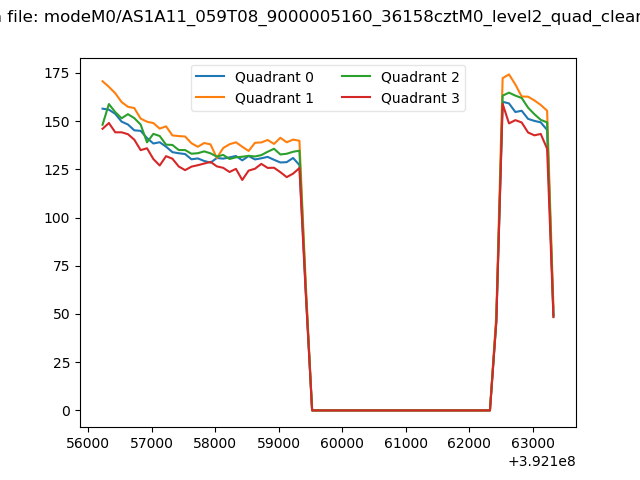 |
|
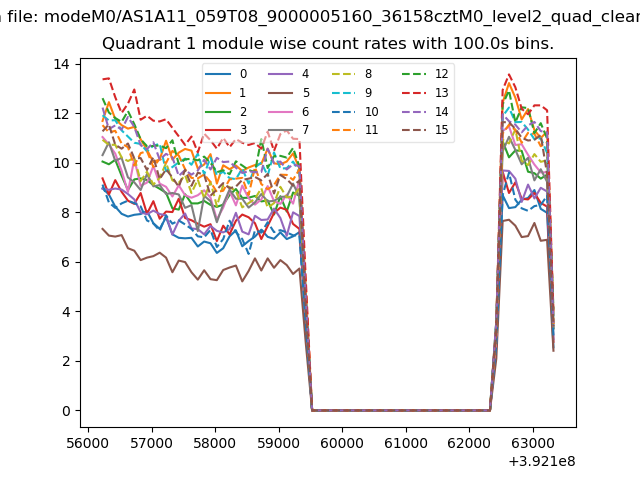
| Module-wise count rates for Quadrant A Data is divided into 100 sec bins |
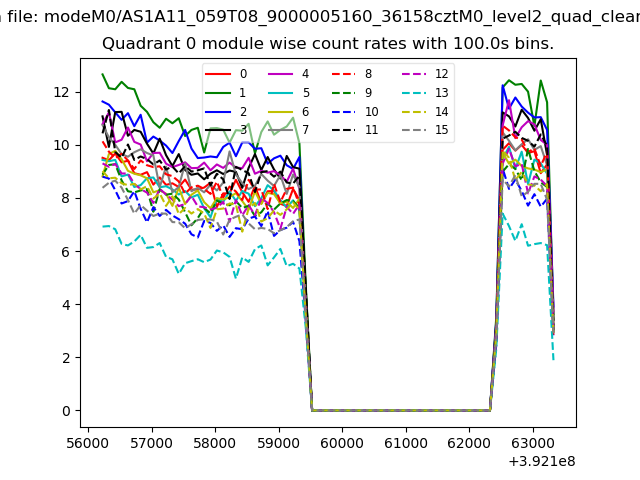 |
 |
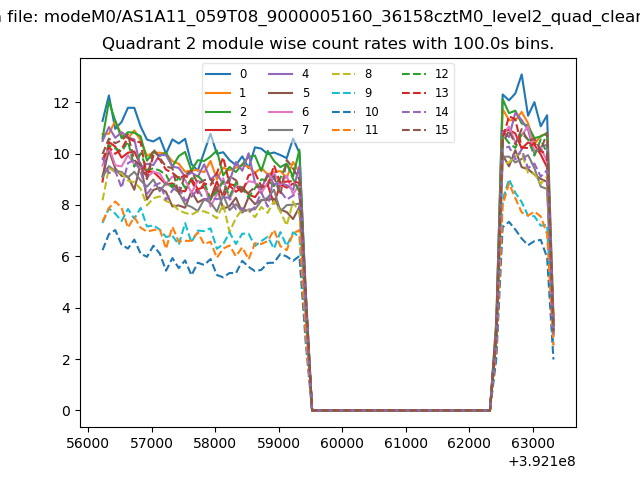
| Module-wise count rates for Quadrant B Data is divided into 100 sec bins |
 |
 |
| Module-wise count rates for Quadrant C Data is divided into 100 sec bins |
 |
 |
| Module-wise count rates for Quadrant D Data is divided into 100 sec bins |
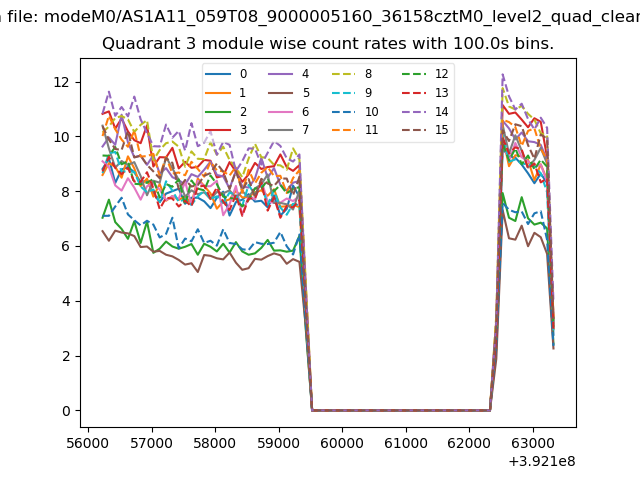 |
 |
| Parameter | Plot |
|---|---|
| CZT HV Monitor |  |
| D_VDD | 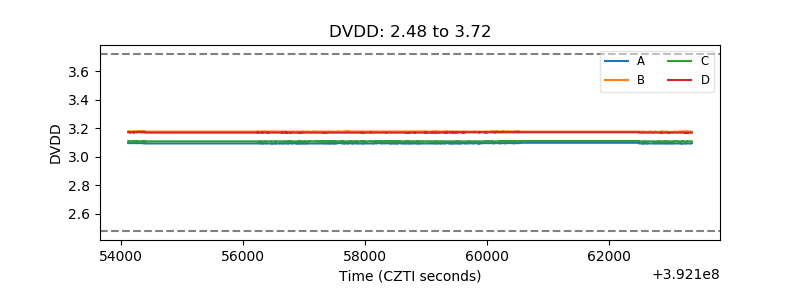 |
| Temperature 1 | 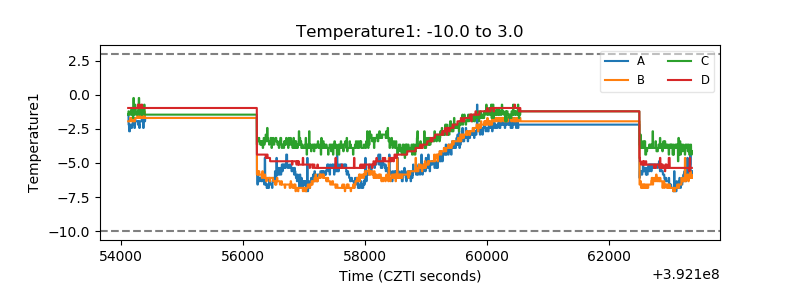 |
| Veto HV Monitor | 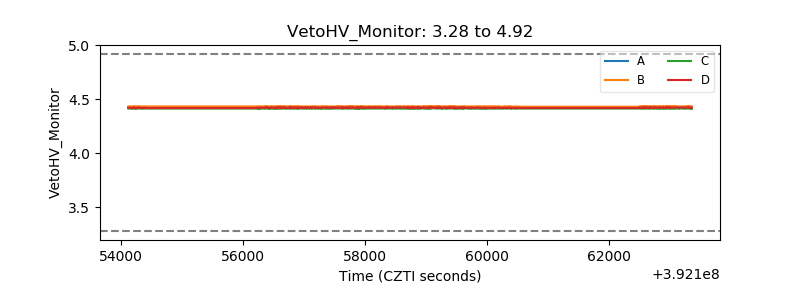 |
| Veto LLD | 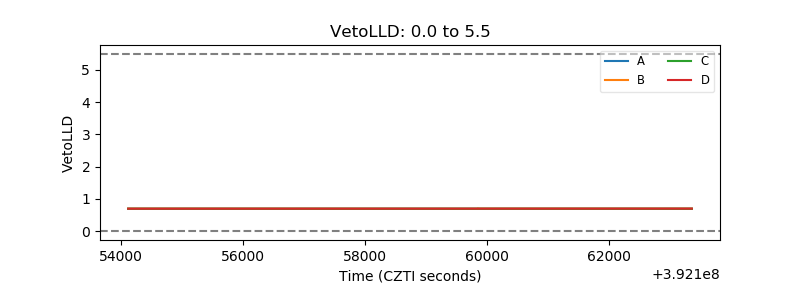 |
| Alpha Counter | 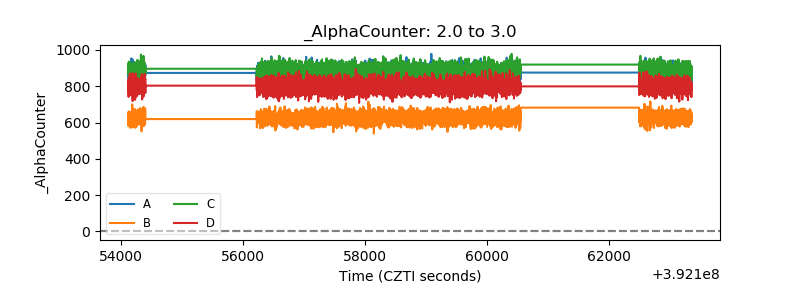 |
| _CPM_Rate | 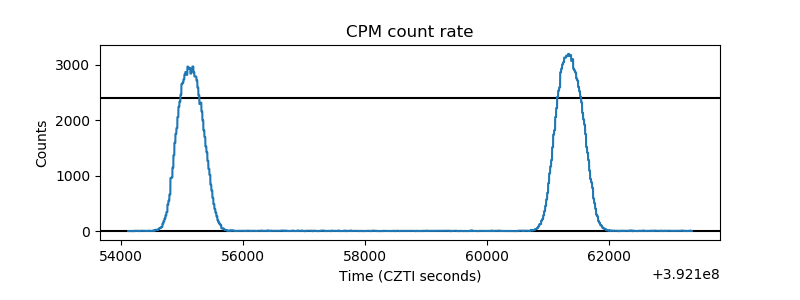 |
| CZT Counter | 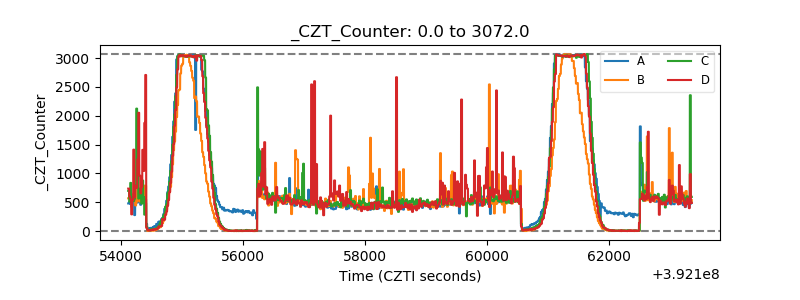 |
| +2.5 Volts monitor | 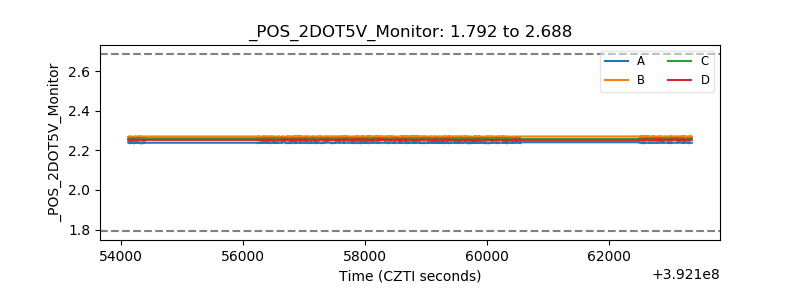 |
| +5 Volts monitor | 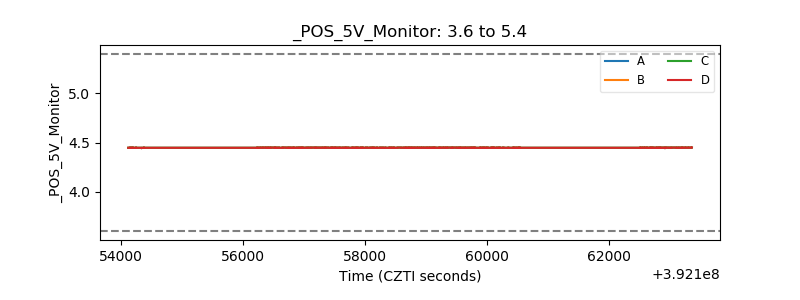 |
| _ROLL_ROT | 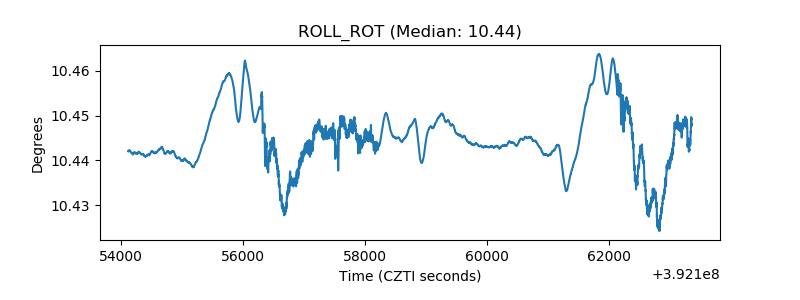 |
| _Roll_DEC | 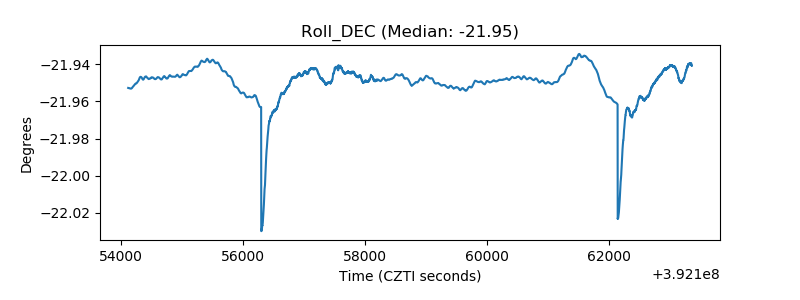 |
| _Roll_RA | 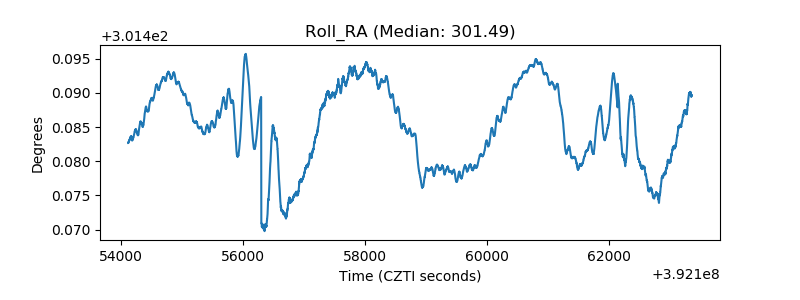 |
| Veto Counter | 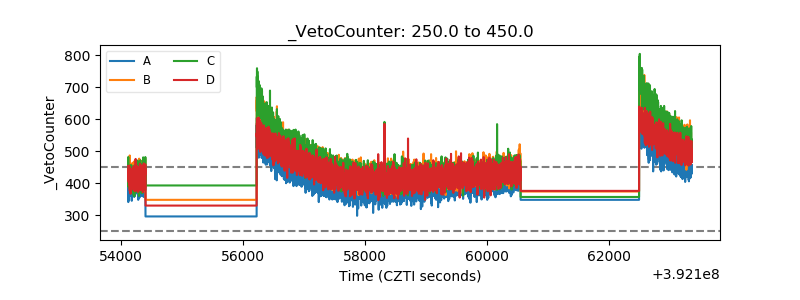 |