| Param | Original file | Final file |
|---|---|---|
| Filename | modeM0/AS1A11_059T08_9000005160_36157cztM0_level2.evt | modeM0/AS1A11_059T08_9000005160_36157cztM0_level2_quad_clean.evt |
| Size (bytes) | 425,629,440 | 89,421,120 |
| Size | 405.9 MB | 85.3 MB |
| Events in quadrant A | 2,590,844 | 586,729 |
| Events in quadrant B | 3,037,671 | 618,478 |
| Events in quadrant C | 3,456,453 | 581,799 |
| Events in quadrant D | 3,451,143 | 555,871 |
| Mode M9 | |||
|---|---|---|---|
| Quadrant | BADHDUFLAG | Total packets | Discarded packets |
| A | 0 | 24 | 0 |
| B | 0 | 24 | 0 |
| C | 0 | 24 | 0 |
| D | 0 | 25 | 0 |
| Mode M0 | |||
|---|---|---|---|
| Quadrant | BADHDUFLAG | Total packets | Discarded packets |
| A | 0 | 11013 | 3 |
| B | 0 | 12299 | 2 |
| C | 0 | 13432 | 2 |
| D | 0 | 13851 | 2 |
| Mode SS | |||
|---|---|---|---|
| Quadrant | BADHDUFLAG | Total packets | Discarded packets |
| A | 0 | 104 | 0 |
| B | 0 | 104 | 0 |
| C | 0 | 104 | 0 |
| D | 0 | 104 | 0 |
| Quadrant | Total seconds | Saturated seconds | Saturation percentage |
|---|---|---|---|
| A | 5220 | 8 | 0.153257% |
| B | 5220 | 74 | 1.417625% |
| C | 5220 | 169 | 3.237548% |
| D | 5220 | 246 | 4.712644% |
Noise dominated data is calculated using 1-second bins in cleaned event files. If a bin has >2000 counts, and if more than 50% of those come from <1% of pixels, then it is considered to be noise-dominated and hence unusable.
| Quadrant | # 1 sec bins | Bins with >0 counts | Bins with >2000 counts | High rate bins dominated by noise | Noise dominated (total time) | Noise dominated (detector-on time) | Marked lightcurve |
|---|---|---|---|---|---|---|---|
| A | 7043 | 5221 | 1 | 1 | 0.01% | 0.02% | 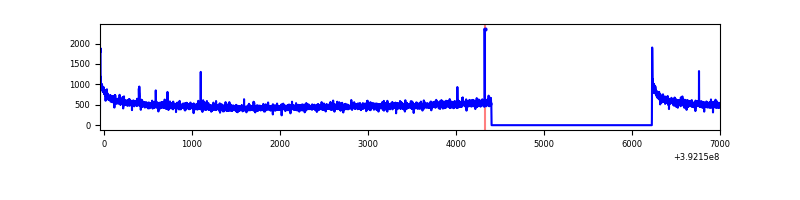 |
| B | 7043 | 5221 | 41 | 41 | 0.58% | 0.79% | 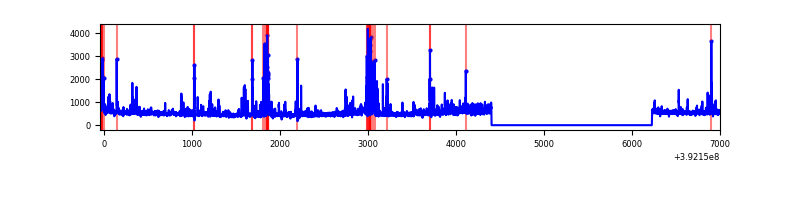 |
| C | 7043 | 5221 | 132 | 132 | 1.87% | 2.53% | 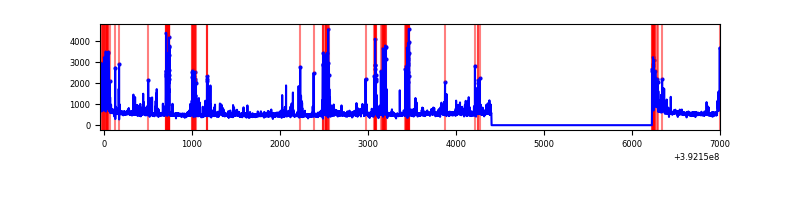 |
| D | 7043 | 5220 | 187 | 187 | 2.66% | 3.58% | 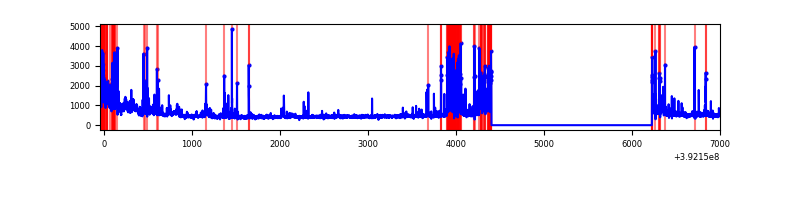 |
Top three noisy pixels from each quadrant. If the there are fewer than three noisy pixels in the level2.evt file, extra rows are filled as -1
| Pixel properties | Quadrant properties | ||||||
|---|---|---|---|---|---|---|---|
| Quadrant | DetID | PixID | Counts | Sigma | Mean | Median | Sigma |
| A | 10 | 83 | 170851 | 1351.95 | 619 | 607 | 125.9 |
| A | 9 | 143 | 15869 | 121.2 | 619 | 607 | 125.9 |
| A | 13 | 254 | 8527 | 62.89 | 619 | 607 | 125.9 |
| B | 5 | 172 | 301850 | 2500.81 | 627 | 611 | 120.5 |
| B | 0 | 246 | 110012 | 908.22 | 627 | 611 | 120.5 |
| B | 0 | 213 | 78187 | 644.02 | 627 | 611 | 120.5 |
| C | 0 | 207 | 549378 | 3886.19 | 608 | 613 | 141.2 |
| C | 15 | 214 | 217571 | 1536.43 | 608 | 613 | 141.2 |
| C | 0 | 10 | 178063 | 1256.65 | 608 | 613 | 141.2 |
| D | 1 | 52 | 382297 | 2626.25 | 597 | 581 | 145.3 |
| D | 12 | 17 | 338226 | 2323.04 | 597 | 581 | 145.3 |
| D | 13 | 249 | 127282 | 871.72 | 597 | 581 | 145.3 |
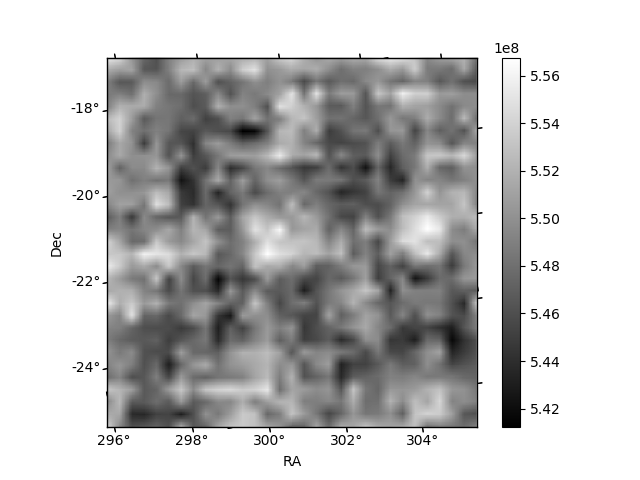
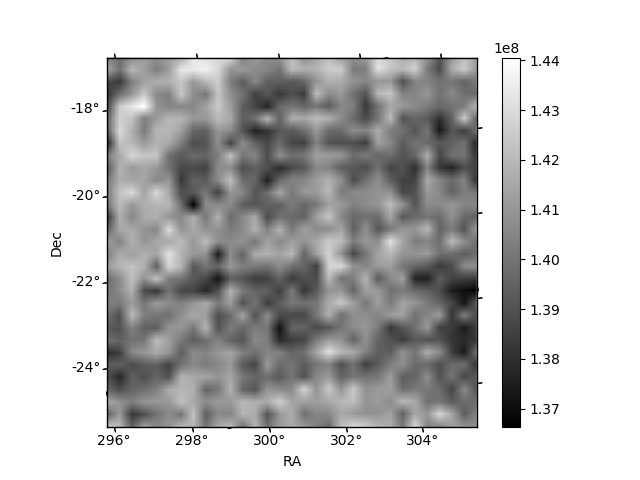
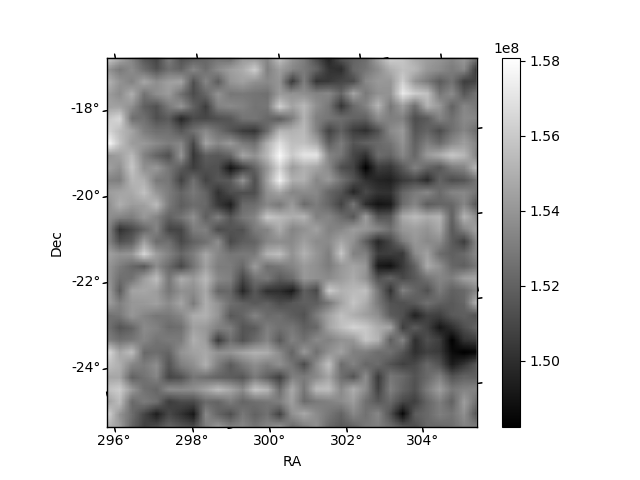
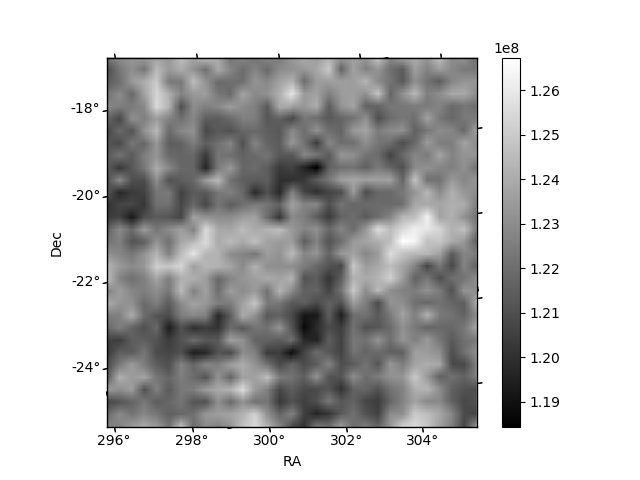
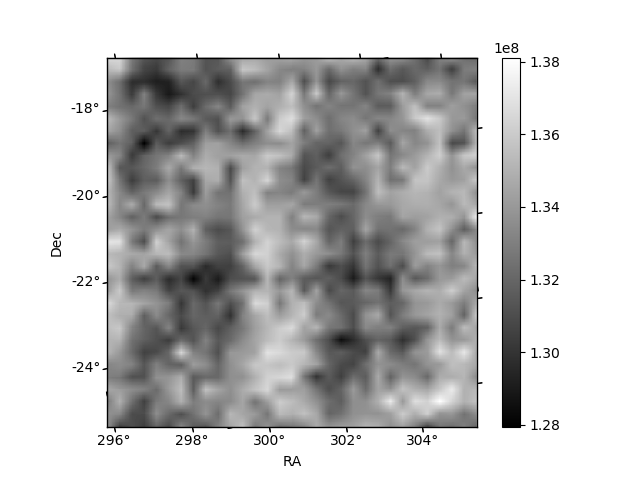
Histogram calculated using DETX and DETY for each event in the final _common_clean file
| Quadrant A | 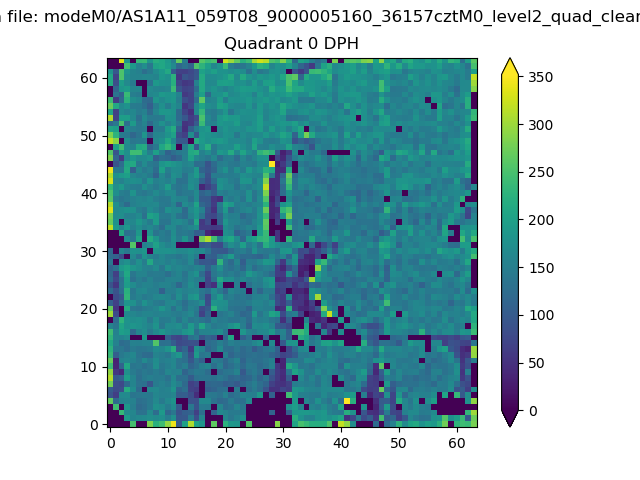 |
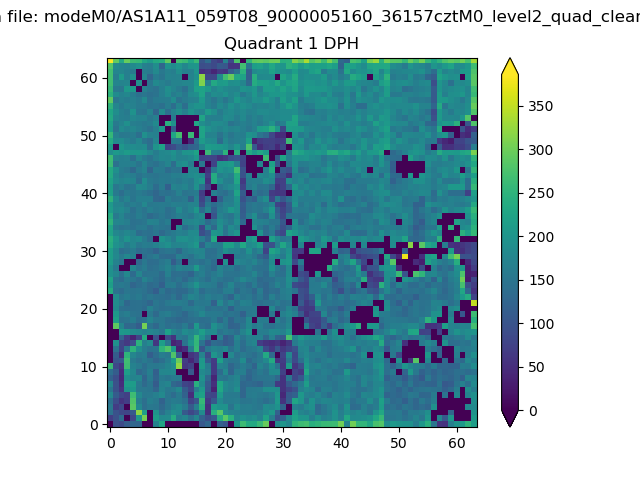 |
Quadrant B |
|---|---|---|---|
| Quadrant D | 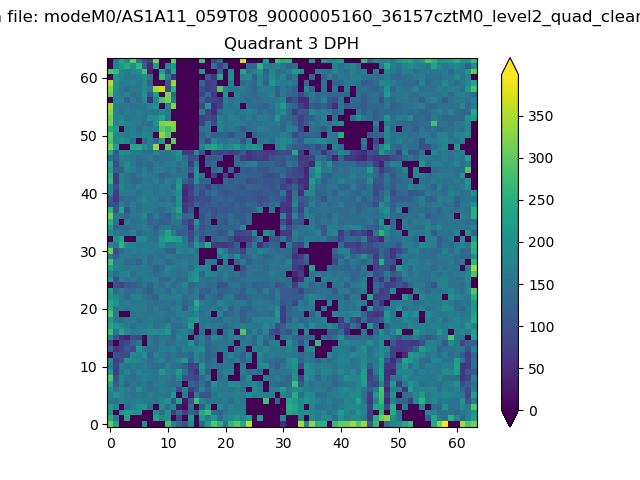 |
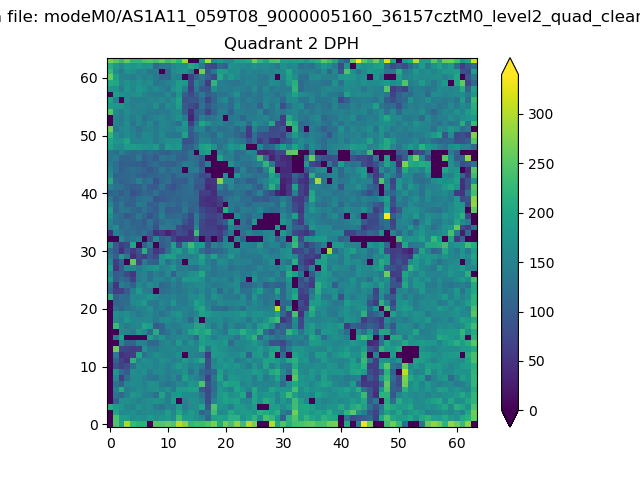 |
Quadrant C |
| Plot type | Count rate plots | Images |
|---|---|---|
| Comparison with Poisson distribution Blue bars denote a histogram of data divided into 1 sec bins. Red curve is a Poisson curve with rate = median count rate of data. |
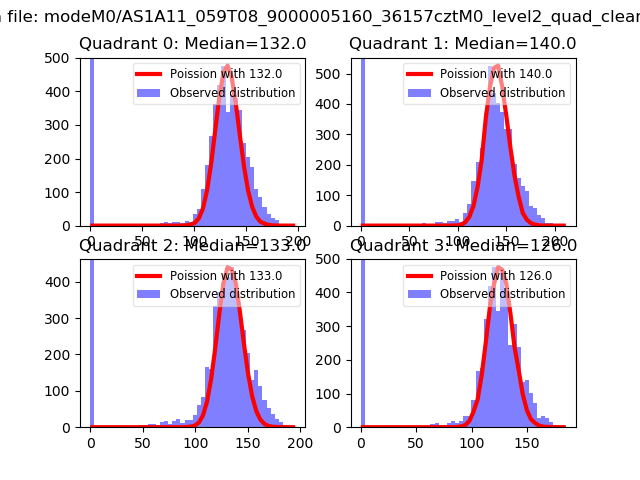 |
 |
| Quadrant-wise count rates Data is divided into 100 sec bins |
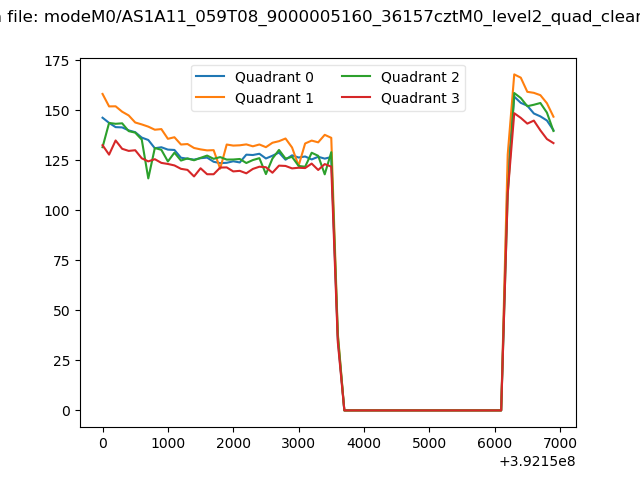 |
|
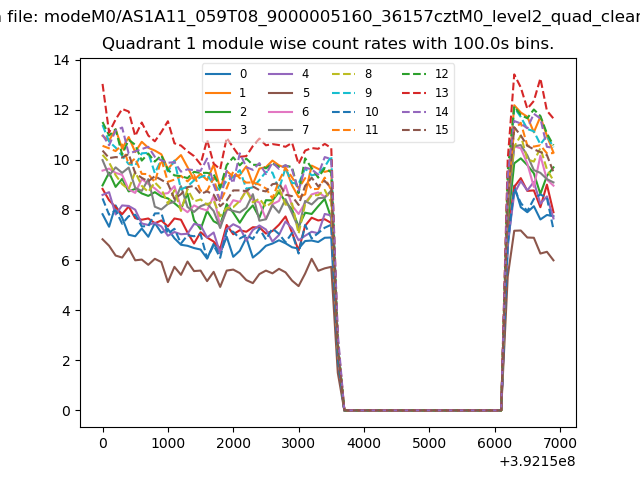
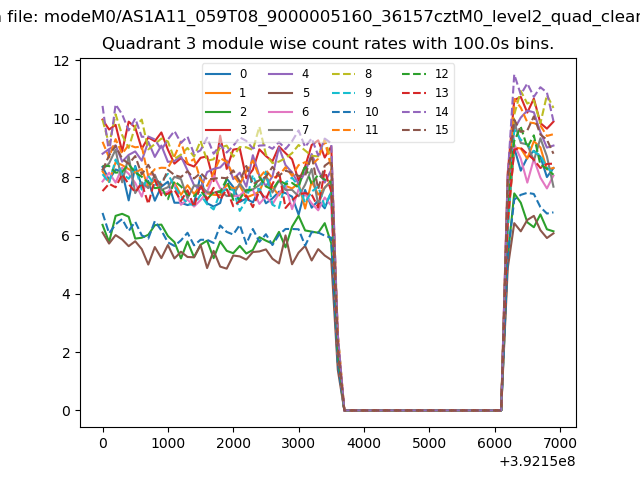
| Module-wise count rates for Quadrant A Data is divided into 100 sec bins |
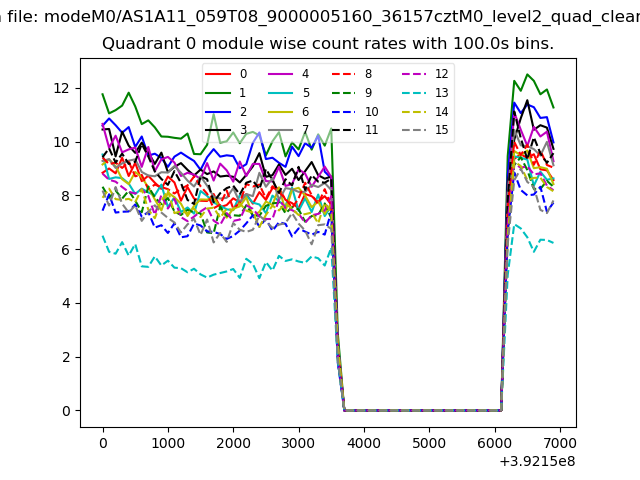 |
 |
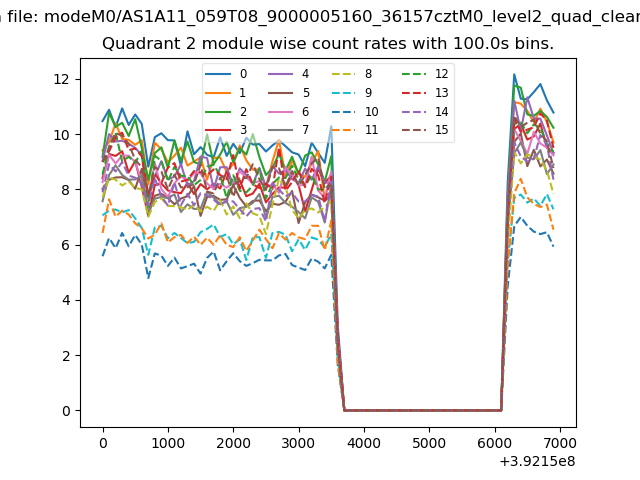
| Module-wise count rates for Quadrant B Data is divided into 100 sec bins |
 |
 |
| Module-wise count rates for Quadrant C Data is divided into 100 sec bins |
 |
 |
| Module-wise count rates for Quadrant D Data is divided into 100 sec bins |
 |
 |
| Parameter | Plot |
|---|---|
| CZT HV Monitor | 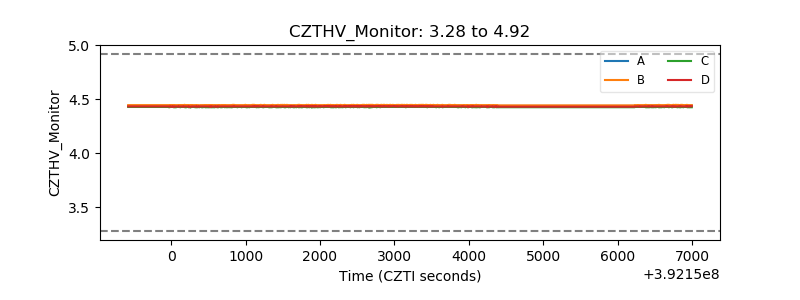 |
| D_VDD | 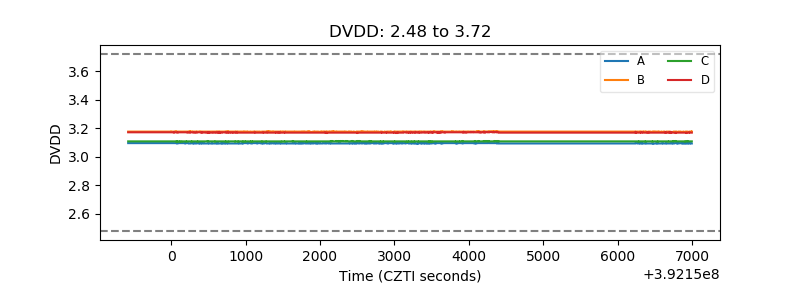 |
| Temperature 1 | 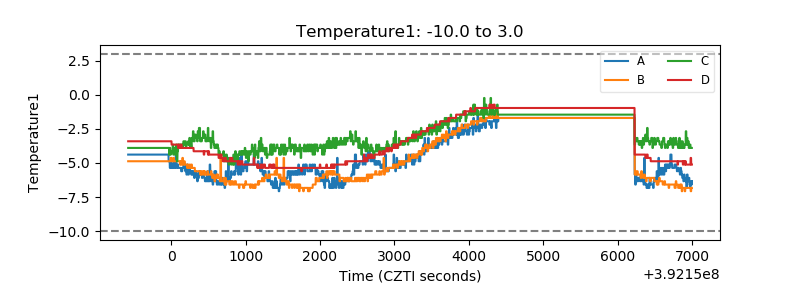 |
| Veto HV Monitor | 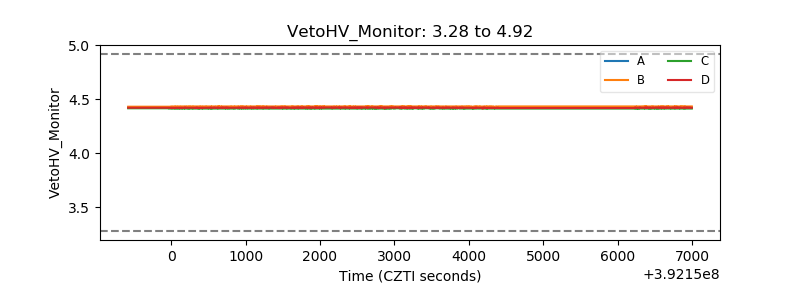 |
| Veto LLD | 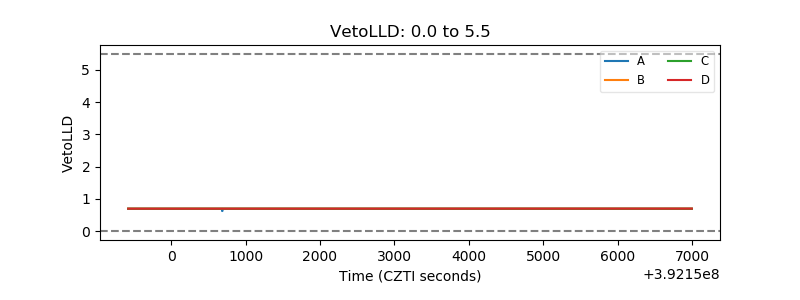 |
| Alpha Counter | 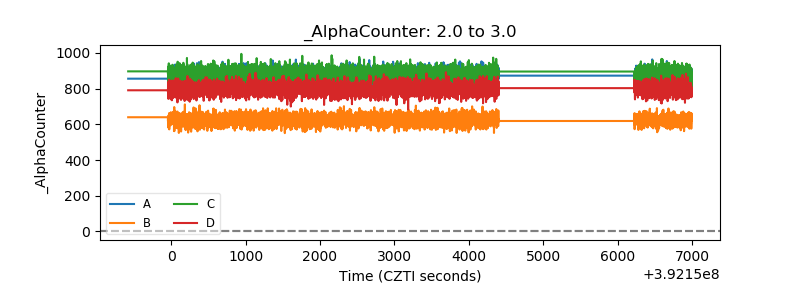 |
| _CPM_Rate | 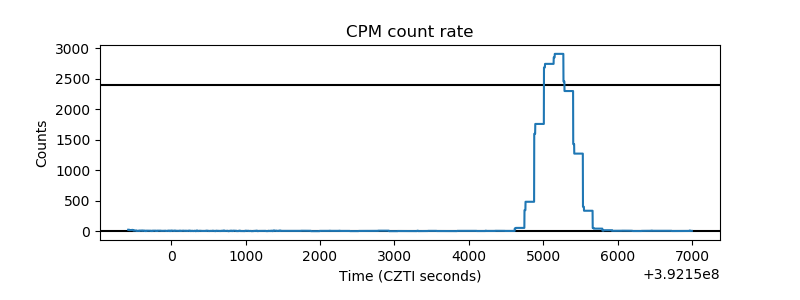 |
| CZT Counter | 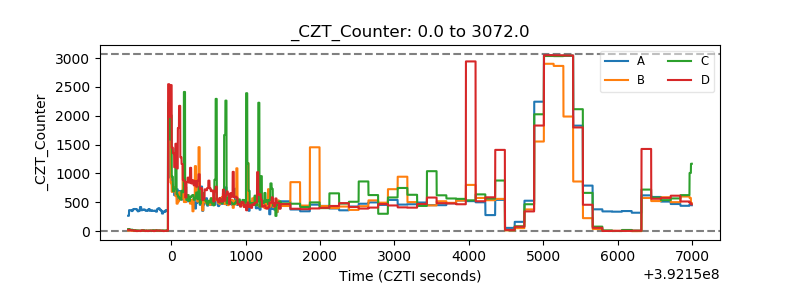 |
| +2.5 Volts monitor | 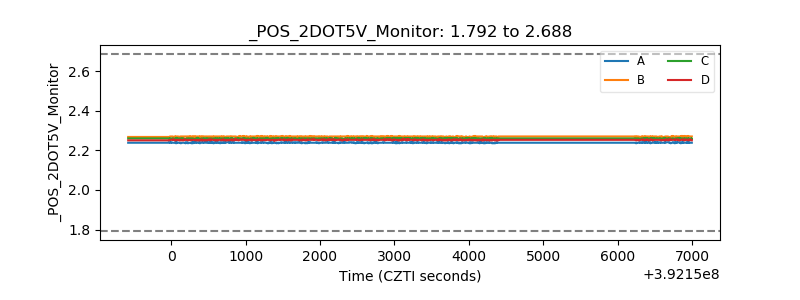 |
| +5 Volts monitor | 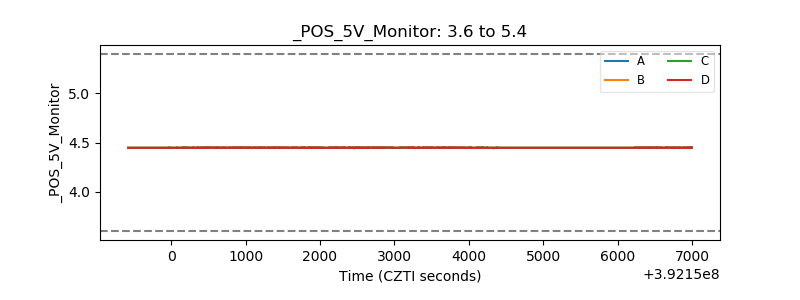 |
| _ROLL_ROT | 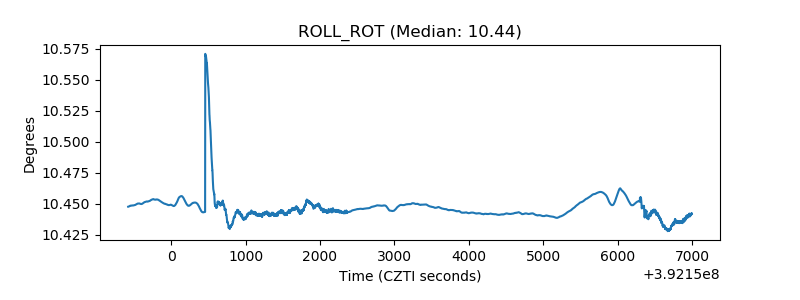 |
| _Roll_DEC | 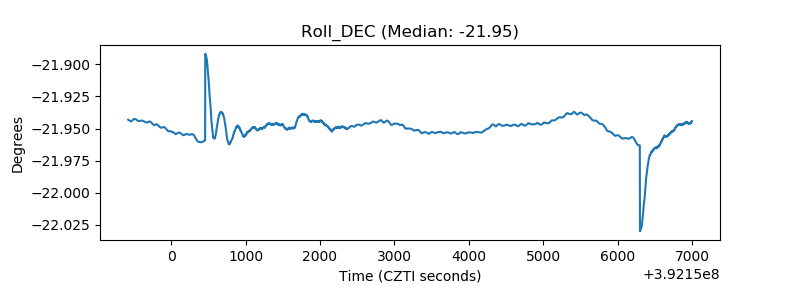 |
| _Roll_RA | 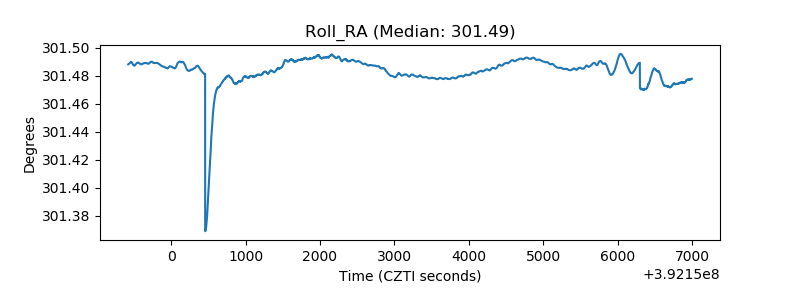 |
| Veto Counter | 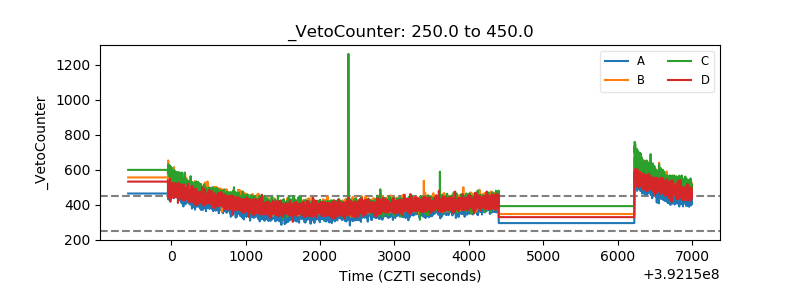 |