| Param | Original file | Final file |
|---|---|---|
| Filename | modeM0/AS1T04_069T01_9000005158_36153cztM0_level2.evt | modeM0/AS1T04_069T01_9000005158_36153cztM0_level2_quad_clean.evt |
| Size (bytes) | 887,247,360 | 151,277,760 |
| Size | 846.1 MB | 144.3 MB |
| Events in quadrant A | 5,349,979 | 994,845 |
| Events in quadrant B | 6,553,190 | 981,795 |
| Events in quadrant C | 6,087,429 | 963,726 |
| Events in quadrant D | 8,136,312 | 879,628 |
| Mode M0 | |||
|---|---|---|---|
| Quadrant | BADHDUFLAG | Total packets | Discarded packets |
| A | 0 | 22838 | 4 |
| B | 0 | 26602 | 3 |
| C | 0 | 24884 | 3 |
| D | 0 | 31431 | 3 |
| Mode M9 | |||
|---|---|---|---|
| Quadrant | BADHDUFLAG | Total packets | Discarded packets |
| A | 0 | 41 | 0 |
| B | 0 | 41 | 0 |
| C | 0 | 41 | 0 |
| D | 0 | 41 | 0 |
| Mode SS | |||
|---|---|---|---|
| Quadrant | BADHDUFLAG | Total packets | Discarded packets |
| A | 0 | 224 | 0 |
| B | 0 | 224 | 0 |
| C | 0 | 224 | 0 |
| D | 0 | 224 | 0 |
| Quadrant | Total seconds | Saturated seconds | Saturation percentage |
|---|---|---|---|
| A | 11003 | 18 | 0.163592% |
| B | 11003 | 256 | 2.326638% |
| C | 11003 | 110 | 0.999727% |
| D | 11003 | 896 | 8.143234% |
Noise dominated data is calculated using 1-second bins in cleaned event files. If a bin has >2000 counts, and if more than 50% of those come from <1% of pixels, then it is considered to be noise-dominated and hence unusable.
| Quadrant | # 1 sec bins | Bins with >0 counts | Bins with >2000 counts | High rate bins dominated by noise | Noise dominated (total time) | Noise dominated (detector-on time) | Marked lightcurve |
|---|---|---|---|---|---|---|---|
| A | 15062 | 11006 | 1 | 1 | 0.01% | 0.01% |  |
| B | 15062 | 11006 | 179 | 179 | 1.19% | 1.63% | 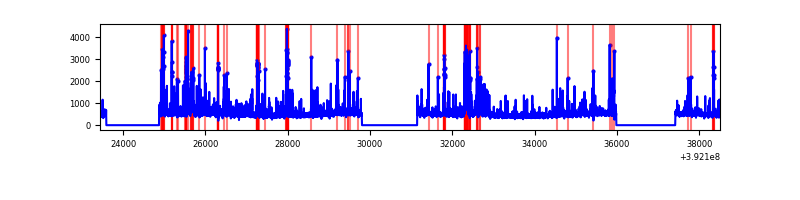 |
| C | 15062 | 11006 | 81 | 81 | 0.54% | 0.74% | 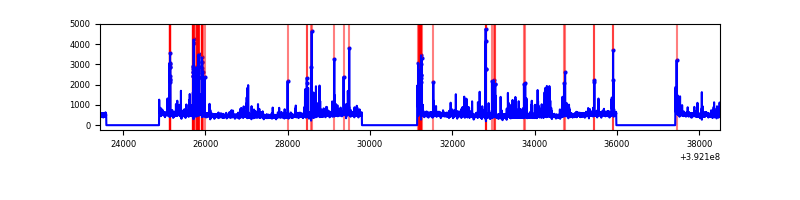 |
| D | 15062 | 11006 | 820 | 820 | 5.44% | 7.45% | 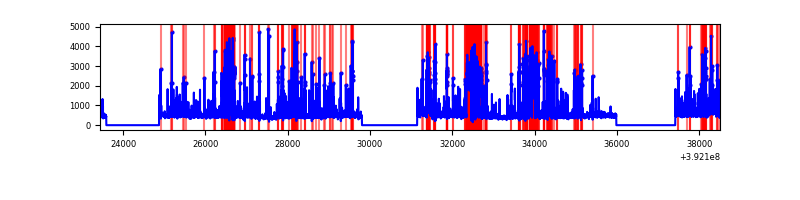 |
Top three noisy pixels from each quadrant. If the there are fewer than three noisy pixels in the level2.evt file, extra rows are filled as -1
| Pixel properties | Quadrant properties | ||||||
|---|---|---|---|---|---|---|---|
| Quadrant | DetID | PixID | Counts | Sigma | Mean | Median | Sigma |
| A | 10 | 83 | 317192 | 1232.64 | 1270 | 1244 | 256.3 |
| A | 9 | 143 | 49988 | 190.17 | 1270 | 1244 | 256.3 |
| A | 8 | 144 | 38360 | 144.8 | 1270 | 1244 | 256.3 |
| B | 5 | 172 | 975562 | 4048.7 | 1246 | 1212 | 240.7 |
| B | 0 | 213 | 222195 | 918.25 | 1246 | 1212 | 240.7 |
| B | 4 | 171 | 213061 | 880.29 | 1246 | 1212 | 240.7 |
| C | 0 | 207 | 608386 | 2133.18 | 1218 | 1227 | 284.6 |
| C | 15 | 214 | 464233 | 1626.71 | 1218 | 1227 | 284.6 |
| C | 15 | 208 | 126812 | 441.23 | 1218 | 1227 | 284.6 |
| D | 13 | 249 | 1872115 | 6422.02 | 1184 | 1150 | 291.3 |
| D | 12 | 6 | 449587 | 1539.24 | 1184 | 1150 | 291.3 |
| D | 1 | 52 | 336038 | 1149.49 | 1184 | 1150 | 291.3 |
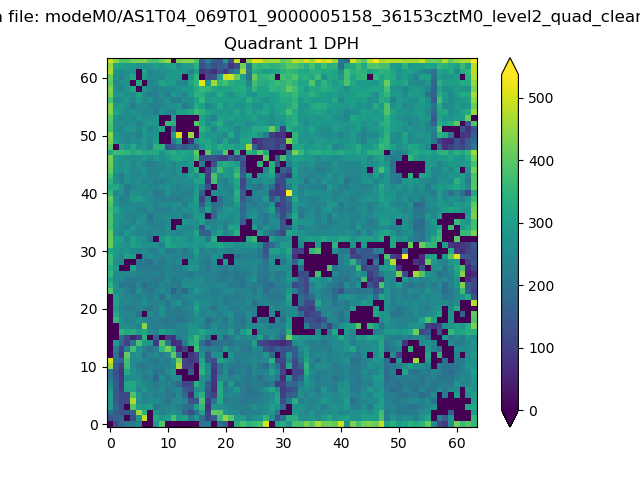
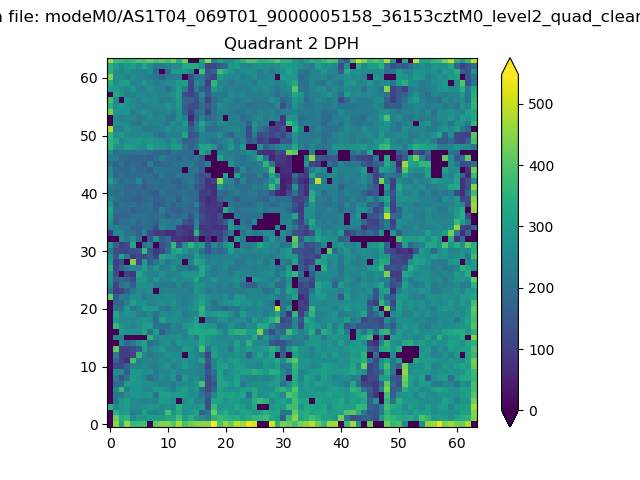
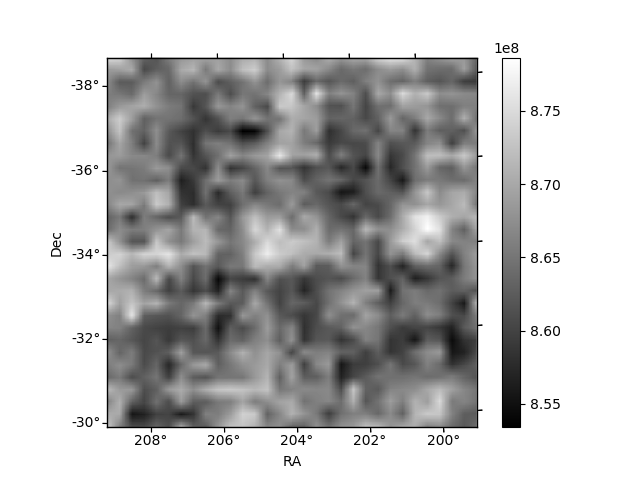
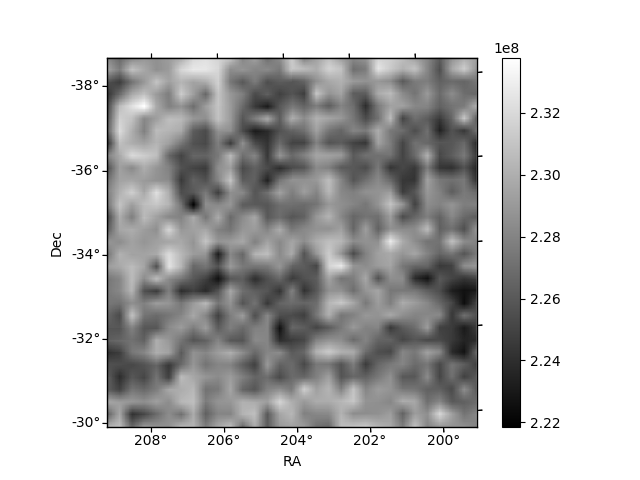
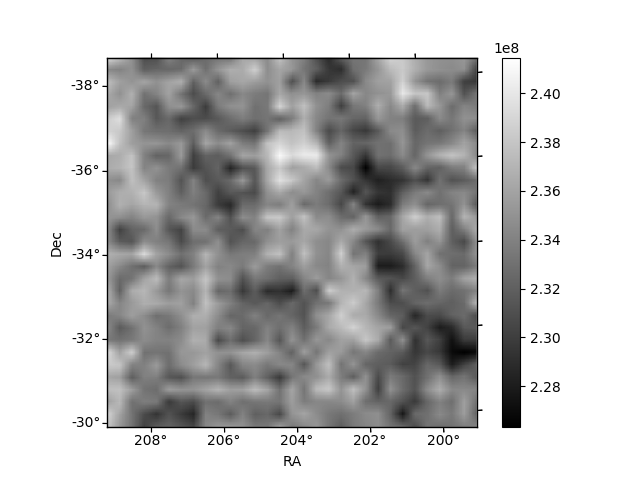
Histogram calculated using DETX and DETY for each event in the final _common_clean file
| Quadrant A | 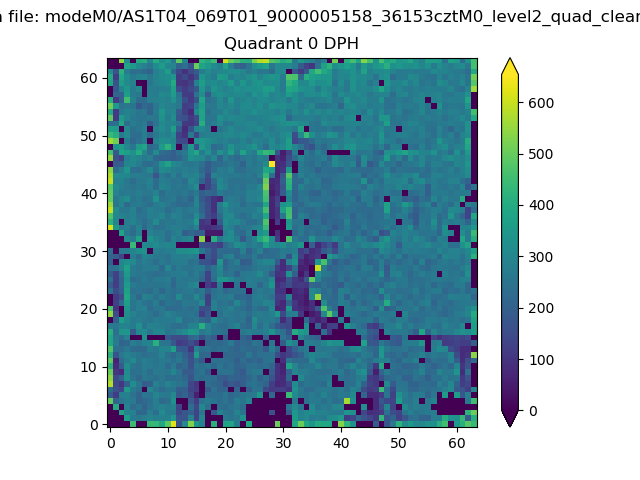 |
 |
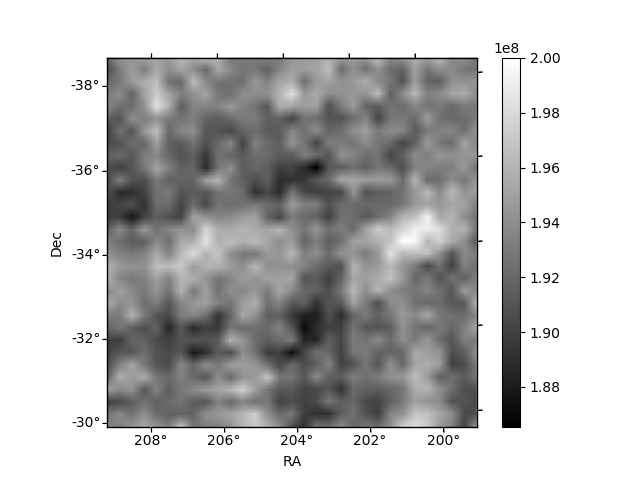
Quadrant B |
|---|---|---|---|
| Quadrant D | 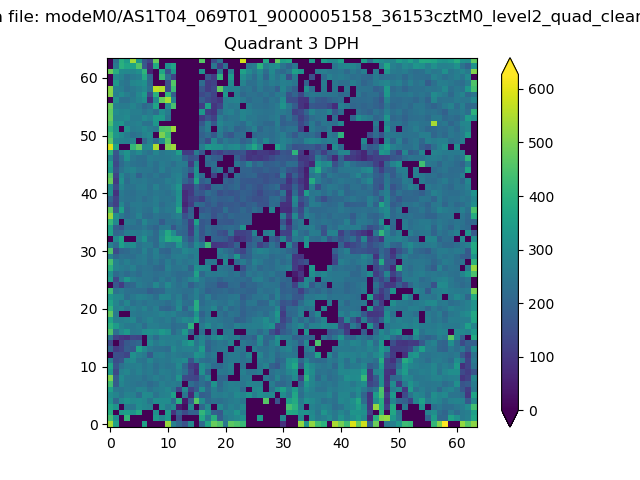 |
 |
Quadrant C |
| Plot type | Count rate plots | Images |
|---|---|---|
| Comparison with Poisson distribution Blue bars denote a histogram of data divided into 1 sec bins. Red curve is a Poisson curve with rate = median count rate of data. |
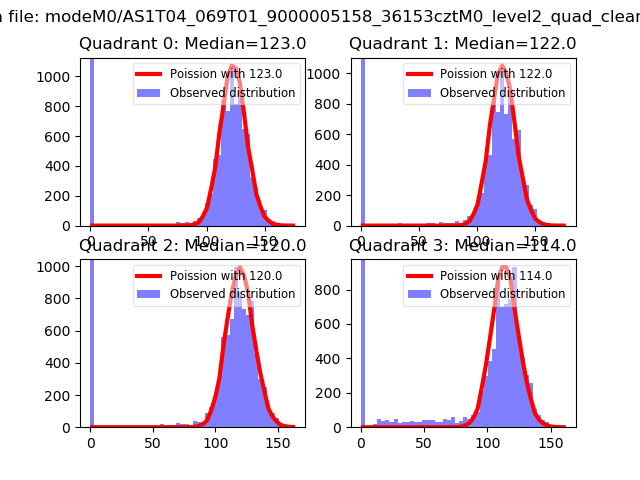 |
 |
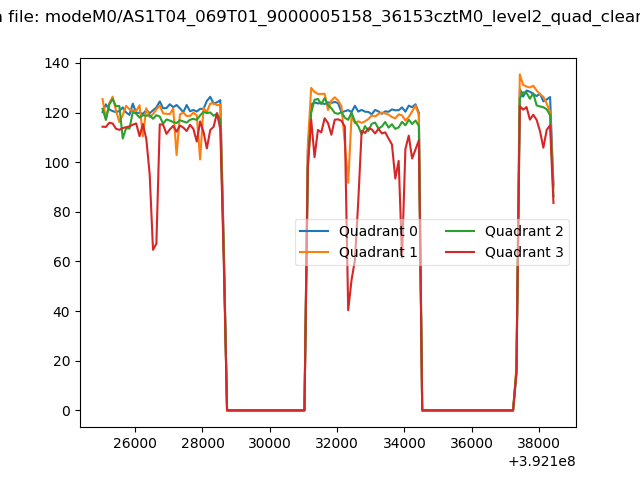
| Quadrant-wise count rates Data is divided into 100 sec bins |
 |
|
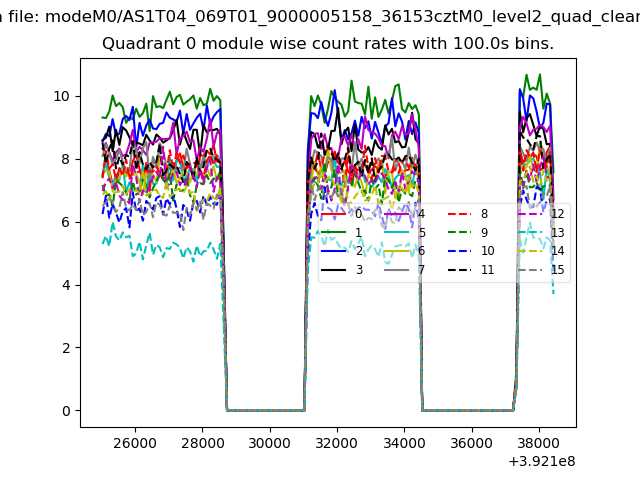
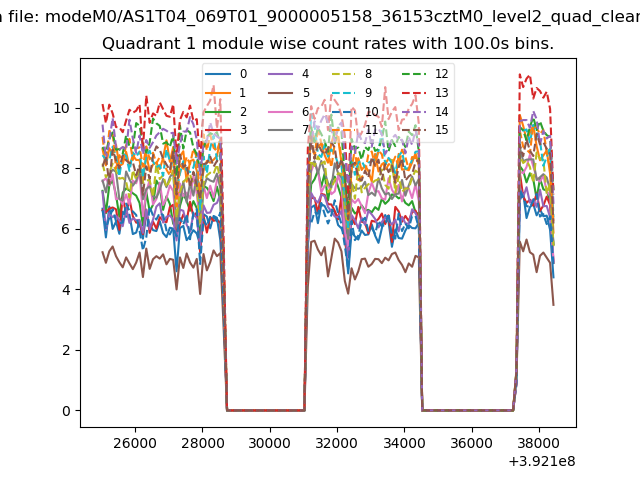
| Module-wise count rates for Quadrant A Data is divided into 100 sec bins |
 |
 |
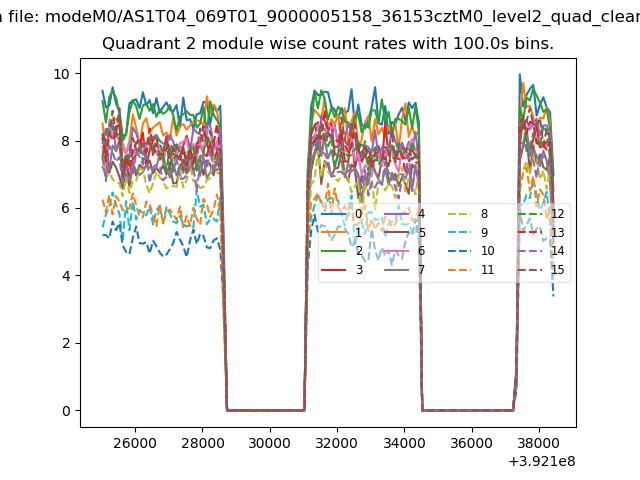
| Module-wise count rates for Quadrant B Data is divided into 100 sec bins |
 |
 |
| Module-wise count rates for Quadrant C Data is divided into 100 sec bins |
 |
 |
| Module-wise count rates for Quadrant D Data is divided into 100 sec bins |
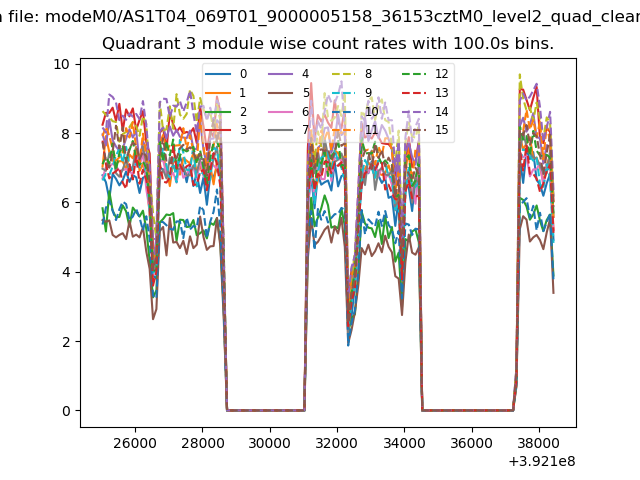 |
 |
| Parameter | Plot |
|---|---|
| CZT HV Monitor | 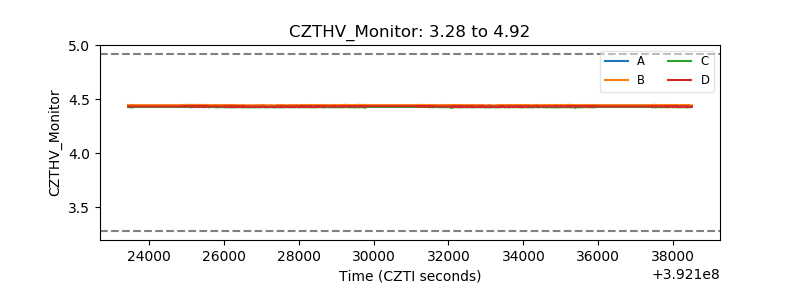 |
| D_VDD | 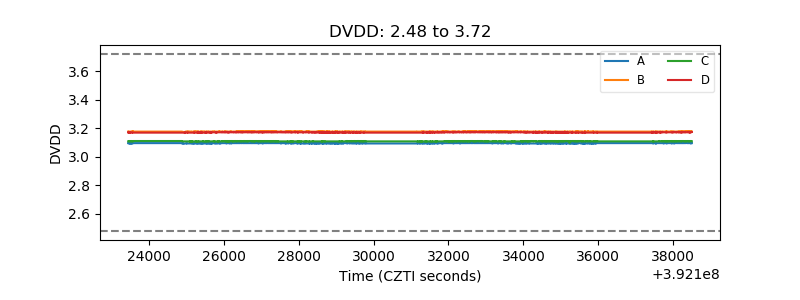 |
| Temperature 1 | 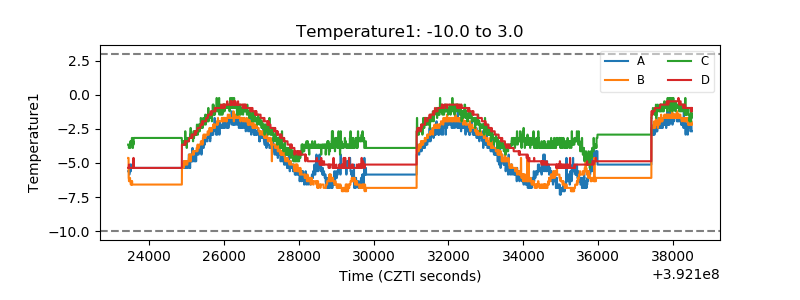 |
| Veto HV Monitor | 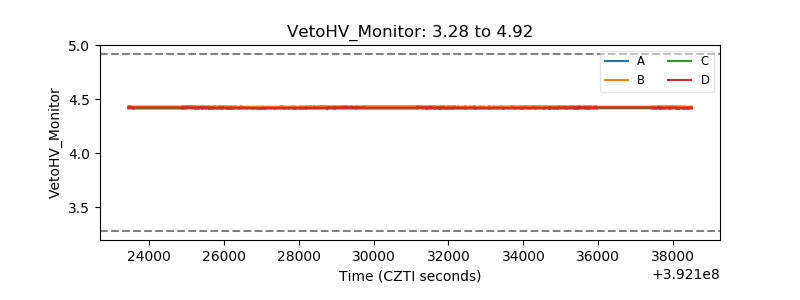 |
| Veto LLD | 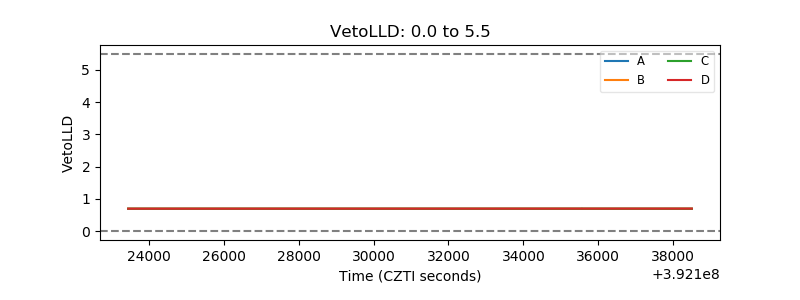 |
| Alpha Counter | 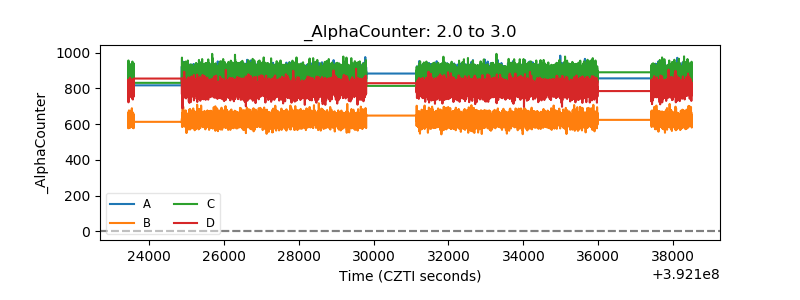 |
| _CPM_Rate | 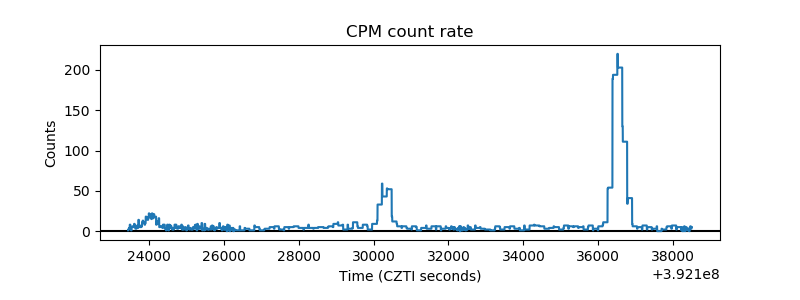 |
| CZT Counter | 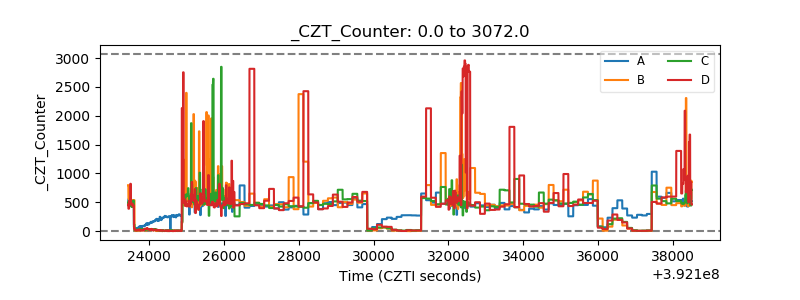 |
| +2.5 Volts monitor | 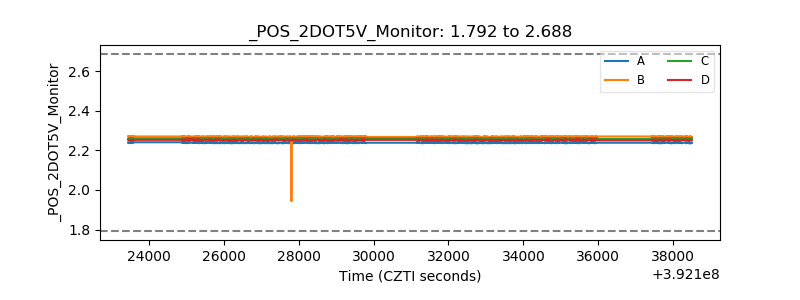 |
| +5 Volts monitor | 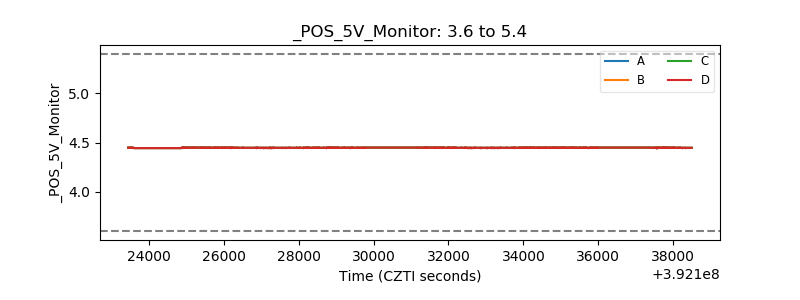 |
| _ROLL_ROT | 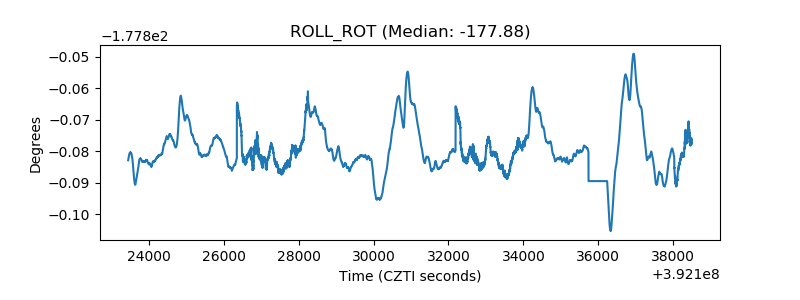 |
| _Roll_DEC | 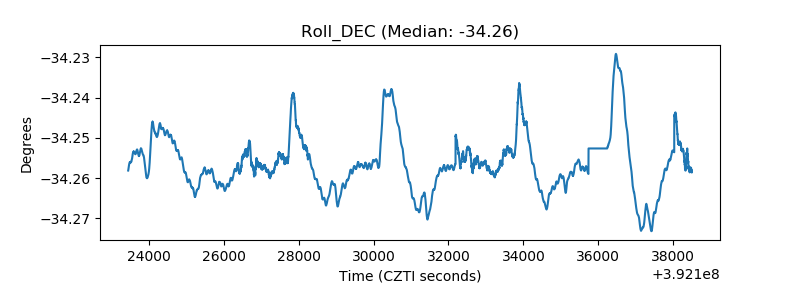 |
| _Roll_RA | 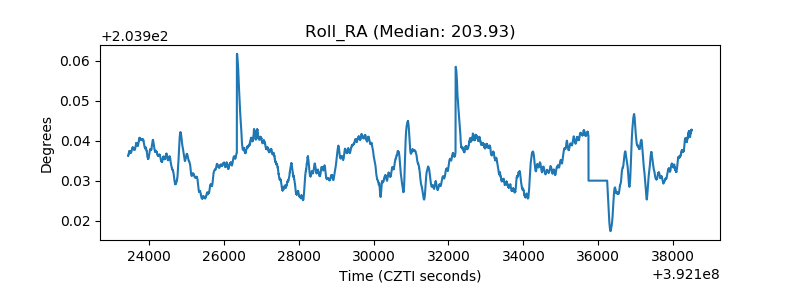 |
| Veto Counter | 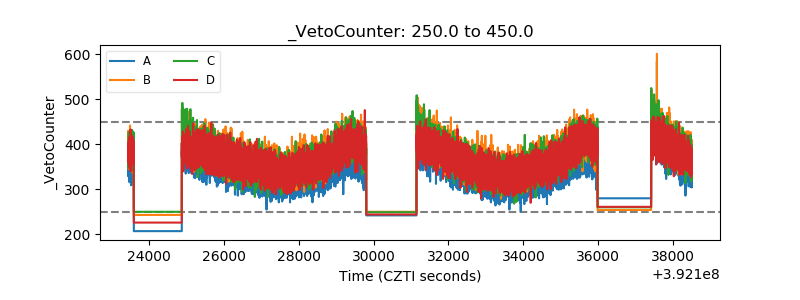 |