| Param | Original file | Final file |
|---|---|---|
| Filename | modeM0/AS1T04_069T01_9000005158_36150cztM0_level2.evt | modeM0/AS1T04_069T01_9000005158_36150cztM0_level2_quad_clean.evt |
| Size (bytes) | 1,830,490,560 | 282,381,120 |
| Size | 1.7 GB | 269.3 MB |
| Events in quadrant A | 11,471,342 | 1,782,798 |
| Events in quadrant B | 13,444,088 | 1,788,383 |
| Events in quadrant C | 12,198,816 | 1,755,606 |
| Events in quadrant D | 16,743,130 | 1,614,179 |
| Mode M0 | |||
|---|---|---|---|
| Quadrant | BADHDUFLAG | Total packets | Discarded packets |
| A | 0 | 48260 | 7 |
| B | 0 | 54716 | 6 |
| C | 0 | 49607 | 6 |
| D | 0 | 65314 | 6 |
| Mode M9 | |||
|---|---|---|---|
| Quadrant | BADHDUFLAG | Total packets | Discarded packets |
| A | 0 | 94 | 0 |
| B | 0 | 94 | 0 |
| C | 0 | 94 | 0 |
| D | 0 | 95 | 0 |
| Mode SS | |||
|---|---|---|---|
| Quadrant | BADHDUFLAG | Total packets | Discarded packets |
| A | 0 | 478 | 0 |
| B | 0 | 478 | 0 |
| C | 0 | 478 | 0 |
| D | 0 | 478 | 0 |
| Quadrant | Total seconds | Saturated seconds | Saturation percentage |
|---|---|---|---|
| A | 23419 | 34 | 0.145181% |
| B | 23419 | 428 | 1.827576% |
| C | 23419 | 146 | 0.623425% |
| D | 23419 | 1034 | 4.415218% |
Noise dominated data is calculated using 1-second bins in cleaned event files. If a bin has >2000 counts, and if more than 50% of those come from <1% of pixels, then it is considered to be noise-dominated and hence unusable.
| Quadrant | # 1 sec bins | Bins with >0 counts | Bins with >2000 counts | High rate bins dominated by noise | Noise dominated (total time) | Noise dominated (detector-on time) | Marked lightcurve |
|---|---|---|---|---|---|---|---|
| A | 32292 | 23424 | 9 | 9 | 0.03% | 0.04% | 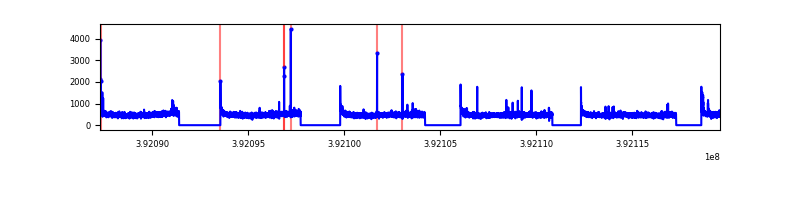 |
| B | 32292 | 23424 | 257 | 257 | 0.80% | 1.10% | 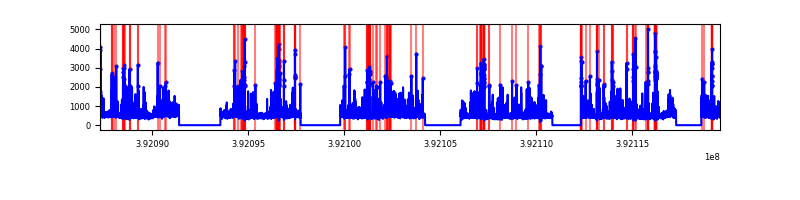 |
| C | 32292 | 23424 | 106 | 106 | 0.33% | 0.45% | 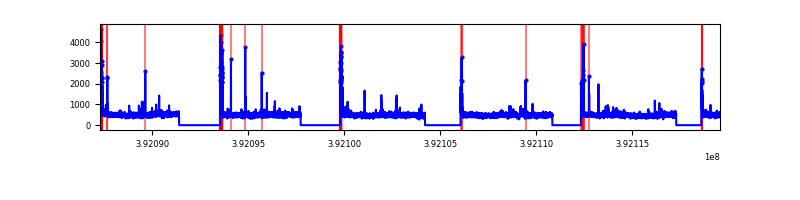 |
| D | 32292 | 23424 | 930 | 930 | 2.88% | 3.97% | 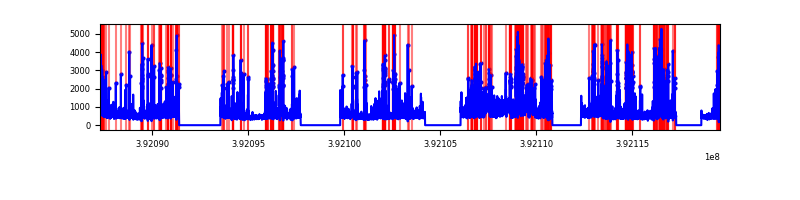 |
Top three noisy pixels from each quadrant. If the there are fewer than three noisy pixels in the level2.evt file, extra rows are filled as -1
| Pixel properties | Quadrant properties | ||||||
|---|---|---|---|---|---|---|---|
| Quadrant | DetID | PixID | Counts | Sigma | Mean | Median | Sigma |
| A | 10 | 83 | 641170 | 1161.37 | 2750 | 2697 | 549.8 |
| A | 9 | 143 | 66552 | 116.15 | 2750 | 2697 | 549.8 |
| A | 8 | 144 | 64281 | 112.02 | 2750 | 2697 | 549.8 |
| B | 5 | 172 | 1922703 | 3722.18 | 2715 | 2642 | 515.8 |
| B | 0 | 213 | 297875 | 572.33 | 2715 | 2642 | 515.8 |
| B | 0 | 190 | 202647 | 387.72 | 2715 | 2642 | 515.8 |
| C | 15 | 214 | 988585 | 1596.02 | 2659 | 2673 | 617.7 |
| C | 0 | 10 | 545249 | 878.34 | 2659 | 2673 | 617.7 |
| C | 1 | 208 | 146999 | 233.64 | 2659 | 2673 | 617.7 |
| D | 1 | 52 | 3070440 | 4805.02 | 2613 | 2540 | 638.5 |
| D | 13 | 249 | 1940489 | 3035.26 | 2613 | 2540 | 638.5 |
| D | 12 | 6 | 392283 | 610.42 | 2613 | 2540 | 638.5 |
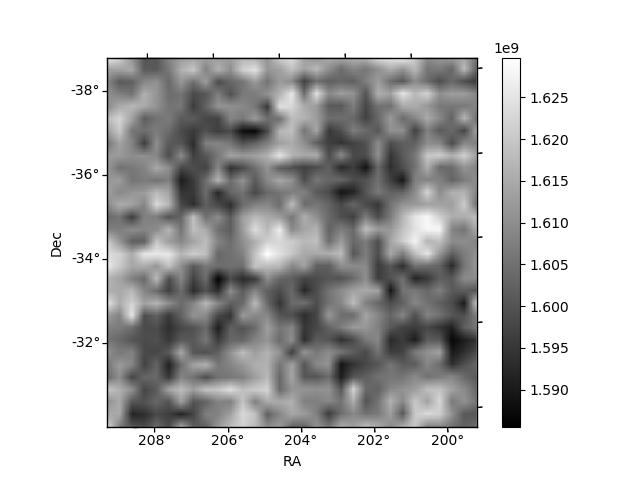
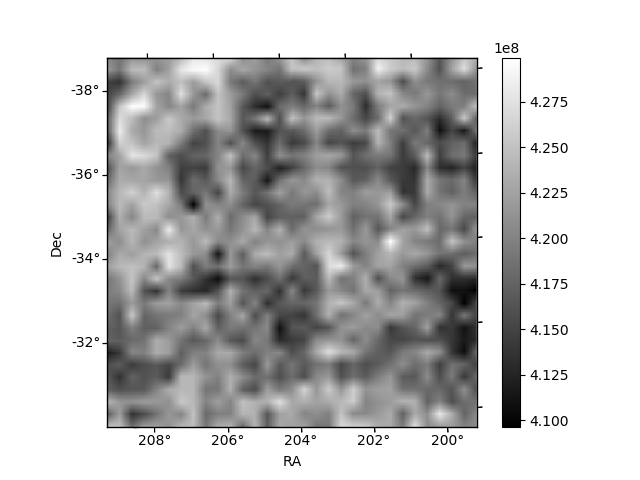
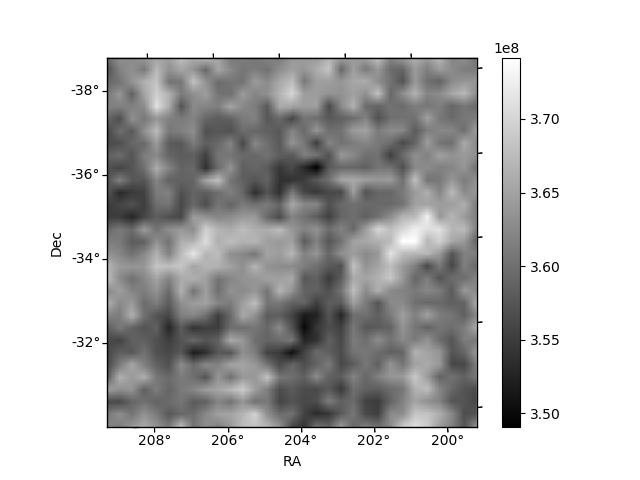
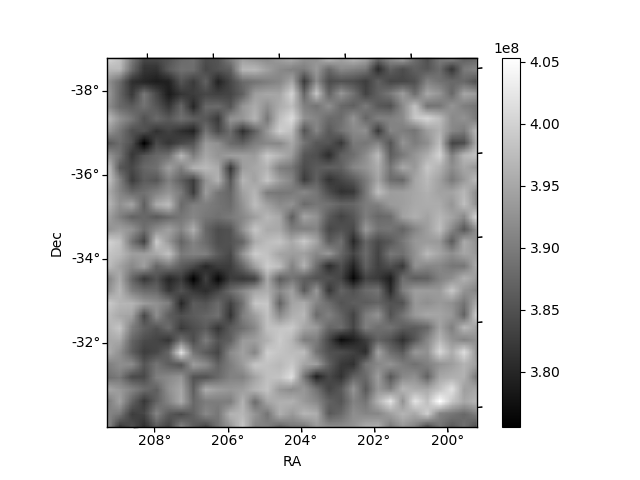
Histogram calculated using DETX and DETY for each event in the final _common_clean file
| Quadrant A | 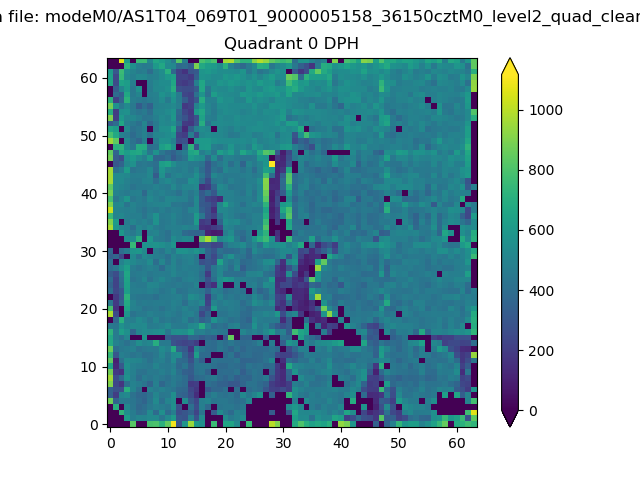 |
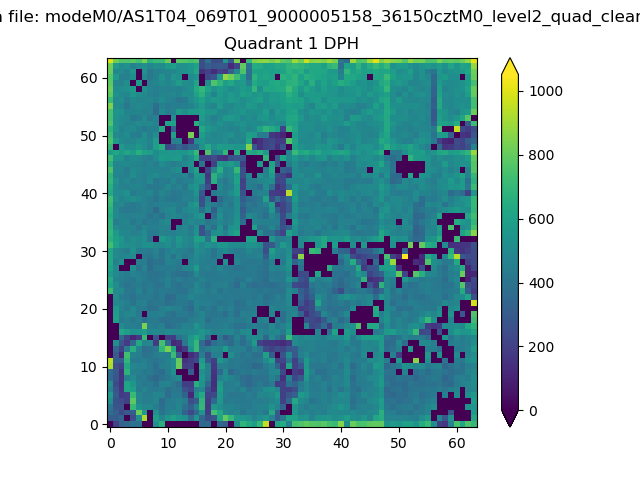 |
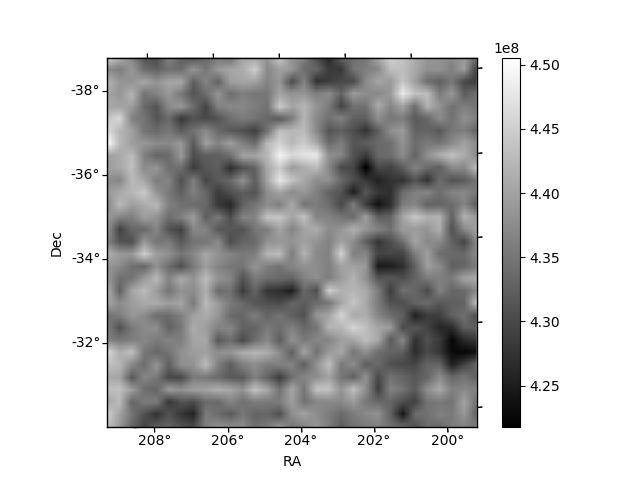
Quadrant B |
|---|---|---|---|
| Quadrant D | 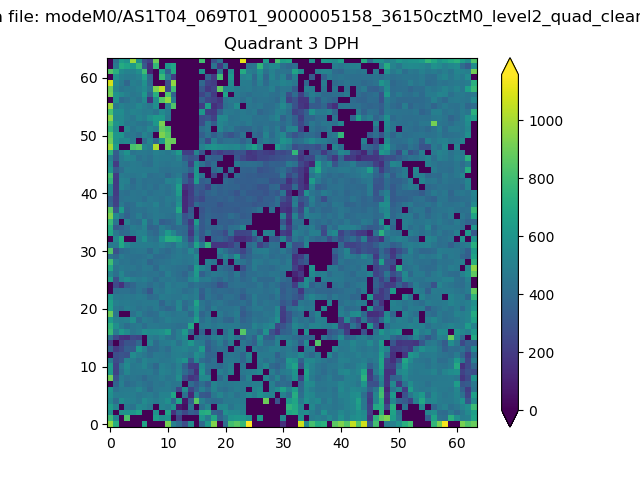 |
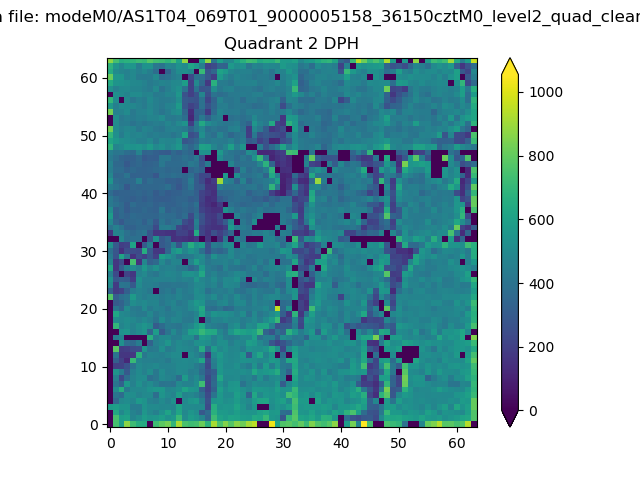 |
Quadrant C |
| Plot type | Count rate plots | Images |
|---|---|---|
| Comparison with Poisson distribution Blue bars denote a histogram of data divided into 1 sec bins. Red curve is a Poisson curve with rate = median count rate of data. |
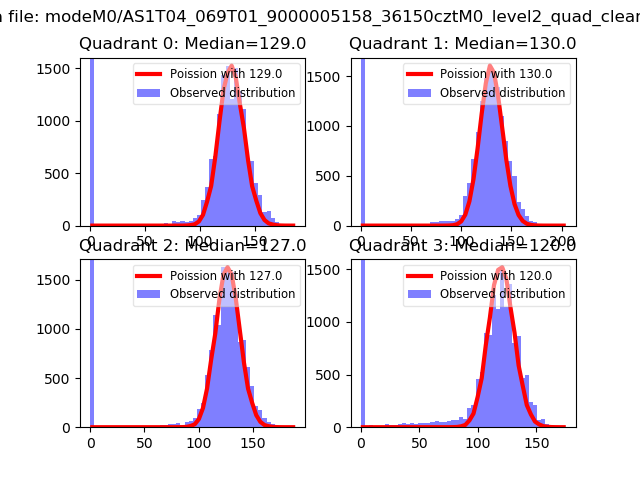 |
 |
| Quadrant-wise count rates Data is divided into 100 sec bins |
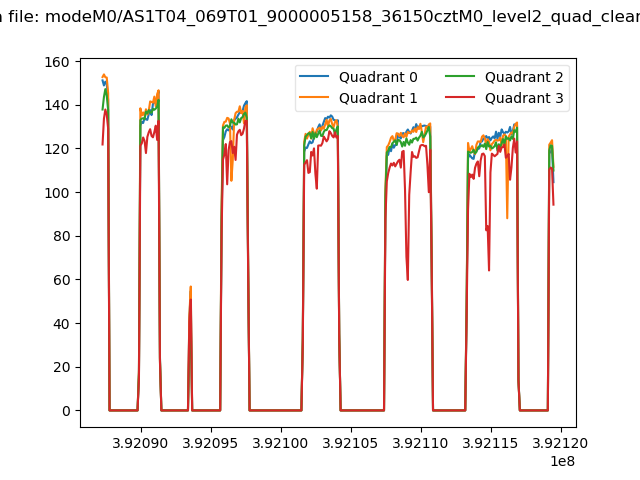 |
|
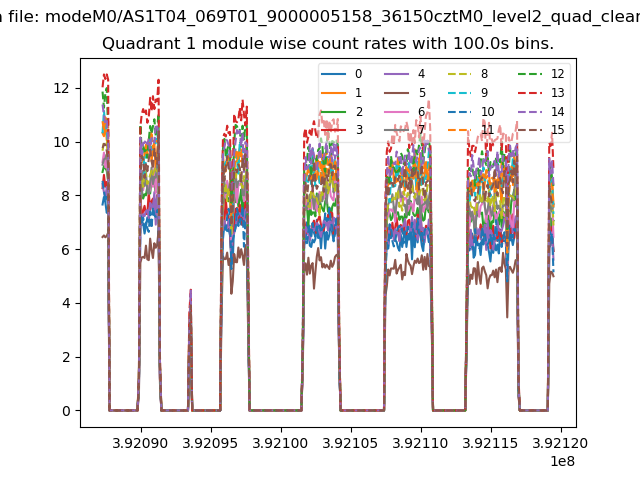
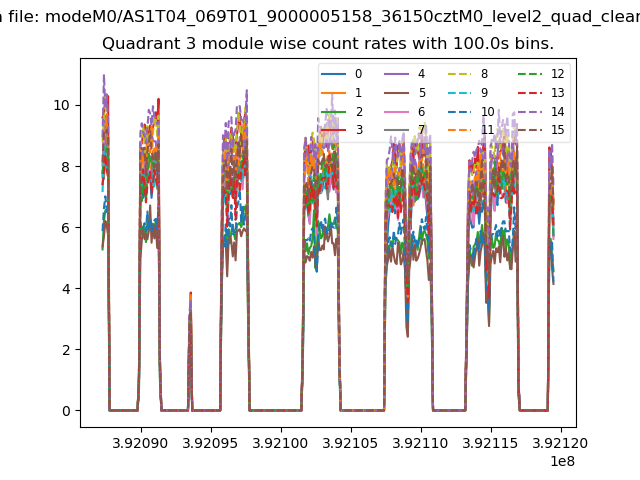
| Module-wise count rates for Quadrant A Data is divided into 100 sec bins |
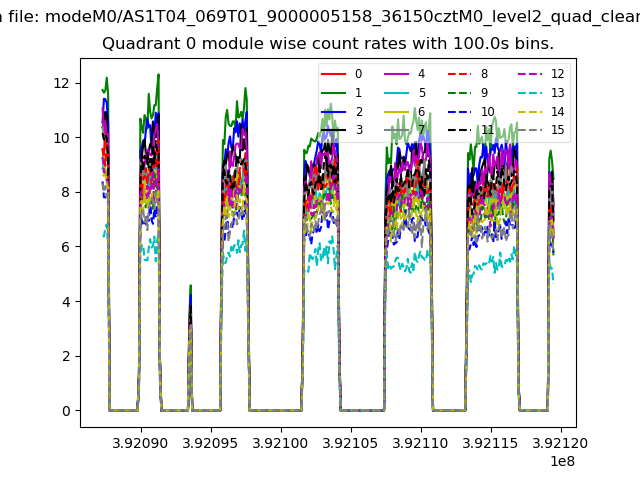 |
 |
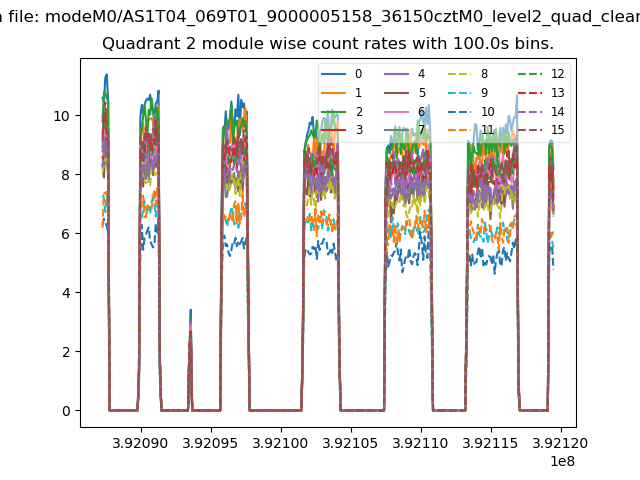
| Module-wise count rates for Quadrant B Data is divided into 100 sec bins |
 |
 |
| Module-wise count rates for Quadrant C Data is divided into 100 sec bins |
 |
 |
| Module-wise count rates for Quadrant D Data is divided into 100 sec bins |
 |
 |
| Parameter | Plot |
|---|---|
| CZT HV Monitor |  |
| D_VDD | 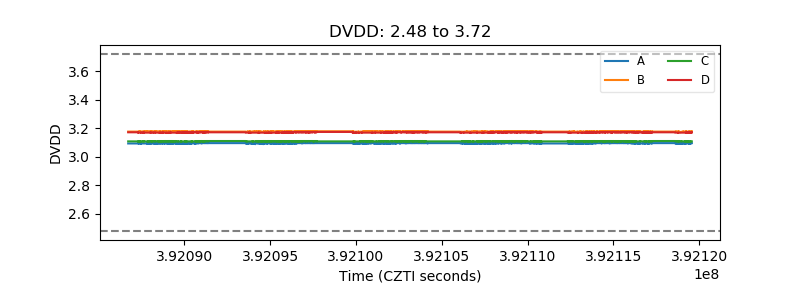 |
| Temperature 1 | 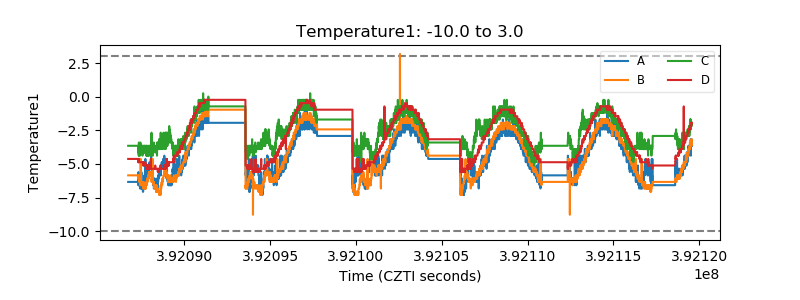 |
| Veto HV Monitor | 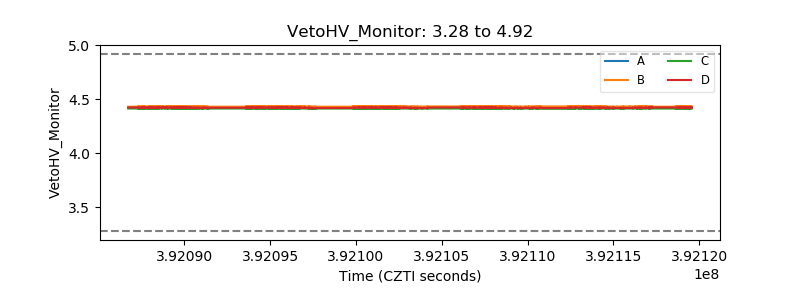 |
| Veto LLD | 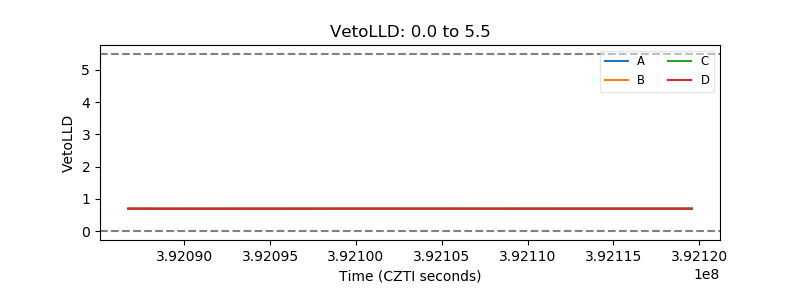 |
| Alpha Counter | 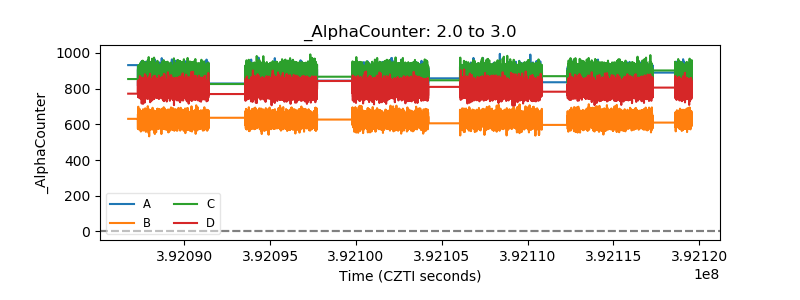 |
| _CPM_Rate | 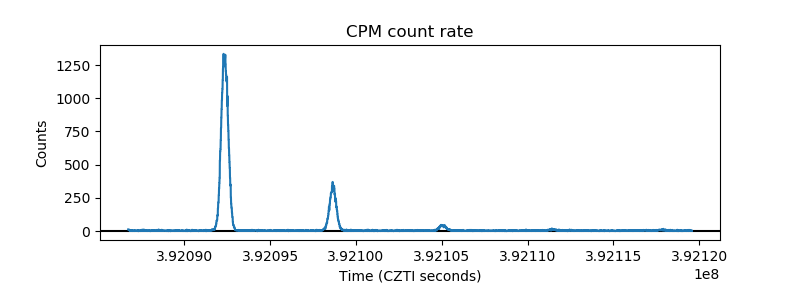 |
| CZT Counter | 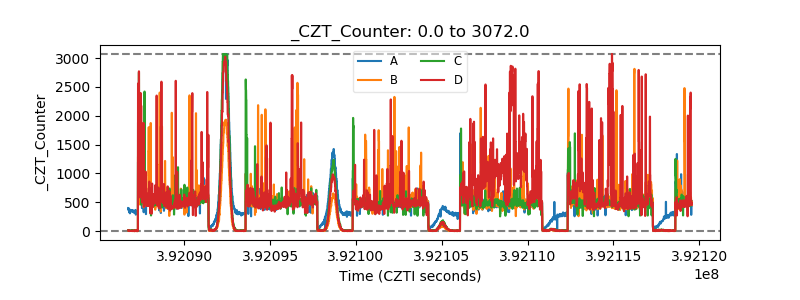 |
| +2.5 Volts monitor | 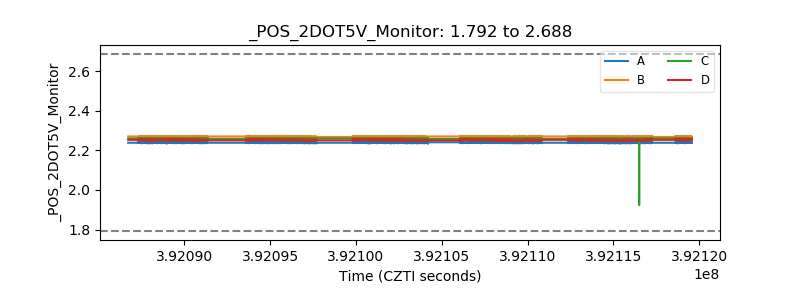 |
| +5 Volts monitor | 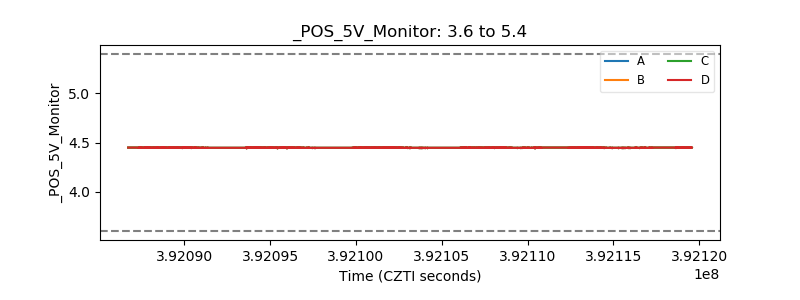 |
| _ROLL_ROT | 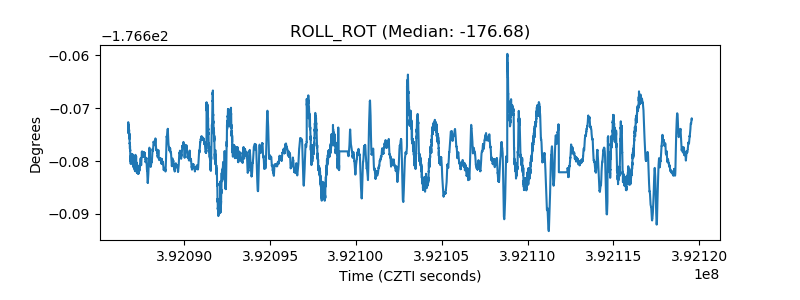 |
| _Roll_DEC | 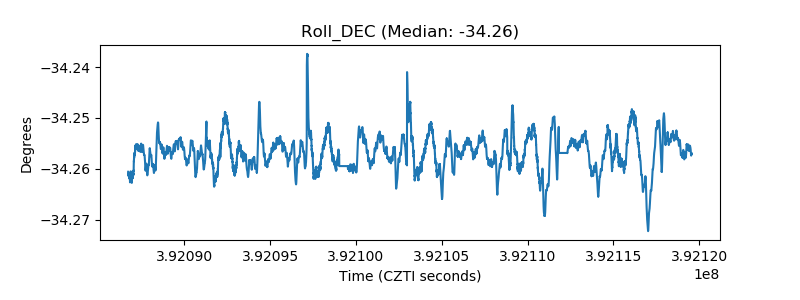 |
| _Roll_RA | 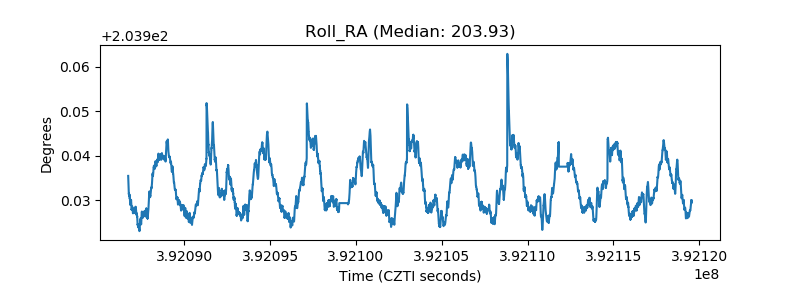 |
| Veto Counter | 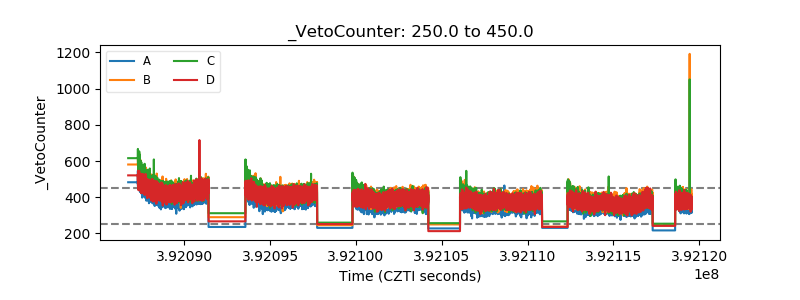 |