| Param | Original file | Final file |
|---|---|---|
| Filename | modeM0/AS1T04_069T01_9000005158_36149cztM0_level2.evt | modeM0/AS1T04_069T01_9000005158_36149cztM0_level2_quad_clean.evt |
| Size (bytes) | 474,840,000 | 66,553,920 |
| Size | 452.8 MB | 63.5 MB |
| Events in quadrant A | 2,671,267 | 421,120 |
| Events in quadrant B | 2,998,715 | 423,265 |
| Events in quadrant C | 2,838,648 | 412,725 |
| Events in quadrant D | 5,497,188 | 371,395 |
Noise dominated data is calculated using 1-second bins in cleaned event files. If a bin has >2000 counts, and if more than 50% of those come from <1% of pixels, then it is considered to be noise-dominated and hence unusable.
| Quadrant | # 1 sec bins | Bins with >0 counts | Bins with >2000 counts | High rate bins dominated by noise | Noise dominated (total time) | Noise dominated (detector-on time) | Marked lightcurve |
|---|---|---|---|---|---|---|---|
| A | 7018 | 5526 | 0 | 0 | 0.00% | 0.00% | 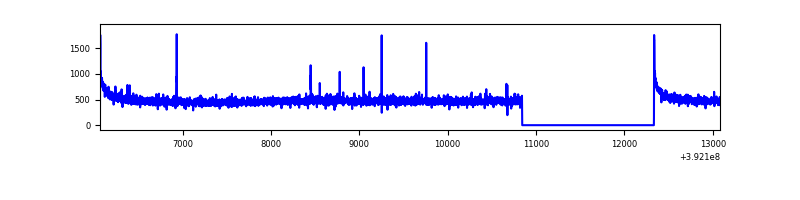 |
| B | 7018 | 5526 | 45 | 45 | 0.64% | 0.81% | 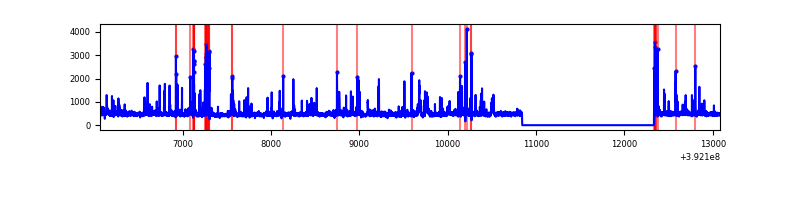 |
| C | 7018 | 5526 | 12 | 12 | 0.17% | 0.22% | 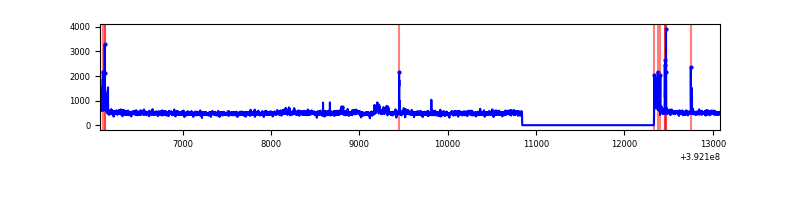 |
| D | 7018 | 5526 | 382 | 382 | 5.44% | 6.91% | 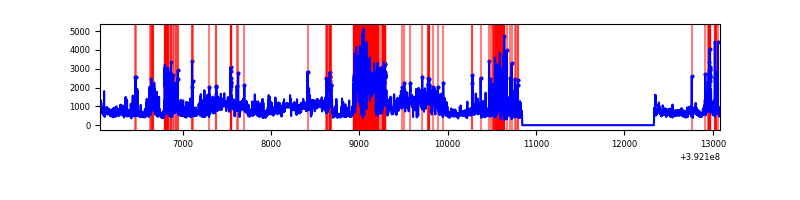 |
Top three noisy pixels from each quadrant. If the there are fewer than three noisy pixels in the level2.evt file, extra rows are filled as -1
| Pixel properties | Quadrant properties | ||||||
|---|---|---|---|---|---|---|---|
| Quadrant | DetID | PixID | Counts | Sigma | Mean | Median | Sigma |
| A | 10 | 83 | 177140 | 1367.74 | 637 | 624 | 129.1 |
| A | 9 | 143 | 11091 | 81.1 | 637 | 624 | 129.1 |
| A | 13 | 6 | 9182 | 66.31 | 637 | 624 | 129.1 |
| B | 5 | 172 | 396025 | 3200.4 | 630 | 613 | 123.6 |
| B | 4 | 171 | 61058 | 489.23 | 630 | 613 | 123.6 |
| B | 0 | 213 | 26192 | 207.03 | 630 | 613 | 123.6 |
| C | 15 | 214 | 238587 | 1629.26 | 614 | 618 | 146.1 |
| C | 0 | 10 | 109507 | 745.51 | 614 | 618 | 146.1 |
| C | 1 | 208 | 80291 | 545.48 | 614 | 618 | 146.1 |
| D | 1 | 52 | 2042242 | 13803.83 | 597 | 580 | 147.9 |
| D | 13 | 249 | 739110 | 4993.26 | 597 | 580 | 147.9 |
| D | 10 | 253 | 84020 | 564.14 | 597 | 580 | 147.9 |
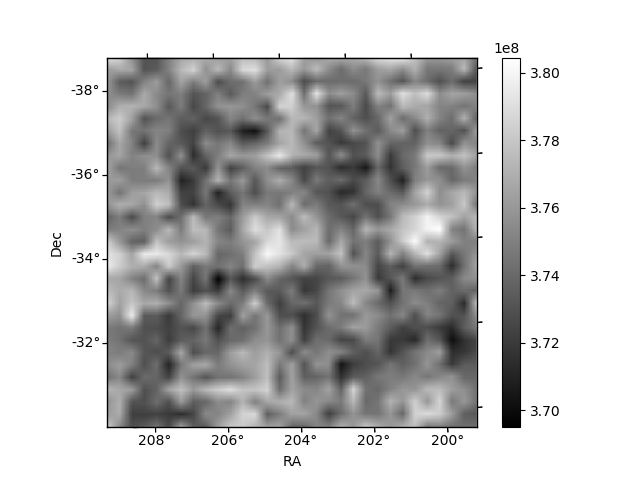
Histogram calculated using DETX and DETY for each event in the final _common_clean file
| Quadrant A | 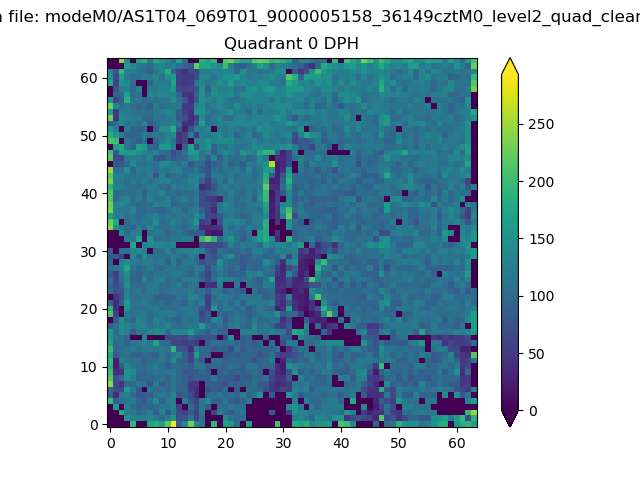 |
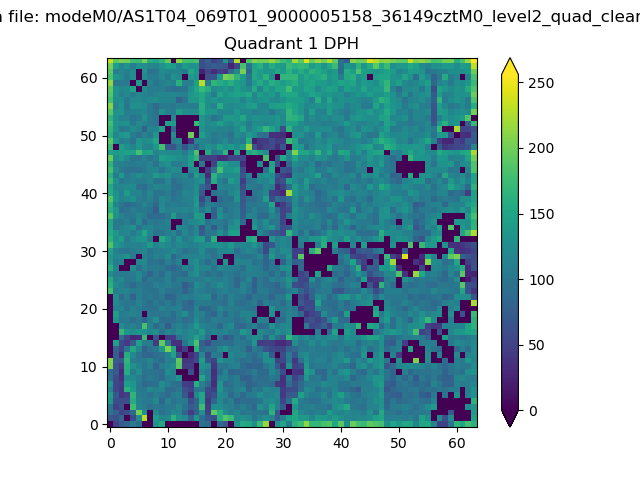 |
Quadrant B |
|---|---|---|---|
| Quadrant D | 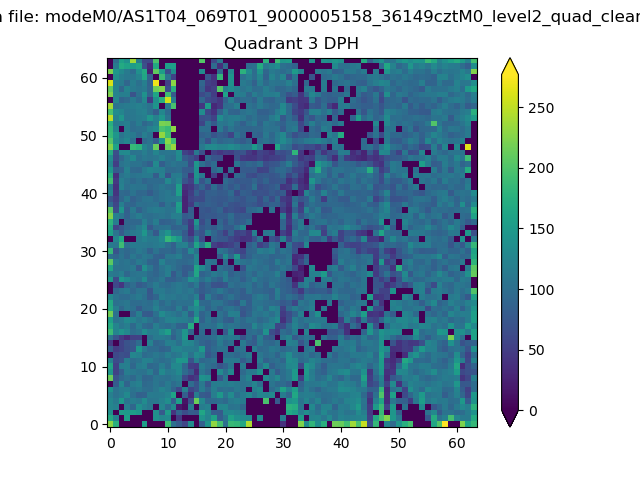 |
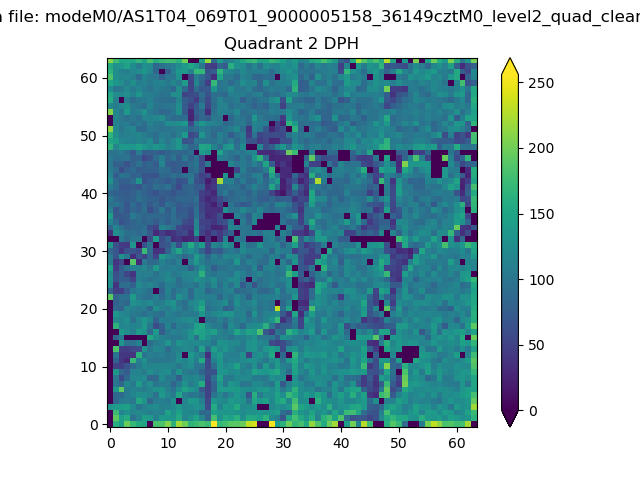 |
Quadrant C |
| Plot type | Count rate plots | Images |
|---|---|---|
| Comparison with Poisson distribution Blue bars denote a histogram of data divided into 1 sec bins. Red curve is a Poisson curve with rate = median count rate of data. |
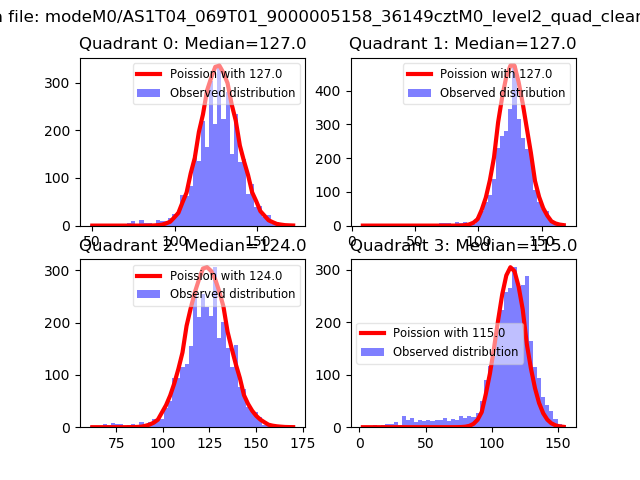 |
 |
| Quadrant-wise count rates Data is divided into 100 sec bins |
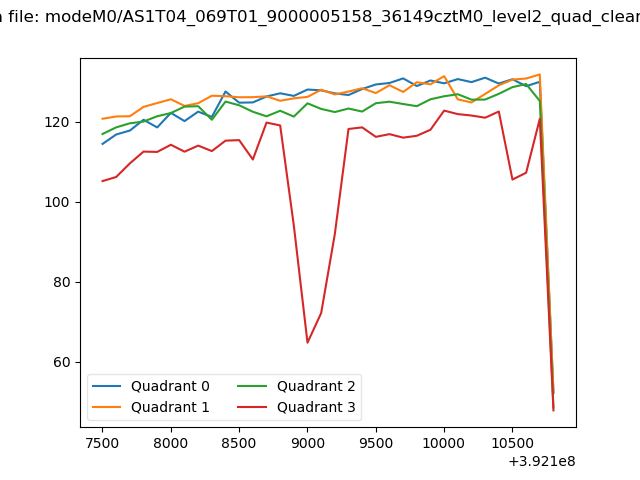 |
|
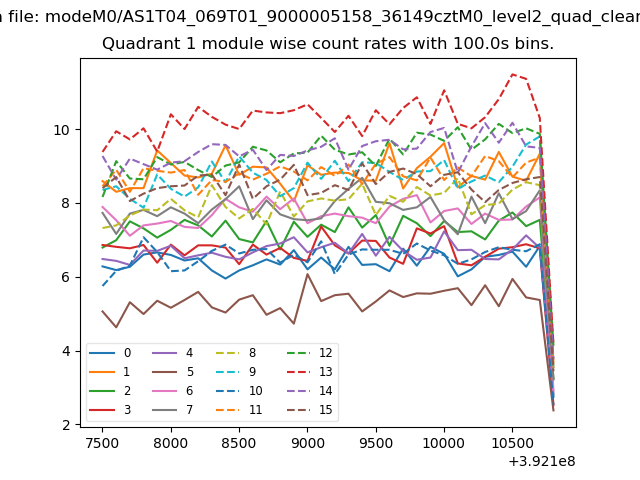
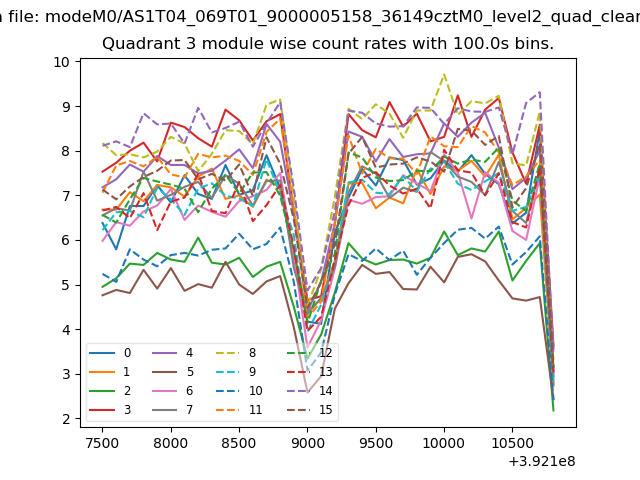
| Module-wise count rates for Quadrant A Data is divided into 100 sec bins |
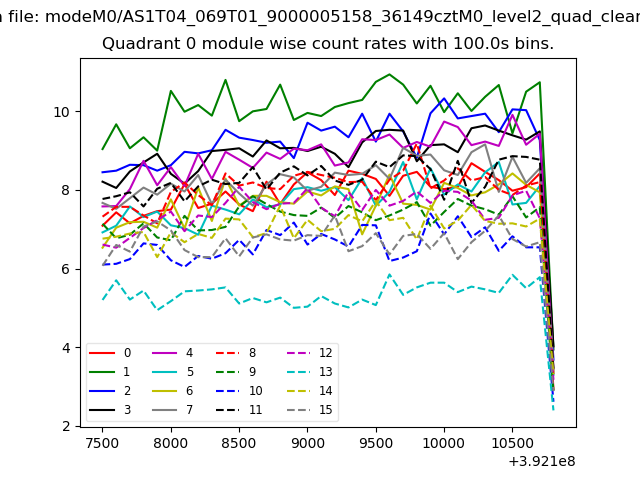 |
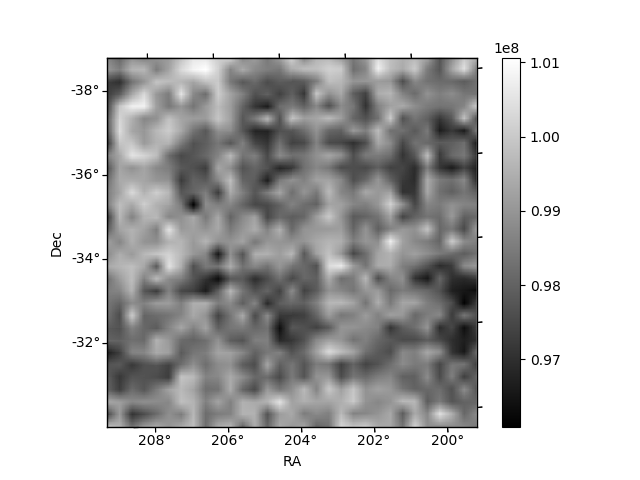 |
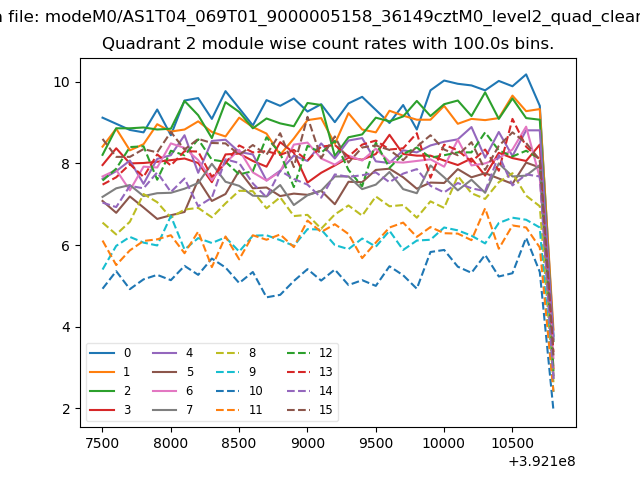
| Module-wise count rates for Quadrant B Data is divided into 100 sec bins |
 |
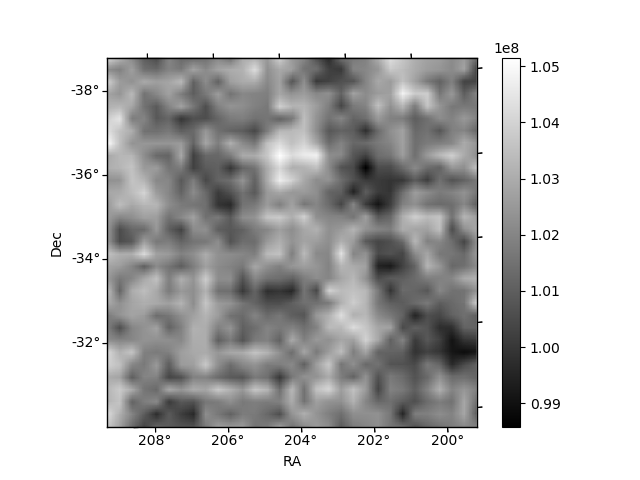 |
| Module-wise count rates for Quadrant C Data is divided into 100 sec bins |
 |
 |
| Module-wise count rates for Quadrant D Data is divided into 100 sec bins |
 |
 |
| Parameter | Plot |
|---|---|
| CZT HV Monitor | 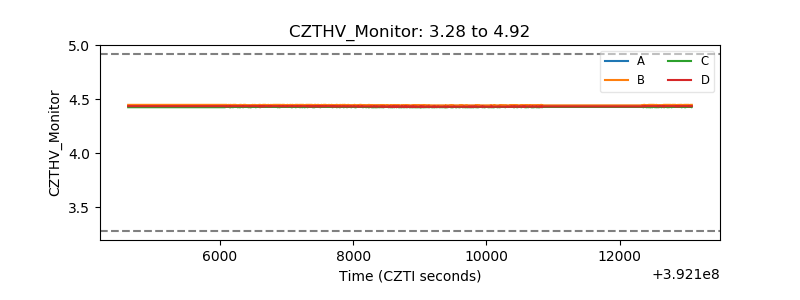 |
| D_VDD | 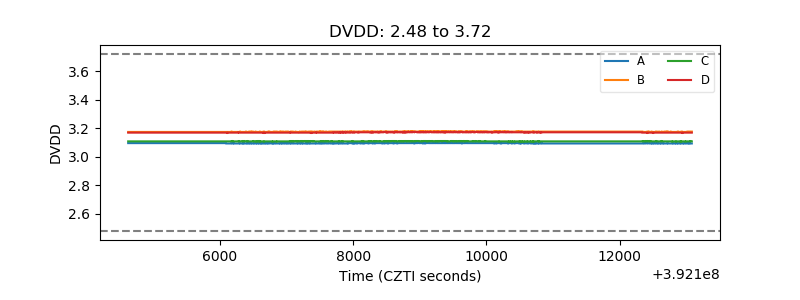 |
| Temperature 1 | 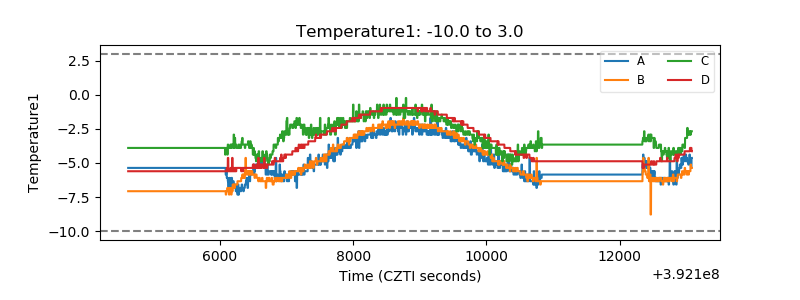 |
| Veto HV Monitor | 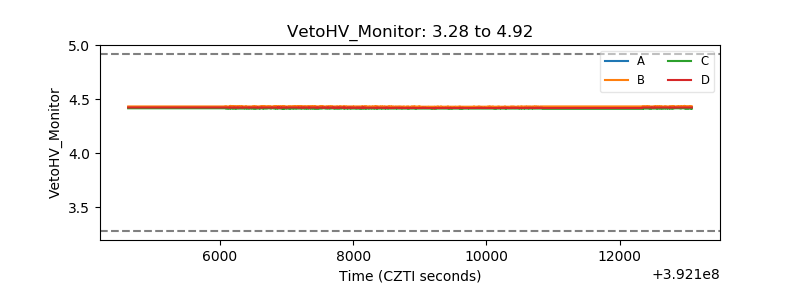 |
| Veto LLD | 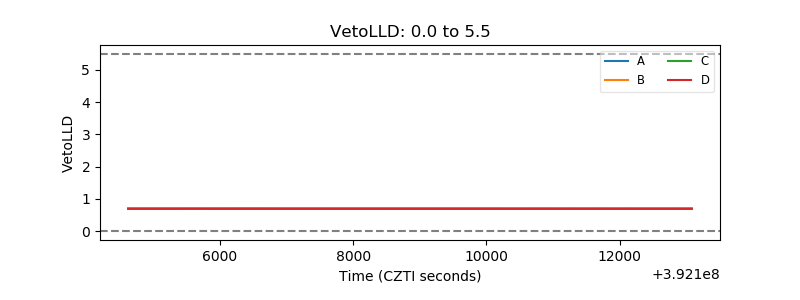 |
| Alpha Counter | 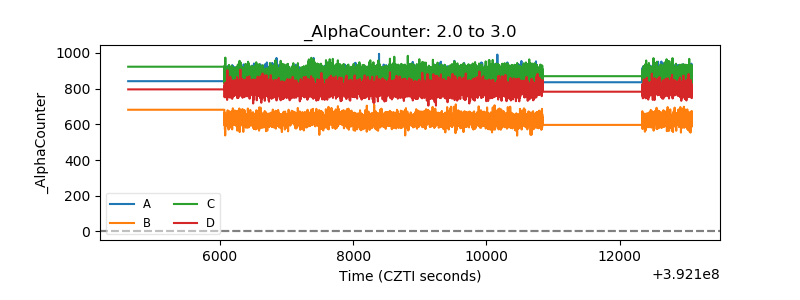 |
| _CPM_Rate | 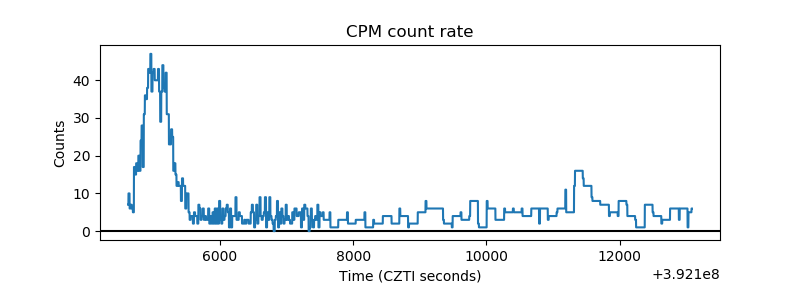 |
| CZT Counter | 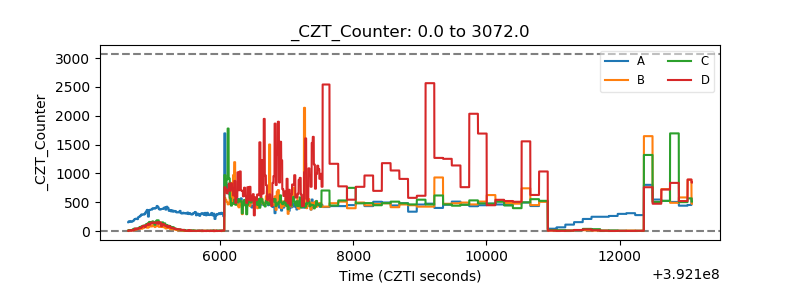 |
| +2.5 Volts monitor | 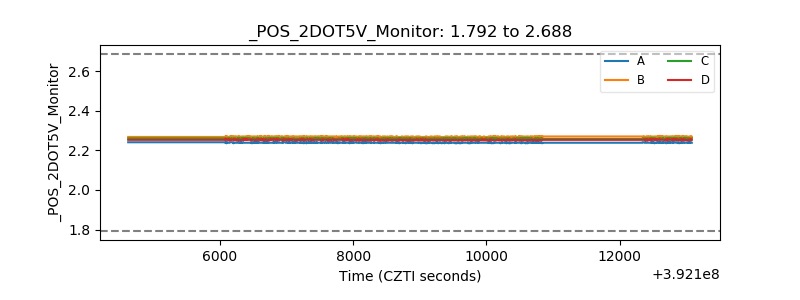 |
| +5 Volts monitor | 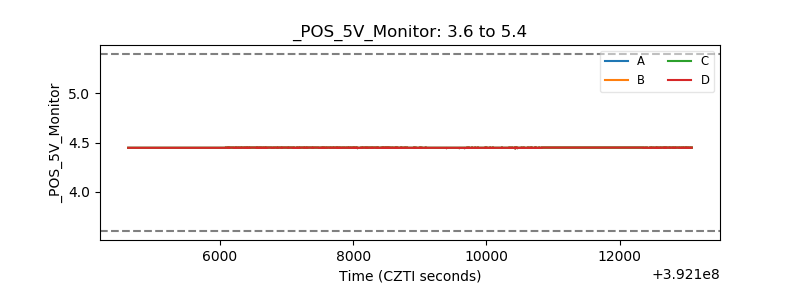 |
| _ROLL_ROT | 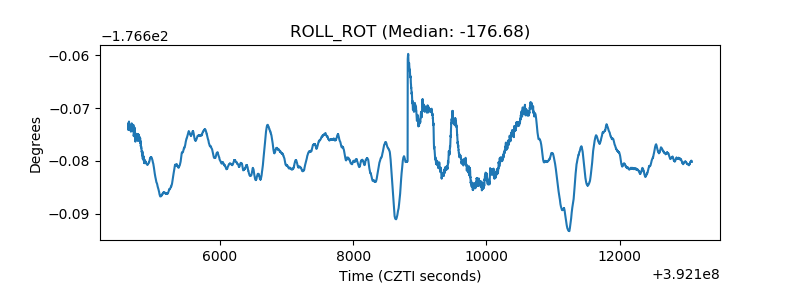 |
| _Roll_DEC | 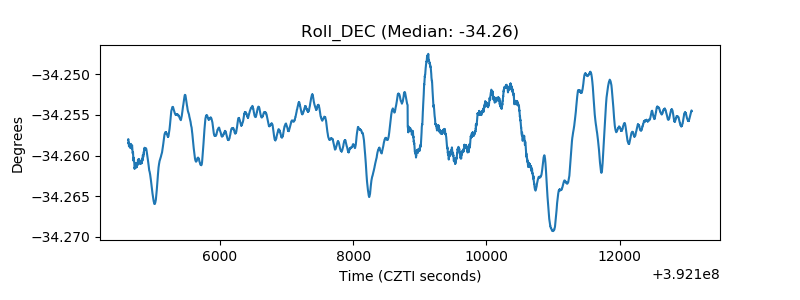 |
| _Roll_RA | 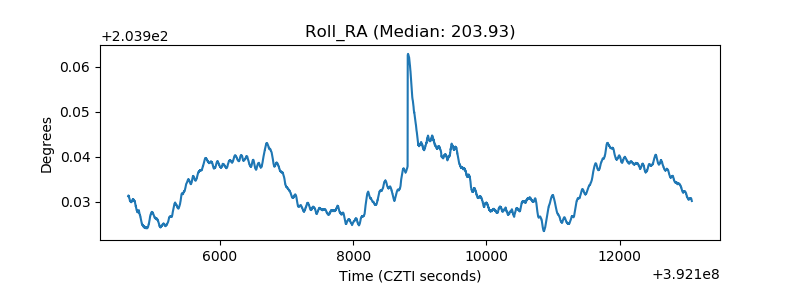 |
| Veto Counter | 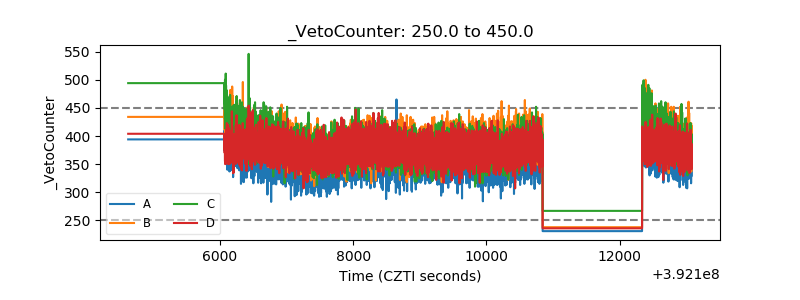 |