| Param | Original file | Final file |
|---|---|---|
| Filename | modeM0/AS1T04_069T01_9000005158_36147cztM0_level2.evt | modeM0/AS1T04_069T01_9000005158_36147cztM0_level2_quad_clean.evt |
| Size (bytes) | 392,627,520 | 46,215,360 |
| Size | 374.4 MB | 44.1 MB |
| Events in quadrant A | 2,611,113 | 264,047 |
| Events in quadrant B | 3,021,994 | 264,267 |
| Events in quadrant C | 2,883,850 | 259,905 |
| Events in quadrant D | 3,018,345 | 244,645 |
Noise dominated data is calculated using 1-second bins in cleaned event files. If a bin has >2000 counts, and if more than 50% of those come from <1% of pixels, then it is considered to be noise-dominated and hence unusable.
| Quadrant | # 1 sec bins | Bins with >0 counts | Bins with >2000 counts | High rate bins dominated by noise | Noise dominated (total time) | Noise dominated (detector-on time) | Marked lightcurve |
|---|---|---|---|---|---|---|---|
| A | 7281 | 5219 | 4 | 4 | 0.05% | 0.08% |  |
| B | 7281 | 5219 | 79 | 79 | 1.09% | 1.51% | 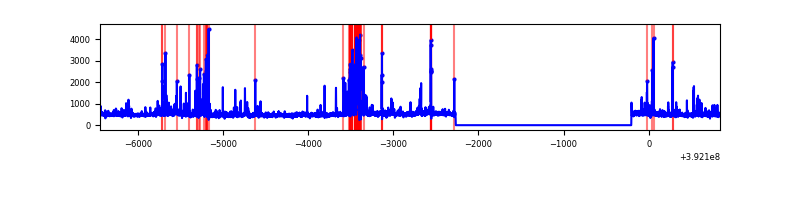 |
| C | 7281 | 5219 | 72 | 72 | 0.99% | 1.38% | 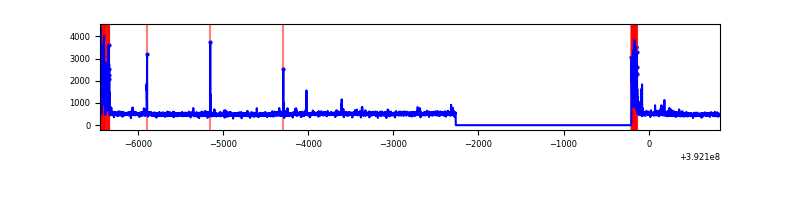 |
| D | 7281 | 5219 | 83 | 83 | 1.14% | 1.59% | 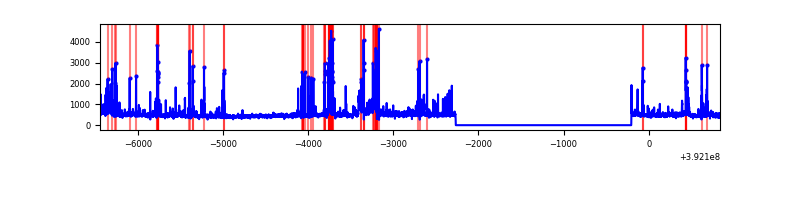 |
Top three noisy pixels from each quadrant. If the there are fewer than three noisy pixels in the level2.evt file, extra rows are filled as -1
| Pixel properties | Quadrant properties | ||||||
|---|---|---|---|---|---|---|---|
| Quadrant | DetID | PixID | Counts | Sigma | Mean | Median | Sigma |
| A | 10 | 83 | 170466 | 1344.71 | 620 | 607 | 126.3 |
| A | 8 | 144 | 17589 | 134.44 | 620 | 607 | 126.3 |
| A | 9 | 143 | 15043 | 114.28 | 620 | 607 | 126.3 |
| B | 5 | 172 | 481057 | 4109.63 | 612 | 596 | 116.9 |
| B | 0 | 190 | 84284 | 715.83 | 612 | 596 | 116.9 |
| B | 0 | 213 | 18436 | 152.59 | 612 | 596 | 116.9 |
| C | 0 | 10 | 276578 | 1955.34 | 601 | 604 | 141.1 |
| C | 15 | 214 | 223196 | 1577.12 | 601 | 604 | 141.1 |
| C | 0 | 207 | 19121 | 131.2 | 601 | 604 | 141.1 |
| D | 13 | 249 | 269750 | 1852.32 | 593 | 574 | 145.3 |
| D | 1 | 52 | 219253 | 1504.83 | 593 | 574 | 145.3 |
| D | 12 | 6 | 94770 | 648.2 | 593 | 574 | 145.3 |
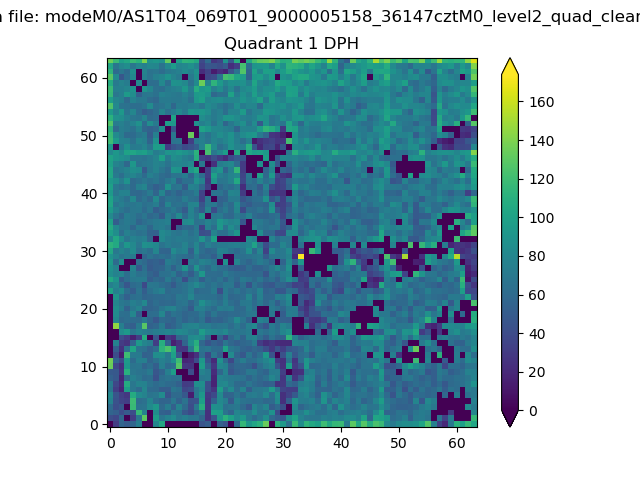
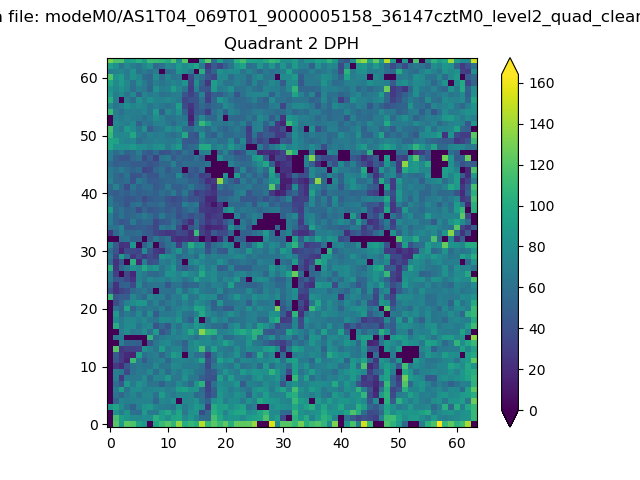
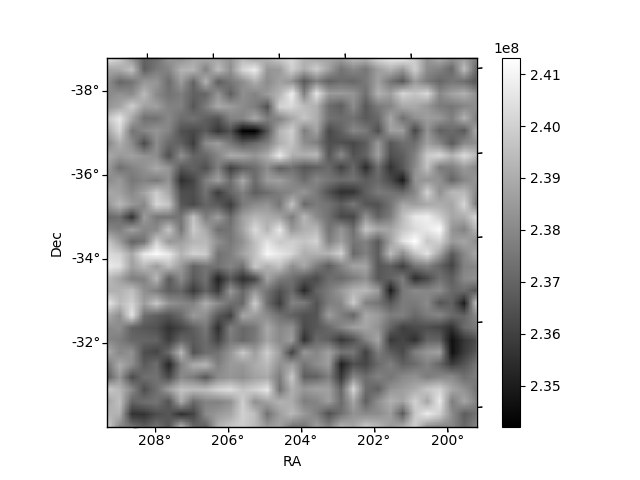
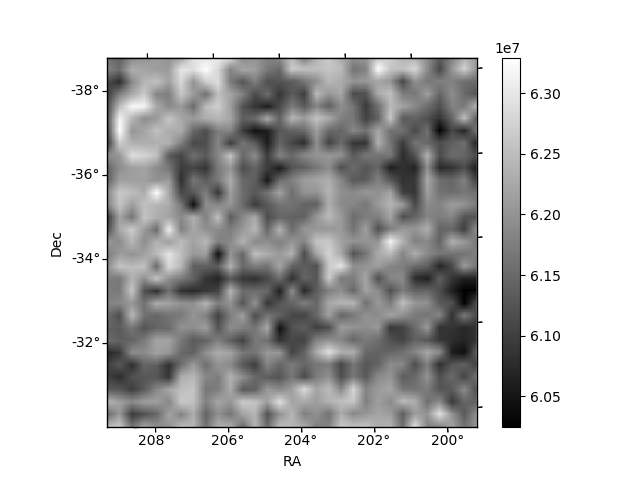
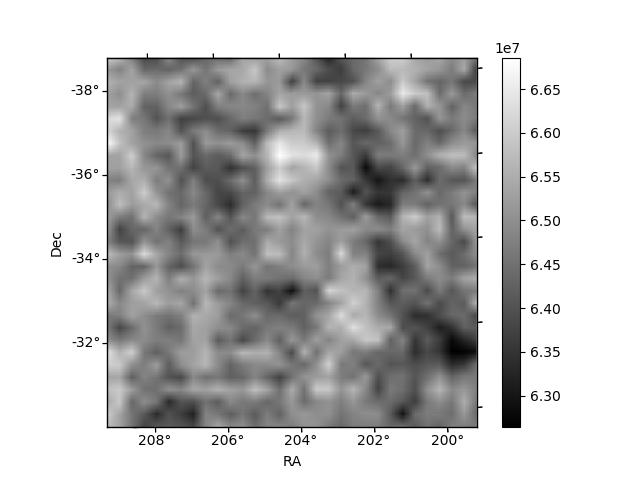
Histogram calculated using DETX and DETY for each event in the final _common_clean file
| Quadrant A | 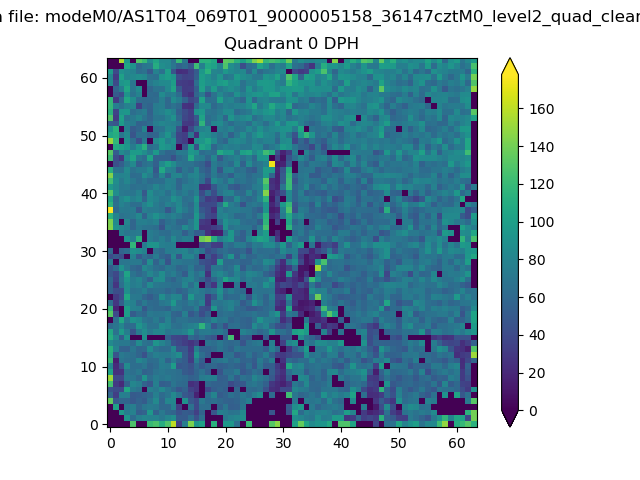 |
 |
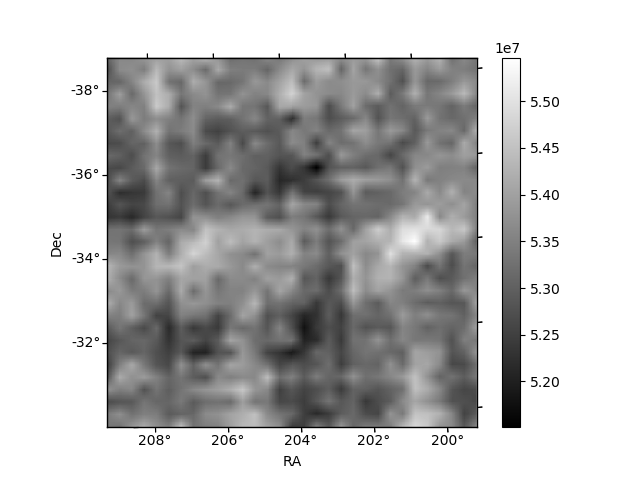
Quadrant B |
|---|---|---|---|
| Quadrant D | 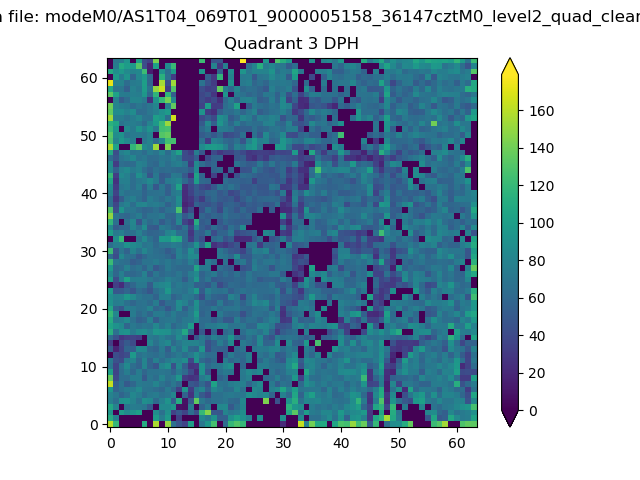 |
 |
Quadrant C |
| Plot type | Count rate plots | Images |
|---|---|---|
| Comparison with Poisson distribution Blue bars denote a histogram of data divided into 1 sec bins. Red curve is a Poisson curve with rate = median count rate of data. |
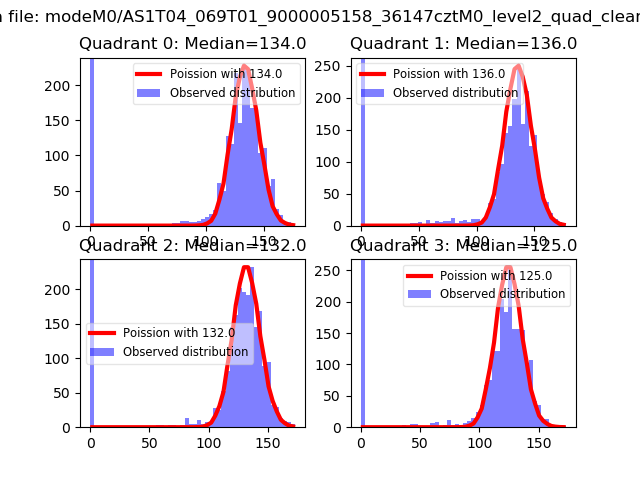 |
 |
| Quadrant-wise count rates Data is divided into 100 sec bins |
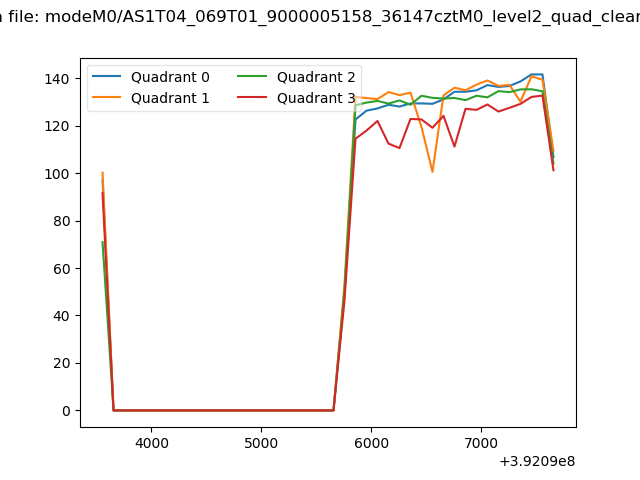 |
|
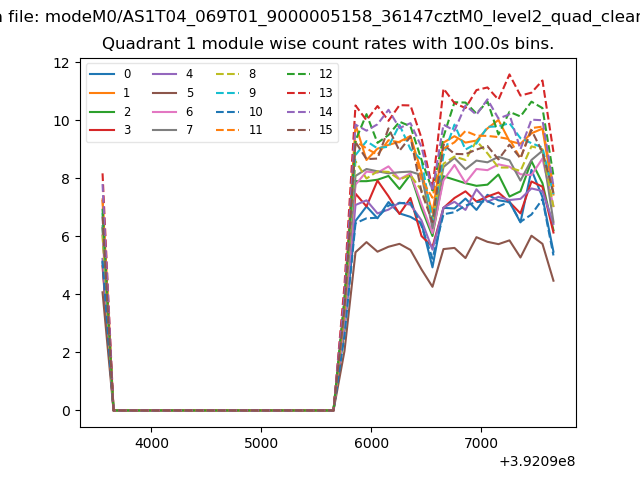
| Module-wise count rates for Quadrant A Data is divided into 100 sec bins |
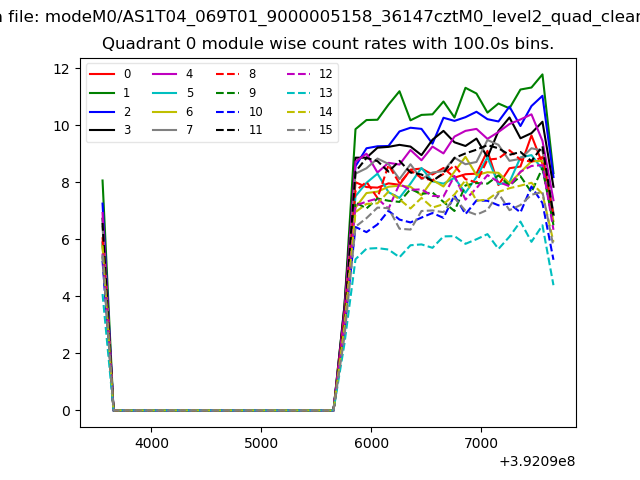 |
 |
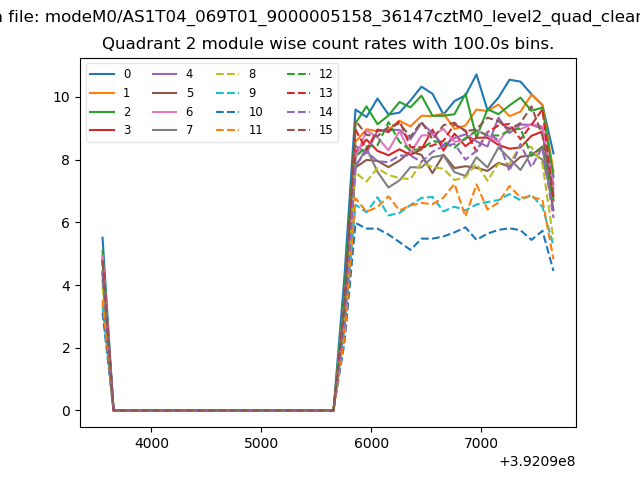
| Module-wise count rates for Quadrant B Data is divided into 100 sec bins |
 |
 |
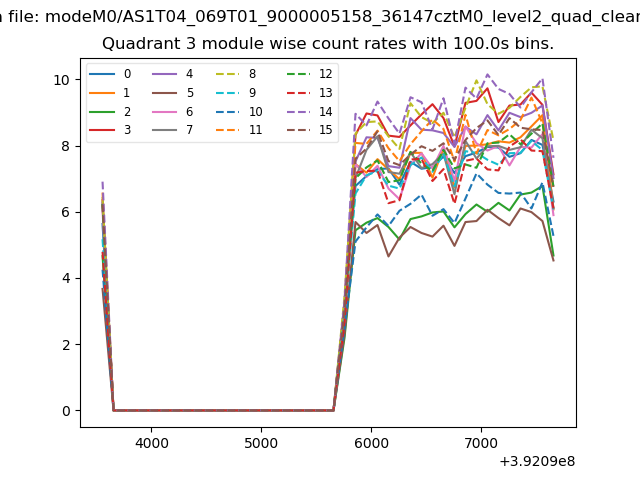
| Module-wise count rates for Quadrant C Data is divided into 100 sec bins |
 |
 |
| Module-wise count rates for Quadrant D Data is divided into 100 sec bins |
 |
 |
| Parameter | Plot |
|---|---|
| CZT HV Monitor | 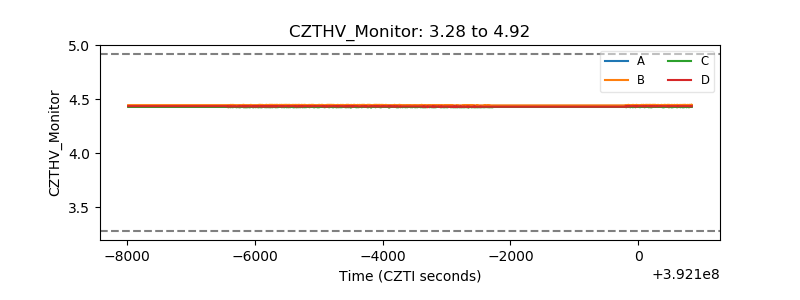 |
| D_VDD |  |
| Temperature 1 | 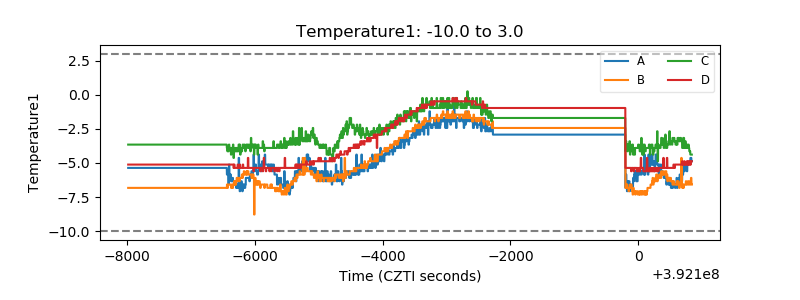 |
| Veto HV Monitor |  |
| Veto LLD | 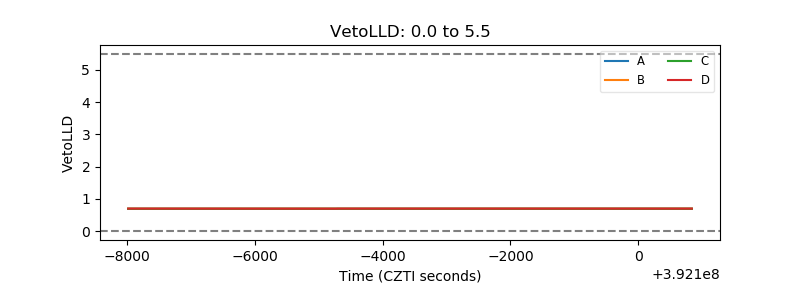 |
| Alpha Counter | 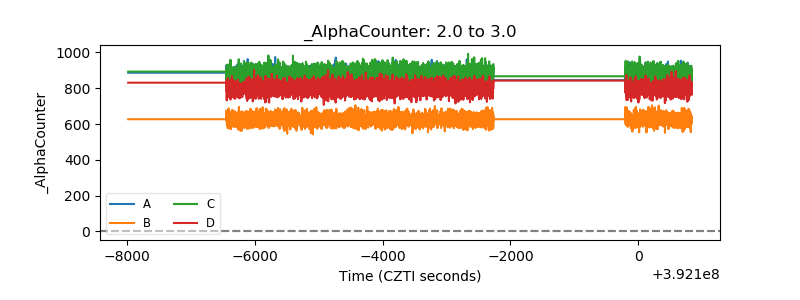 |
| _CPM_Rate | 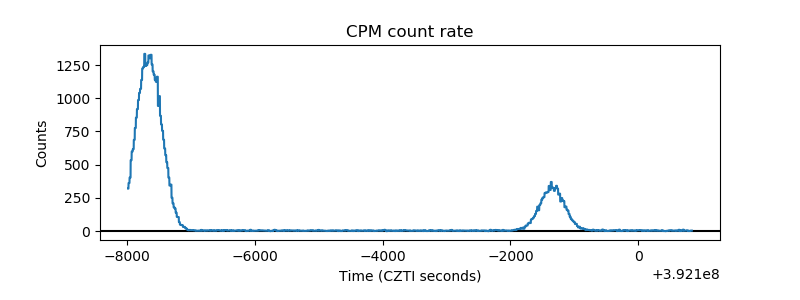 |
| CZT Counter | 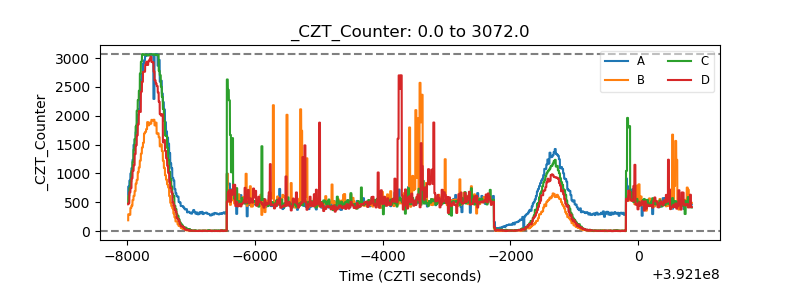 |
| +2.5 Volts monitor | 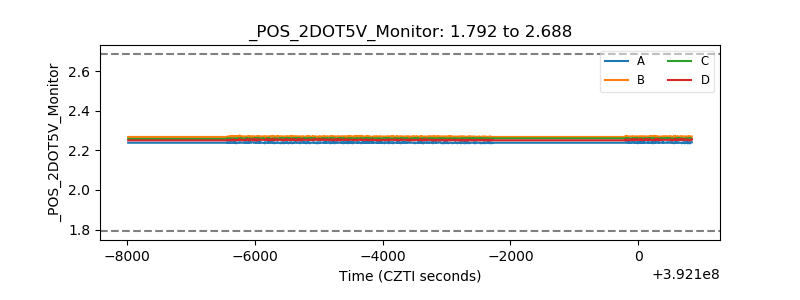 |
| +5 Volts monitor | 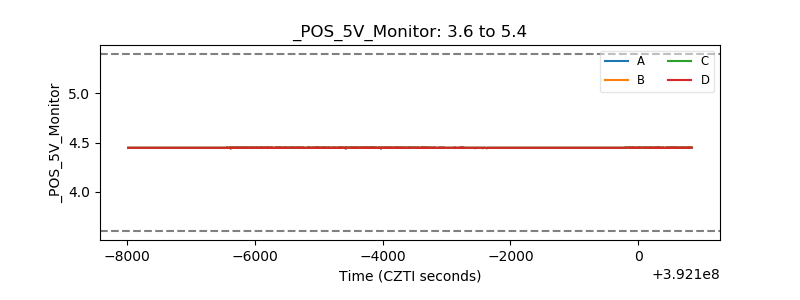 |
| _ROLL_ROT | 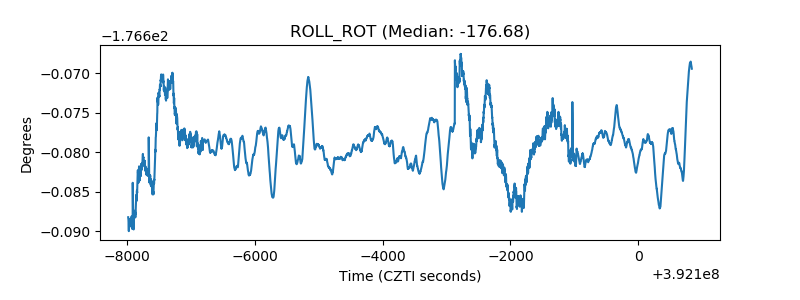 |
| _Roll_DEC | 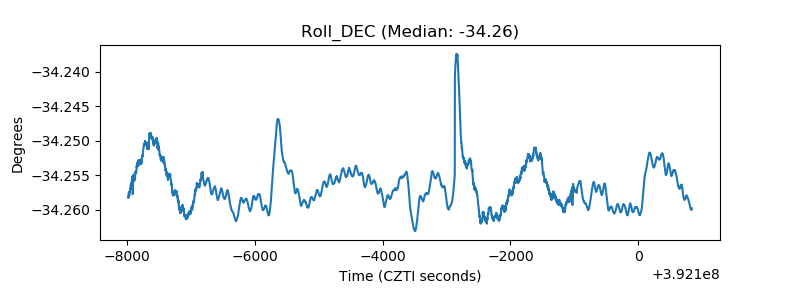 |
| _Roll_RA | 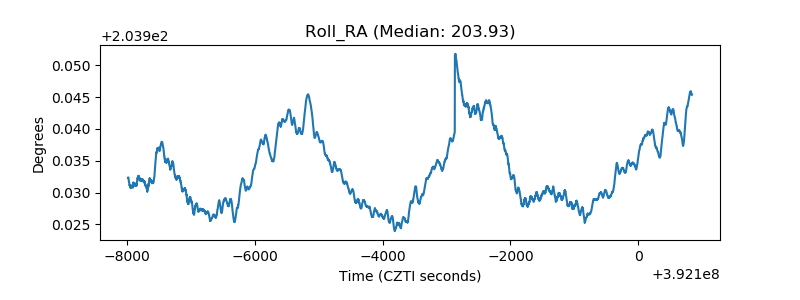 |
| Veto Counter | 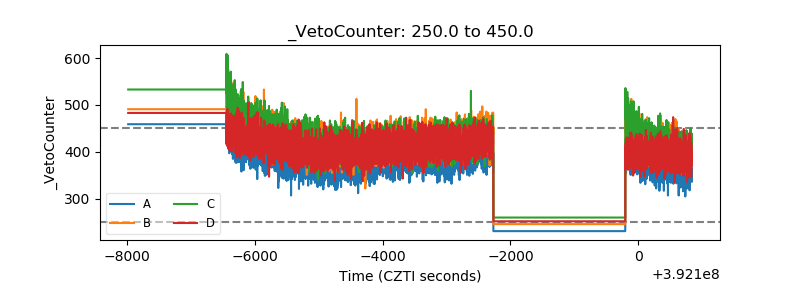 |