| Param | Original file | Final file |
|---|---|---|
| Filename | modeM0/AS1T04_069T01_9000005158_36145cztM0_level2.evt | modeM0/AS1T04_069T01_9000005158_36145cztM0_level2_quad_clean.evt |
| Size (bytes) | 394,767,360 | 56,986,560 |
| Size | 376.5 MB | 54.3 MB |
| Events in quadrant A | 2,518,516 | 355,363 |
| Events in quadrant B | 2,842,771 | 361,399 |
| Events in quadrant C | 2,968,488 | 345,947 |
| Events in quadrant D | 3,295,230 | 321,279 |
| Mode M0 | |||
|---|---|---|---|
| Quadrant | BADHDUFLAG | Total packets | Discarded packets |
| A | 0 | 10352 | 3 |
| B | 0 | 11378 | 2 |
| C | 0 | 11564 | 2 |
| D | 0 | 13020 | 2 |
| Mode M9 | |||
|---|---|---|---|
| Quadrant | BADHDUFLAG | Total packets | Discarded packets |
| A | 0 | 40 | 0 |
| B | 0 | 40 | 0 |
| C | 0 | 40 | 0 |
| D | 0 | 40 | 0 |
| Mode SS | |||
|---|---|---|---|
| Quadrant | BADHDUFLAG | Total packets | Discarded packets |
| A | 0 | 100 | 0 |
| B | 0 | 100 | 0 |
| C | 0 | 100 | 0 |
| D | 0 | 100 | 0 |
| Quadrant | Total seconds | Saturated seconds | Saturation percentage |
|---|---|---|---|
| A | 4860 | 15 | 0.308642% |
| B | 4860 | 76 | 1.563786% |
| C | 4860 | 137 | 2.818930% |
| D | 4860 | 204 | 4.197531% |
Noise dominated data is calculated using 1-second bins in cleaned event files. If a bin has >2000 counts, and if more than 50% of those come from <1% of pixels, then it is considered to be noise-dominated and hence unusable.
| Quadrant | # 1 sec bins | Bins with >0 counts | Bins with >2000 counts | High rate bins dominated by noise | Noise dominated (total time) | Noise dominated (detector-on time) | Marked lightcurve |
|---|---|---|---|---|---|---|---|
| A | 6983 | 4861 | 5 | 5 | 0.07% | 0.10% | 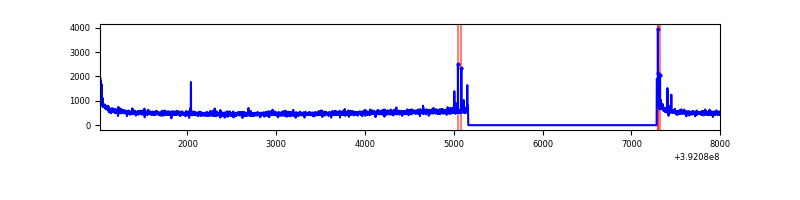 |
| B | 6983 | 4861 | 42 | 42 | 0.60% | 0.86% | 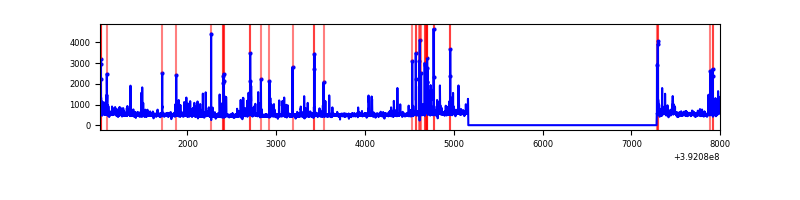 |
| C | 6983 | 4861 | 105 | 105 | 1.50% | 2.16% | 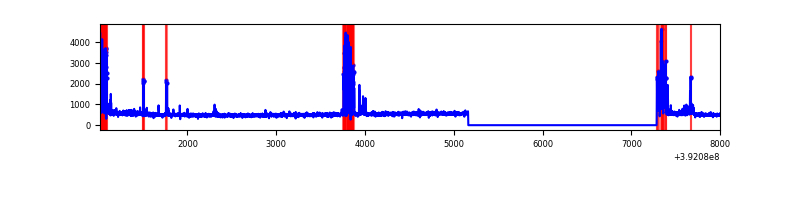 |
| D | 6983 | 4861 | 167 | 167 | 2.39% | 3.44% | 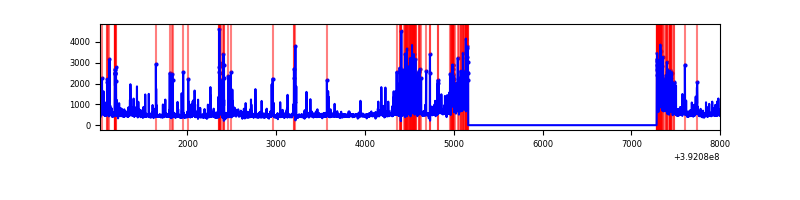 |
Top three noisy pixels from each quadrant. If the there are fewer than three noisy pixels in the level2.evt file, extra rows are filled as -1
| Pixel properties | Quadrant properties | ||||||
|---|---|---|---|---|---|---|---|
| Quadrant | DetID | PixID | Counts | Sigma | Mean | Median | Sigma |
| A | 10 | 83 | 162137 | 1353.93 | 596 | 587 | 119.3 |
| A | 9 | 143 | 29929 | 245.91 | 596 | 587 | 119.3 |
| A | 8 | 144 | 10822 | 85.78 | 596 | 587 | 119.3 |
| B | 5 | 172 | 334325 | 2952.65 | 595 | 581 | 113.0 |
| B | 4 | 171 | 44844 | 391.6 | 595 | 581 | 113.0 |
| B | 5 | 255 | 36415 | 317.02 | 595 | 581 | 113.0 |
| C | 1 | 23 | 270594 | 2029.86 | 574 | 580 | 133.0 |
| C | 0 | 10 | 224401 | 1682.6 | 574 | 580 | 133.0 |
| C | 15 | 214 | 206244 | 1546.1 | 574 | 580 | 133.0 |
| D | 1 | 52 | 495906 | 3592.34 | 564 | 549 | 137.9 |
| D | 13 | 249 | 213972 | 1547.75 | 564 | 549 | 137.9 |
| D | 12 | 17 | 158719 | 1147.05 | 564 | 549 | 137.9 |
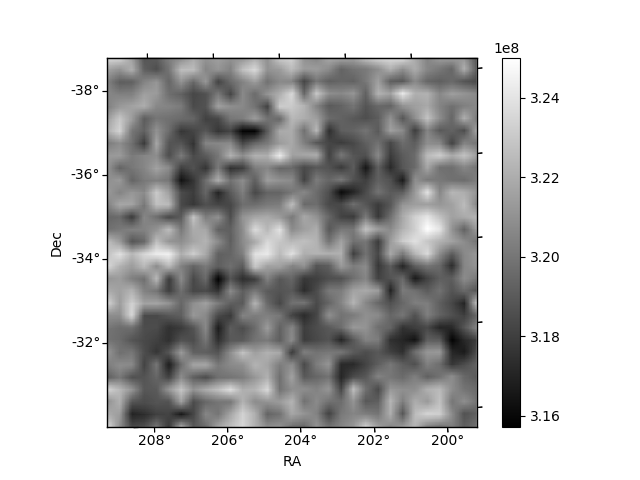
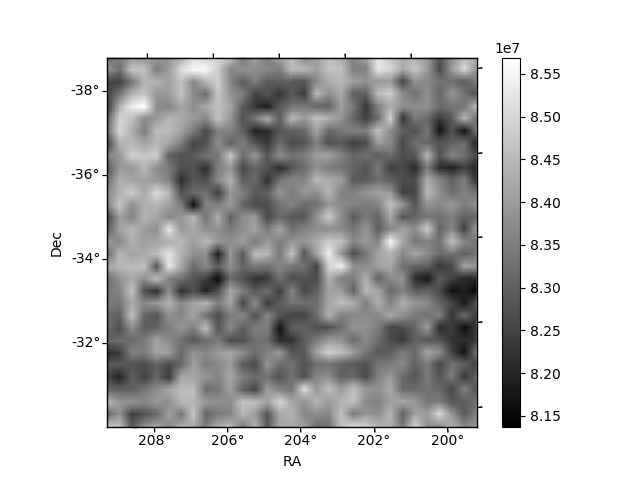
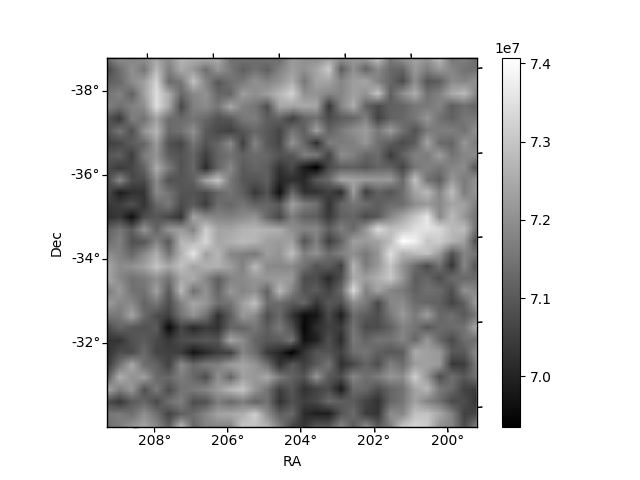
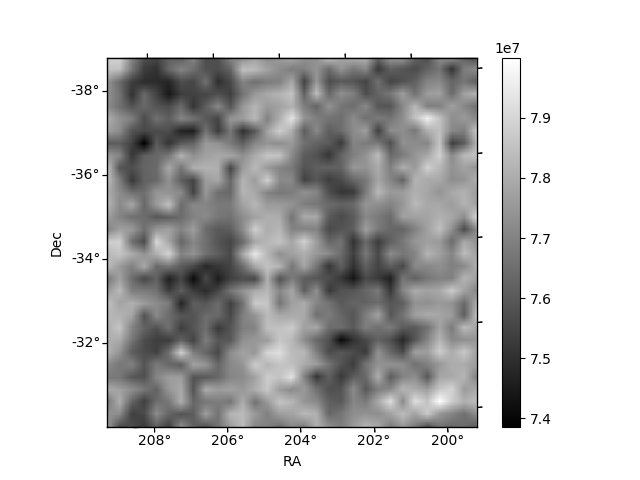
Histogram calculated using DETX and DETY for each event in the final _common_clean file
| Quadrant A | 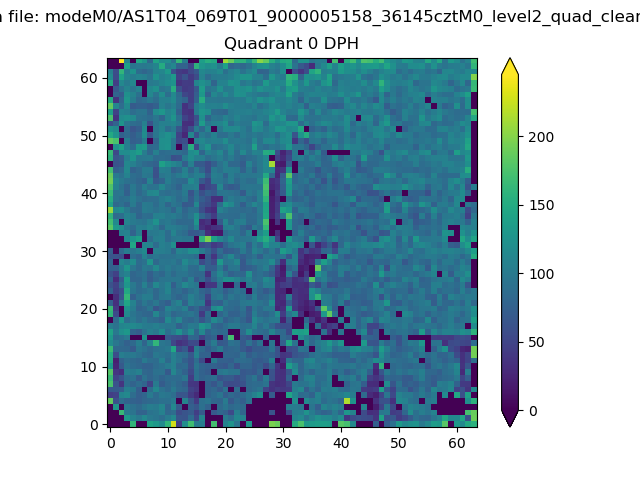 |
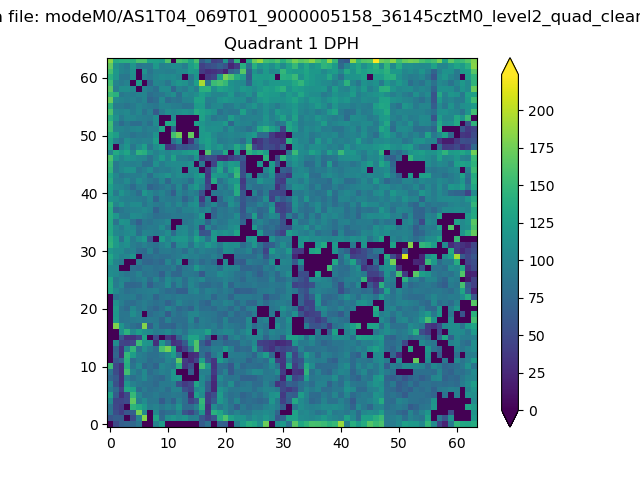 |
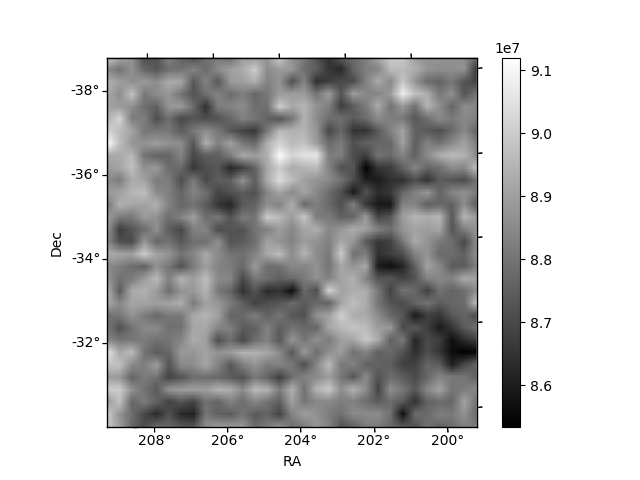
Quadrant B |
|---|---|---|---|
| Quadrant D | 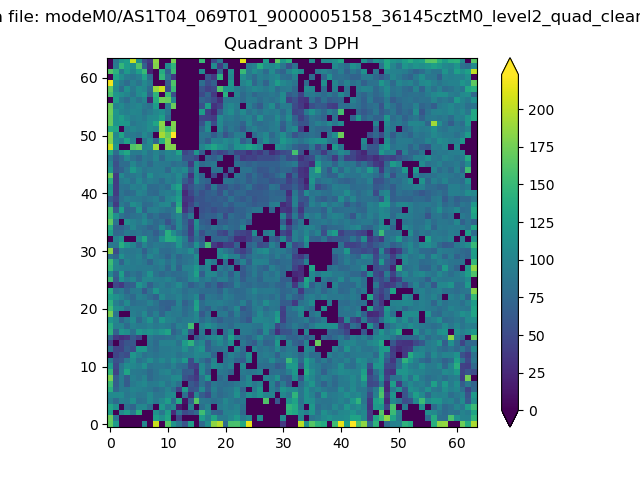 |
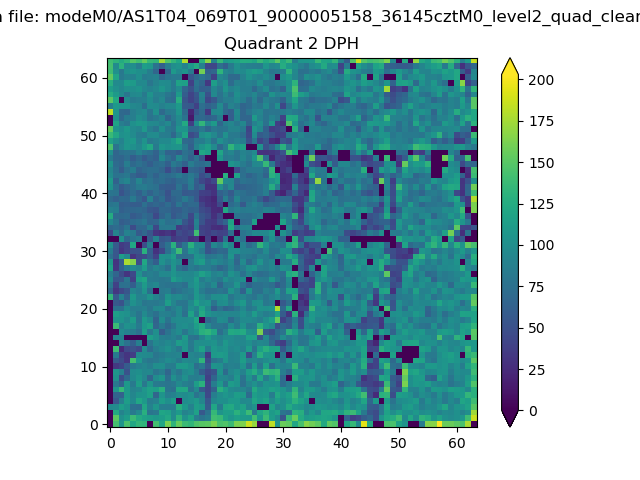 |
Quadrant C |
| Plot type | Count rate plots | Images |
|---|---|---|
| Comparison with Poisson distribution Blue bars denote a histogram of data divided into 1 sec bins. Red curve is a Poisson curve with rate = median count rate of data. |
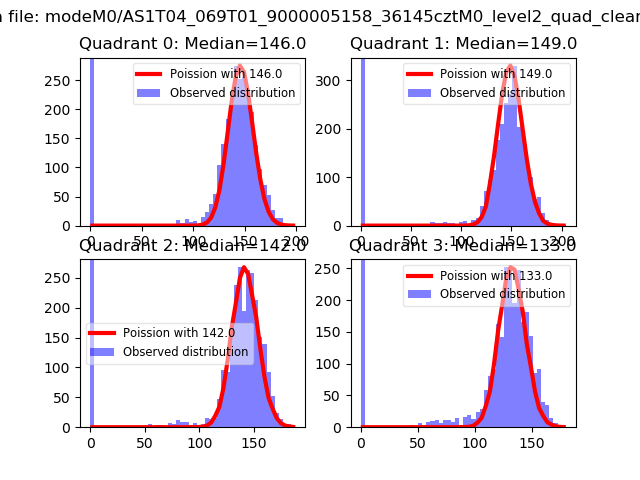 |
 |
| Quadrant-wise count rates Data is divided into 100 sec bins |
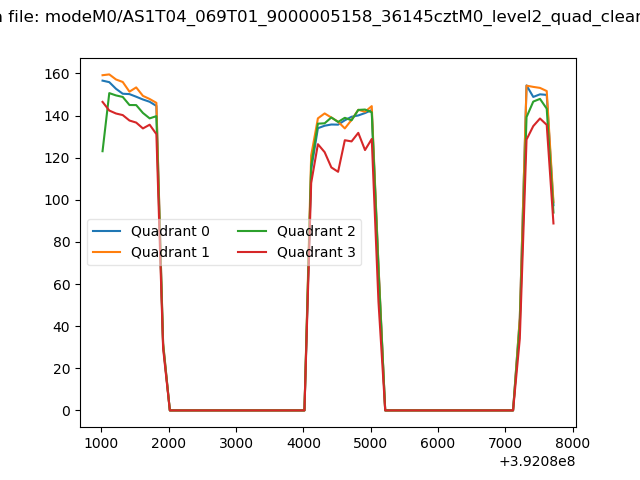 |
|
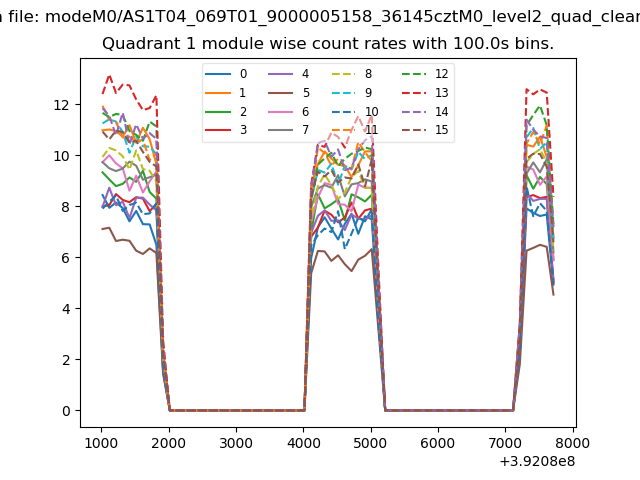
| Module-wise count rates for Quadrant A Data is divided into 100 sec bins |
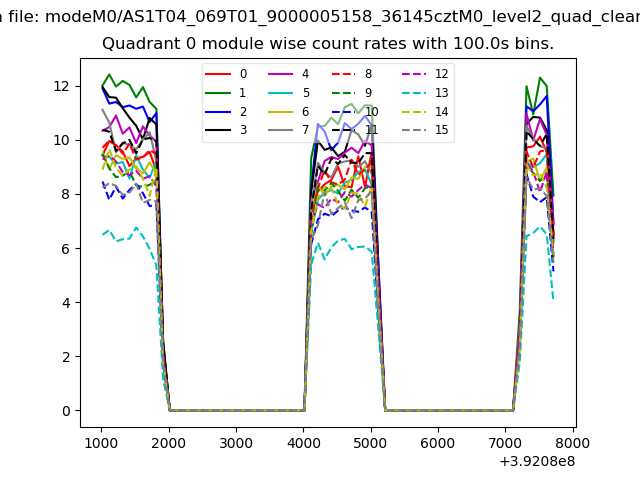 |
 |
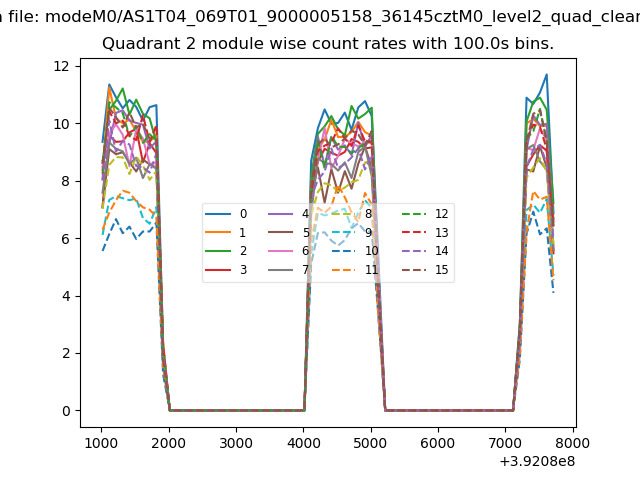
| Module-wise count rates for Quadrant B Data is divided into 100 sec bins |
 |
 |
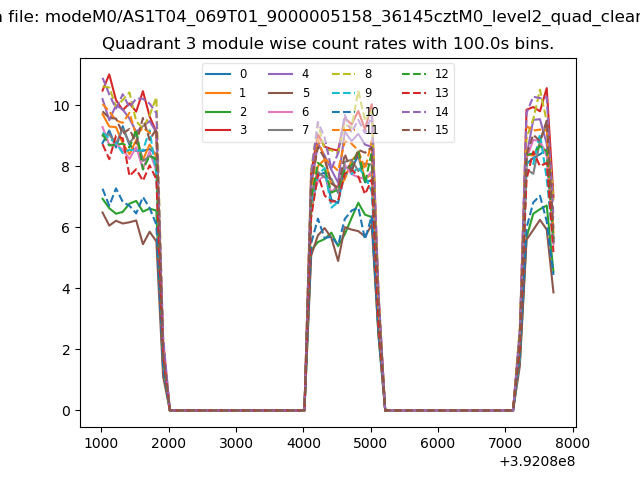
| Module-wise count rates for Quadrant C Data is divided into 100 sec bins |
 |
 |
| Module-wise count rates for Quadrant D Data is divided into 100 sec bins |
 |
 |
| Parameter | Plot |
|---|---|
| CZT HV Monitor | 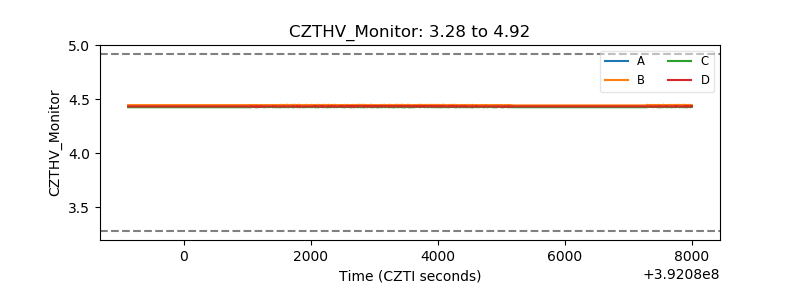 |
| D_VDD | 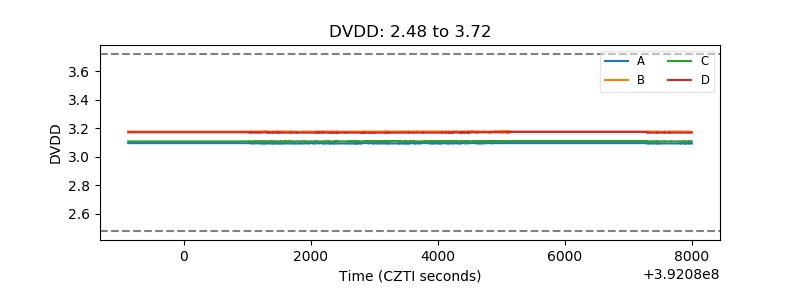 |
| Temperature 1 | 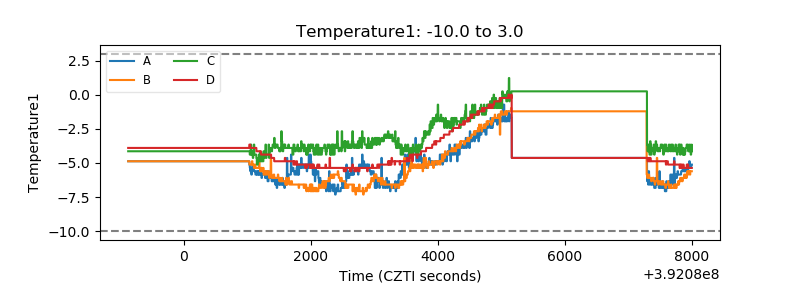 |
| Veto HV Monitor | 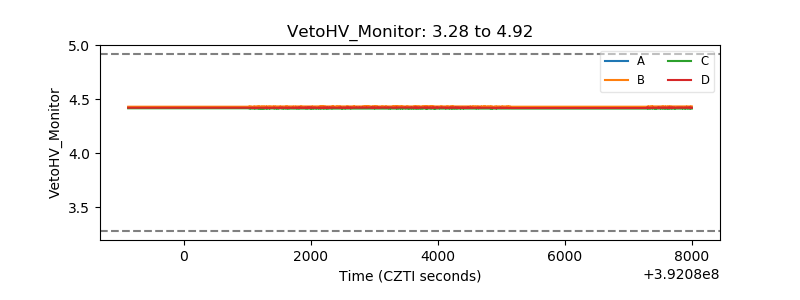 |
| Veto LLD | 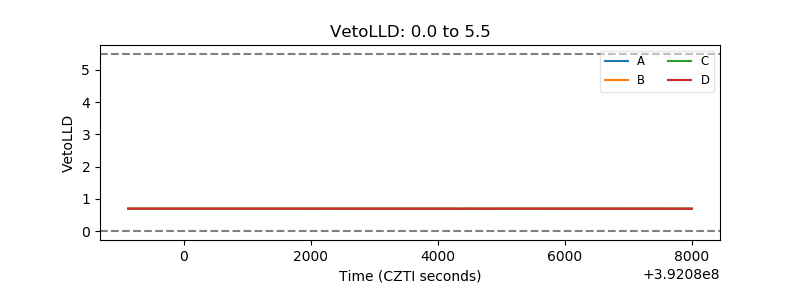 |
| Alpha Counter | 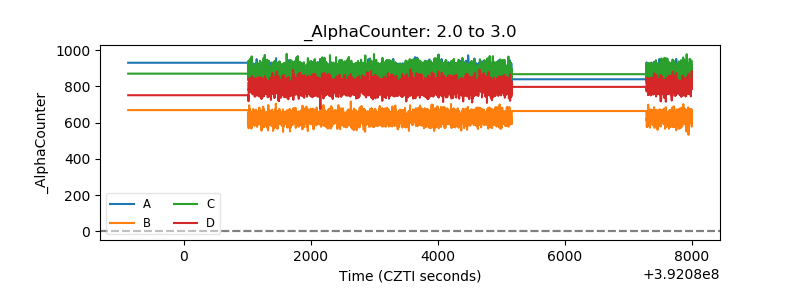 |
| _CPM_Rate | 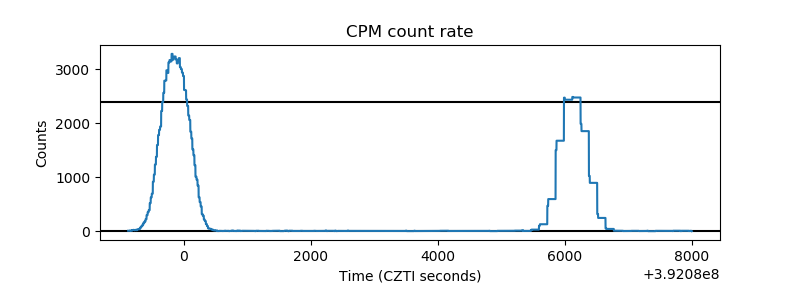 |
| CZT Counter | 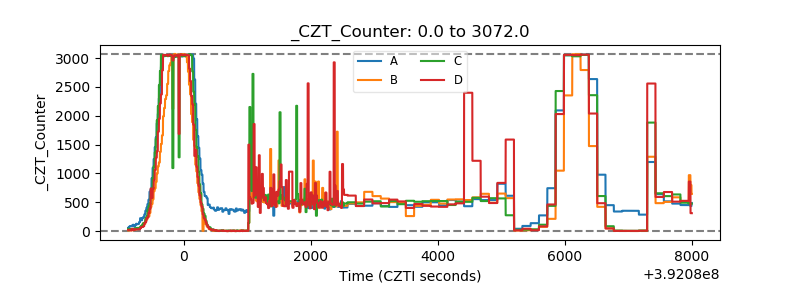 |
| +2.5 Volts monitor | 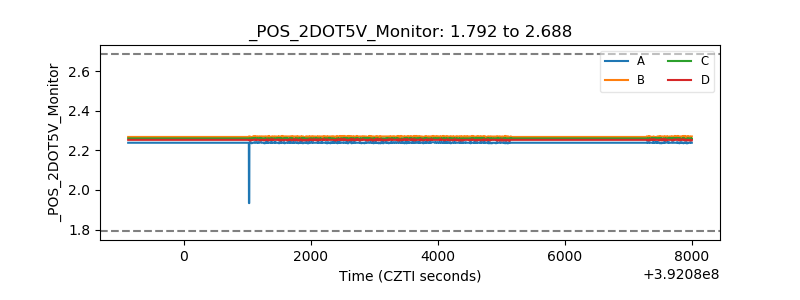 |
| +5 Volts monitor | 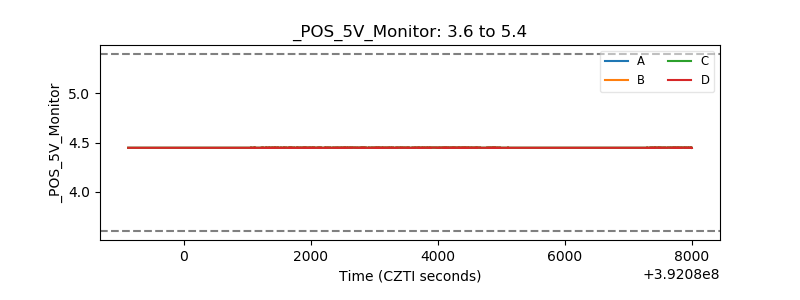 |
| _ROLL_ROT | 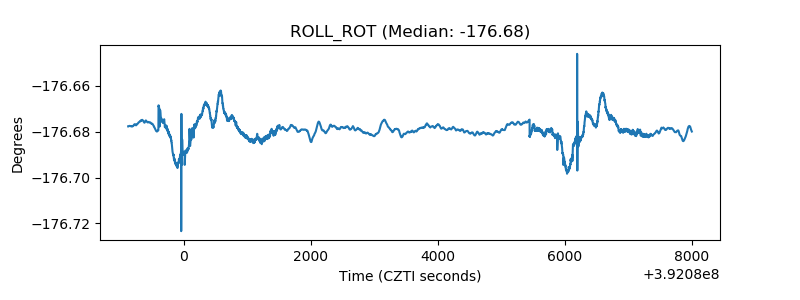 |
| _Roll_DEC | 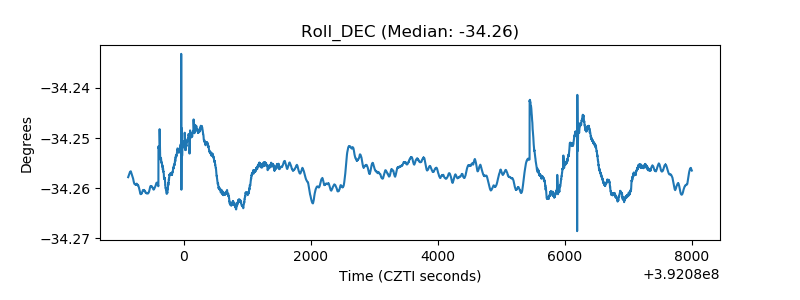 |
| _Roll_RA | 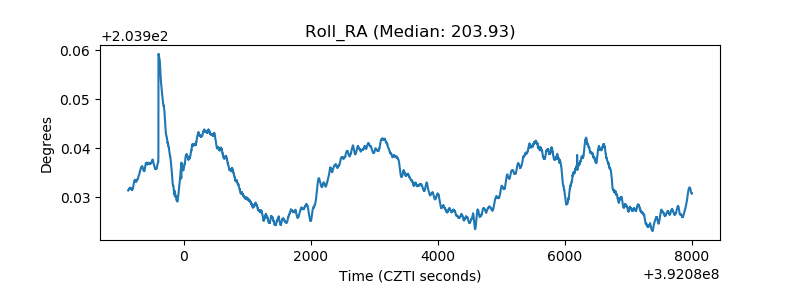 |
| Veto Counter | 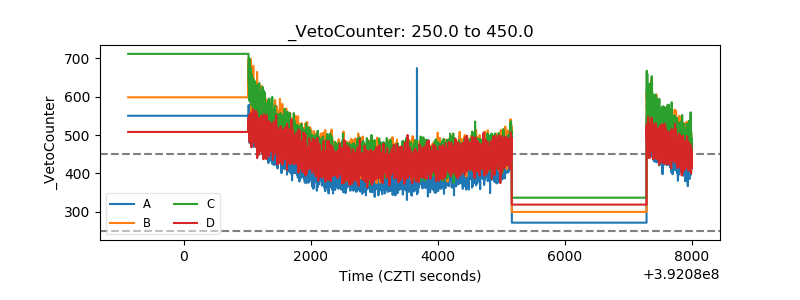 |