| Param | Original file | Final file |
|---|---|---|
| Filename | modeM0/AS1T04_069T01_9000005158_36144cztM0_level2.evt | modeM0/AS1T04_069T01_9000005158_36144cztM0_level2_quad_clean.evt |
| Size (bytes) | 428,820,480 | 61,272,000 |
| Size | 409.0 MB | 58.4 MB |
| Events in quadrant A | 2,504,851 | 390,506 |
| Events in quadrant B | 3,366,444 | 392,132 |
| Events in quadrant C | 2,805,236 | 377,109 |
| Events in quadrant D | 3,978,227 | 352,194 |
| Mode M0 | |||
|---|---|---|---|
| Quadrant | BADHDUFLAG | Total packets | Discarded packets |
| A | 0 | 10358 | 3 |
| B | 0 | 13067 | 2 |
| C | 0 | 11119 | 2 |
| D | 0 | 15052 | 2 |
| Mode M9 | |||
|---|---|---|---|
| Quadrant | BADHDUFLAG | Total packets | Discarded packets |
| A | 0 | 28 | 0 |
| B | 0 | 28 | 0 |
| C | 0 | 28 | 0 |
| D | 0 | 29 | 0 |
| Mode SS | |||
|---|---|---|---|
| Quadrant | BADHDUFLAG | Total packets | Discarded packets |
| A | 0 | 100 | 0 |
| B | 0 | 100 | 0 |
| C | 0 | 100 | 0 |
| D | 0 | 100 | 0 |
| Quadrant | Total seconds | Saturated seconds | Saturation percentage |
|---|---|---|---|
| A | 4890 | 14 | 0.286299% |
| B | 4890 | 235 | 4.805726% |
| C | 4890 | 64 | 1.308793% |
| D | 4890 | 347 | 7.096115% |
Noise dominated data is calculated using 1-second bins in cleaned event files. If a bin has >2000 counts, and if more than 50% of those come from <1% of pixels, then it is considered to be noise-dominated and hence unusable.
| Quadrant | # 1 sec bins | Bins with >0 counts | Bins with >2000 counts | High rate bins dominated by noise | Noise dominated (total time) | Noise dominated (detector-on time) | Marked lightcurve |
|---|---|---|---|---|---|---|---|
| A | 6923 | 4891 | 8 | 8 | 0.12% | 0.16% | 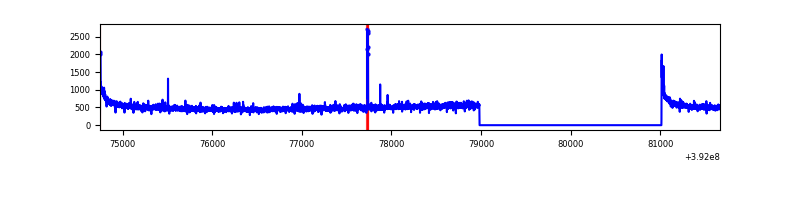 |
| B | 6923 | 4891 | 176 | 176 | 2.54% | 3.60% | 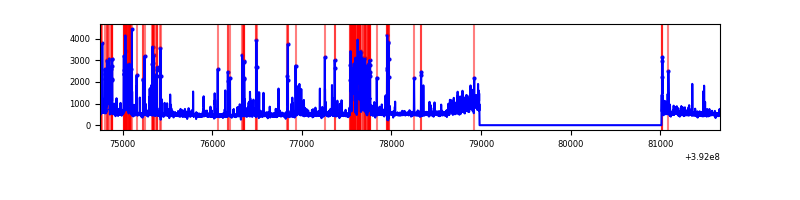 |
| C | 6923 | 4891 | 52 | 52 | 0.75% | 1.06% | 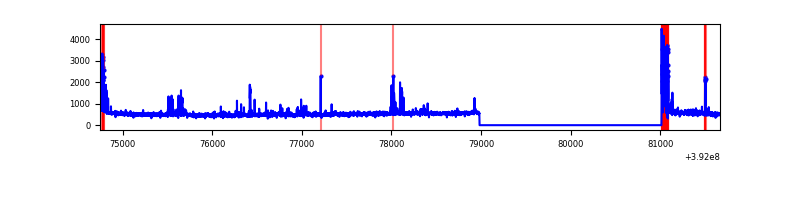 |
| D | 6923 | 4891 | 298 | 298 | 4.30% | 6.09% | 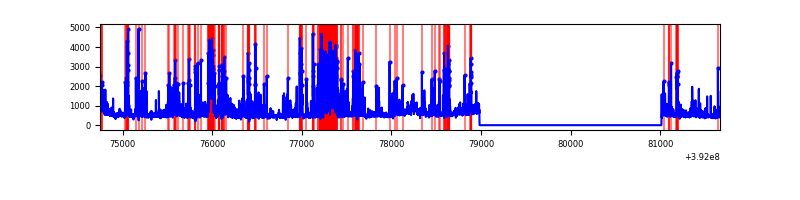 |
Top three noisy pixels from each quadrant. If the there are fewer than three noisy pixels in the level2.evt file, extra rows are filled as -1
| Pixel properties | Quadrant properties | ||||||
|---|---|---|---|---|---|---|---|
| Quadrant | DetID | PixID | Counts | Sigma | Mean | Median | Sigma |
| A | 10 | 83 | 165771 | 1379.33 | 593 | 584 | 119.8 |
| A | 9 | 143 | 23241 | 189.19 | 593 | 584 | 119.8 |
| A | 13 | 6 | 10563 | 83.33 | 593 | 584 | 119.8 |
| B | 5 | 172 | 639147 | 5677.41 | 584 | 571 | 112.5 |
| B | 4 | 171 | 258271 | 2291.14 | 584 | 571 | 112.5 |
| B | 0 | 213 | 111593 | 987.07 | 584 | 571 | 112.5 |
| C | 15 | 214 | 207961 | 1552.47 | 572 | 578 | 133.6 |
| C | 0 | 10 | 190860 | 1424.45 | 572 | 578 | 133.6 |
| C | 1 | 23 | 141511 | 1055.03 | 572 | 578 | 133.6 |
| D | 12 | 17 | 842394 | 6249.79 | 552 | 537 | 134.7 |
| D | 1 | 52 | 445646 | 3304.4 | 552 | 537 | 134.7 |
| D | 12 | 6 | 158086 | 1169.61 | 552 | 537 | 134.7 |
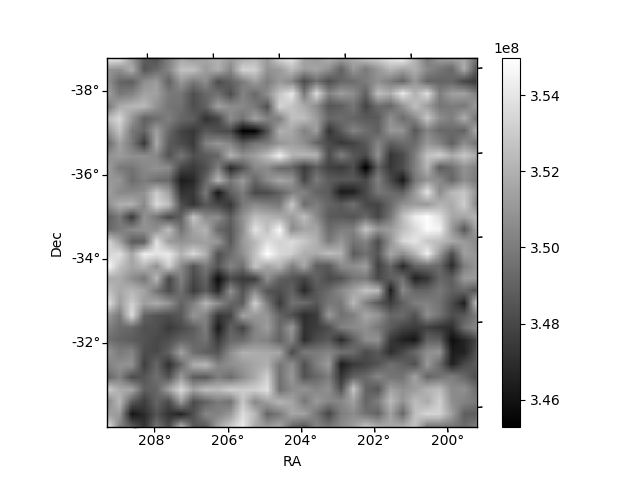
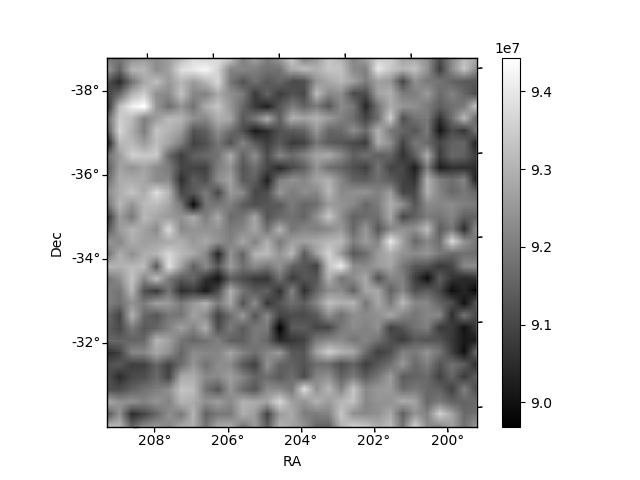
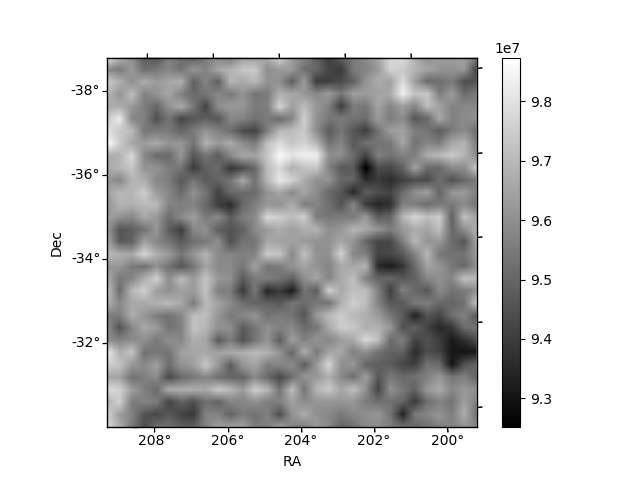
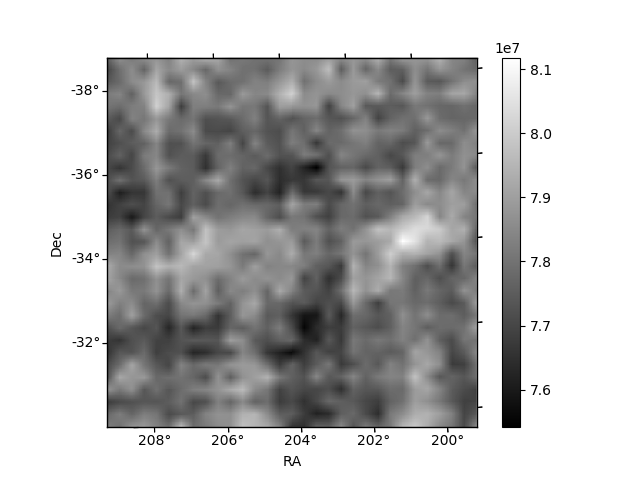
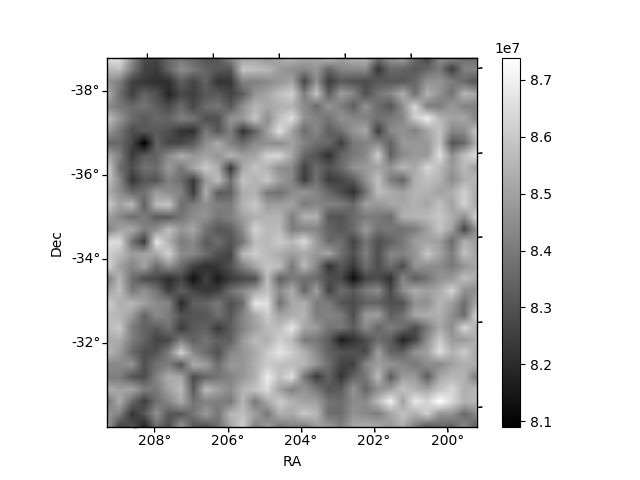
Histogram calculated using DETX and DETY for each event in the final _common_clean file
| Quadrant A | 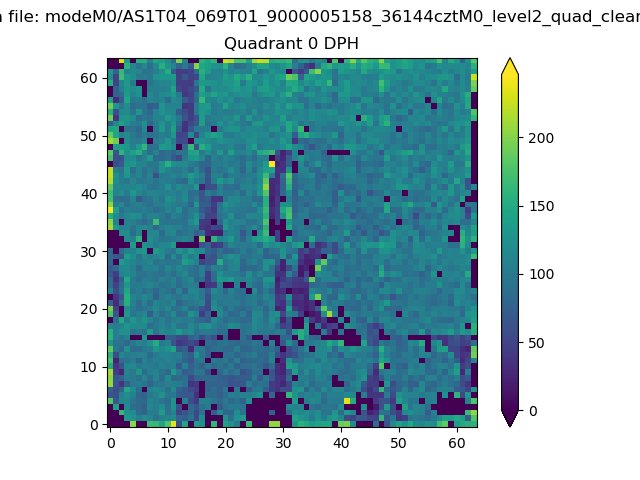 |
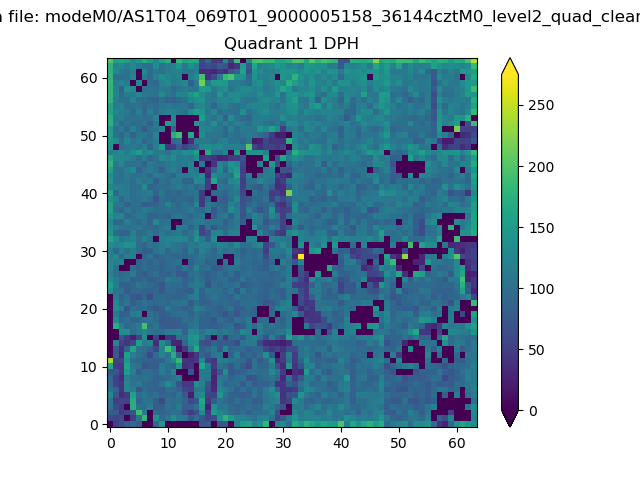 |
Quadrant B |
|---|---|---|---|
| Quadrant D |  |
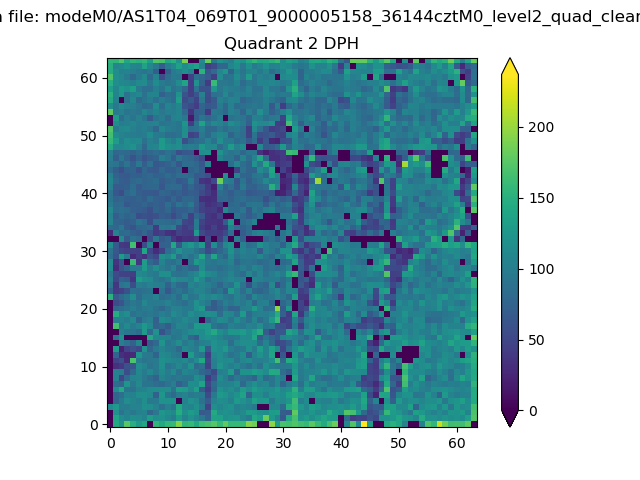 |
Quadrant C |
| Plot type | Count rate plots | Images |
|---|---|---|
| Comparison with Poisson distribution Blue bars denote a histogram of data divided into 1 sec bins. Red curve is a Poisson curve with rate = median count rate of data. |
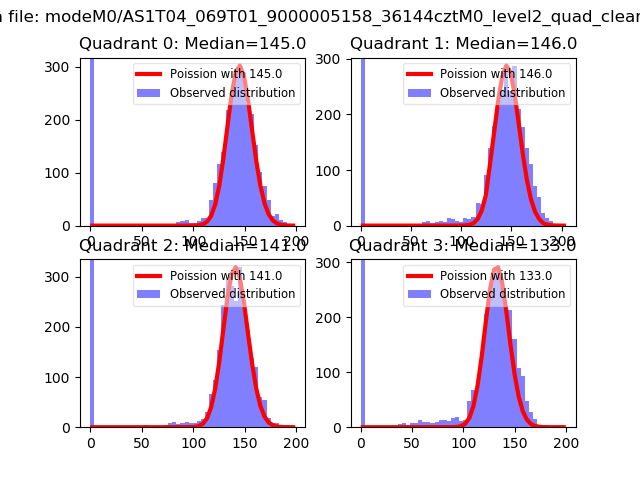 |
 |
| Quadrant-wise count rates Data is divided into 100 sec bins |
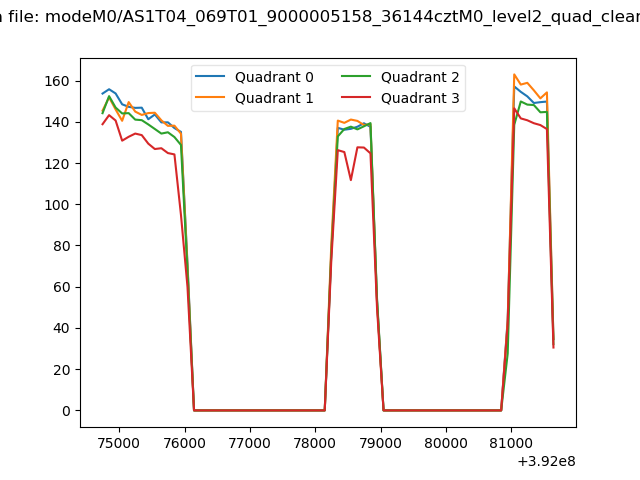 |
|
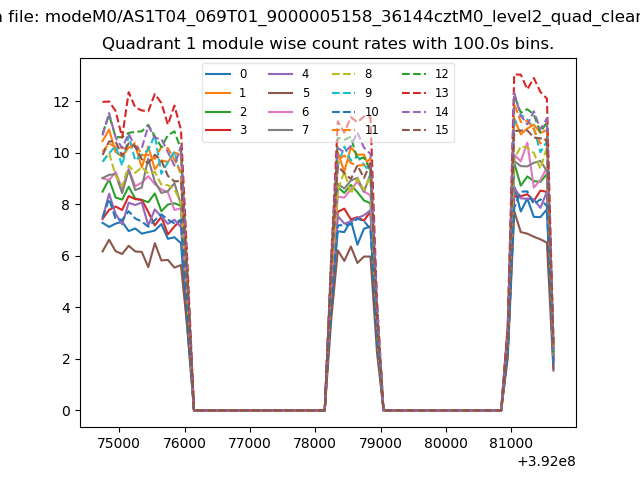
| Module-wise count rates for Quadrant A Data is divided into 100 sec bins |
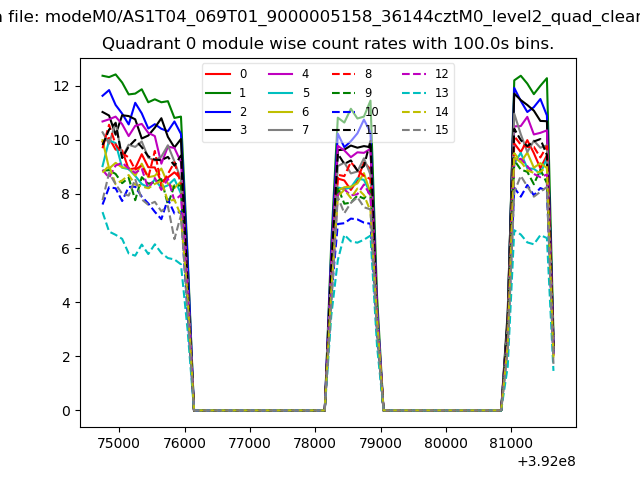 |
 |
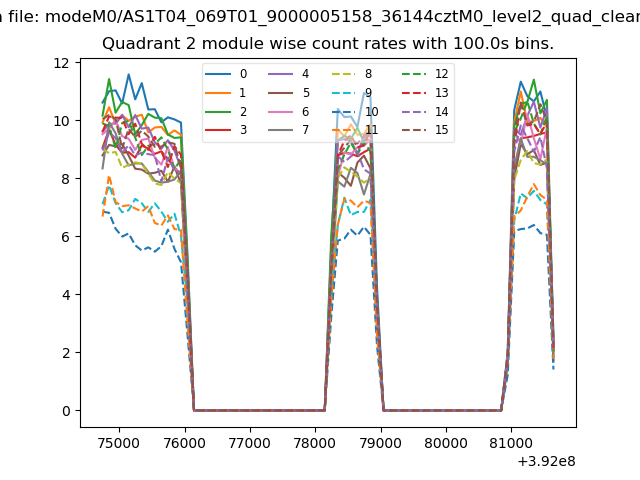
| Module-wise count rates for Quadrant B Data is divided into 100 sec bins |
 |
 |
| Module-wise count rates for Quadrant C Data is divided into 100 sec bins |
 |
 |
| Module-wise count rates for Quadrant D Data is divided into 100 sec bins |
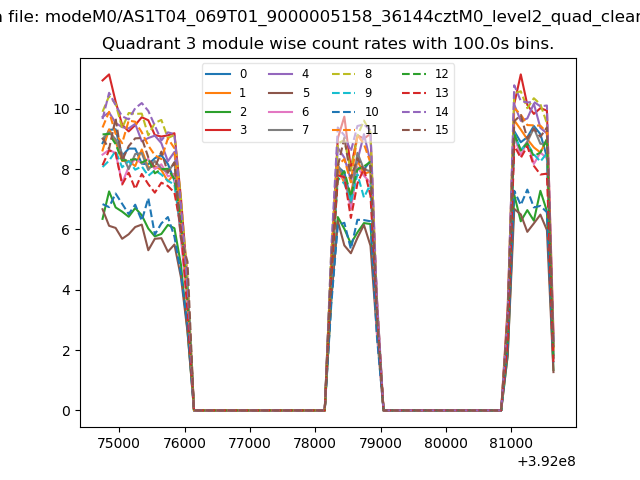 |
 |
| Parameter | Plot |
|---|---|
| CZT HV Monitor | 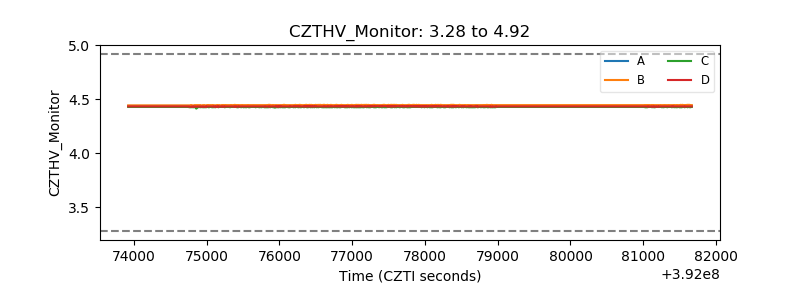 |
| D_VDD | 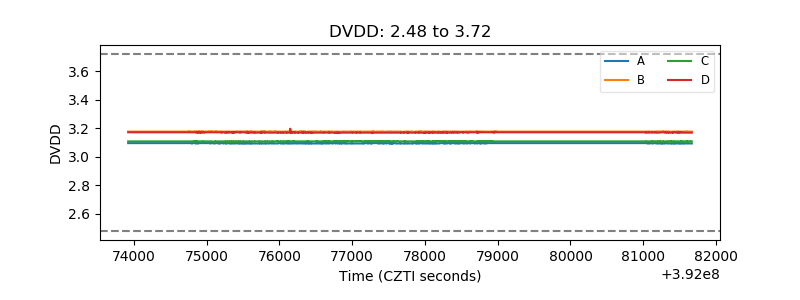 |
| Temperature 1 | 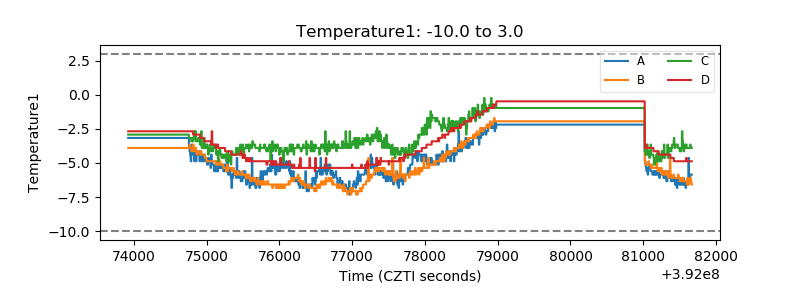 |
| Veto HV Monitor | 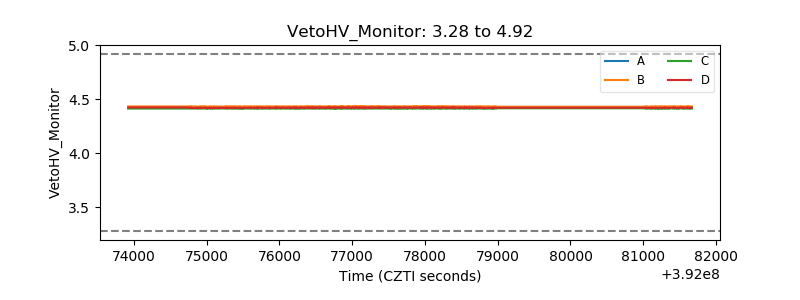 |
| Veto LLD | 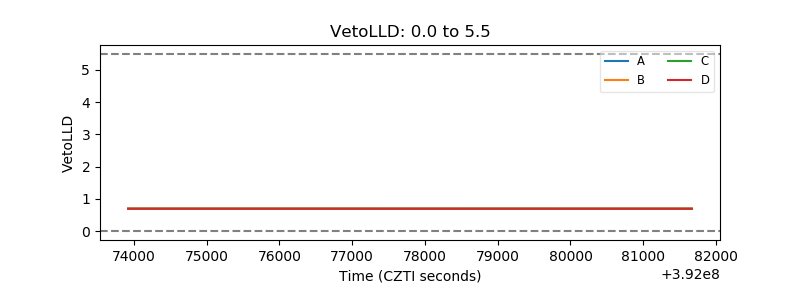 |
| Alpha Counter | 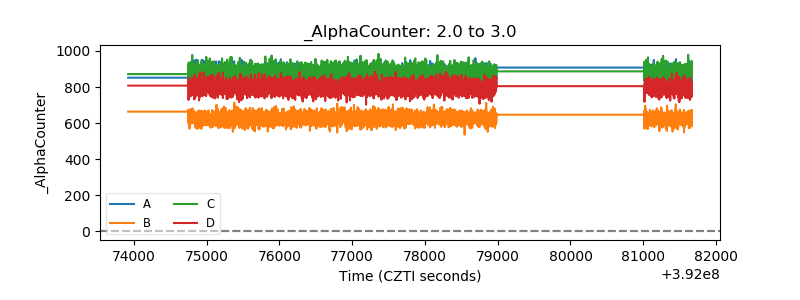 |
| _CPM_Rate | 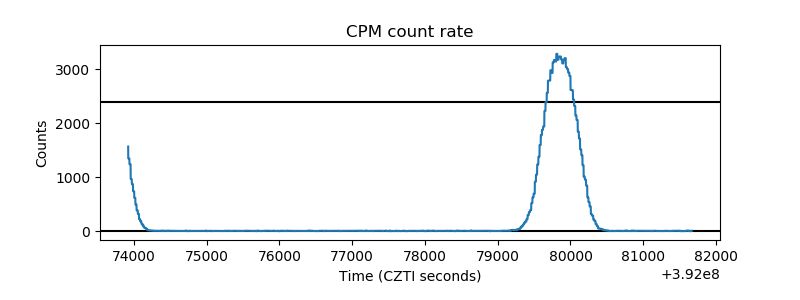 |
| CZT Counter | 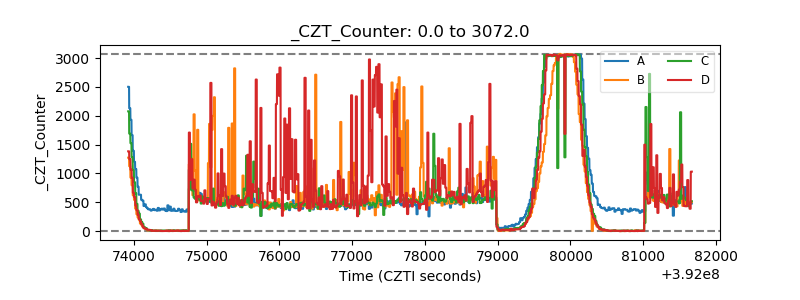 |
| +2.5 Volts monitor | 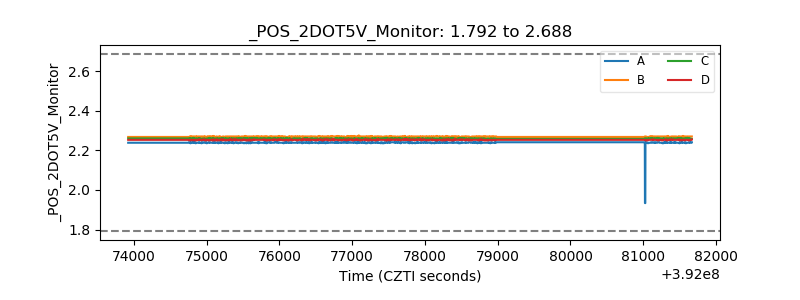 |
| +5 Volts monitor | 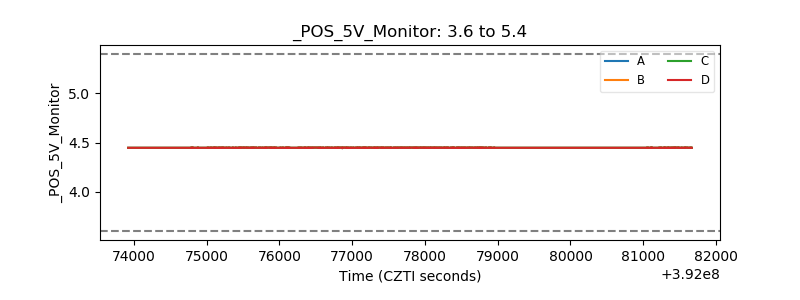 |
| _ROLL_ROT | 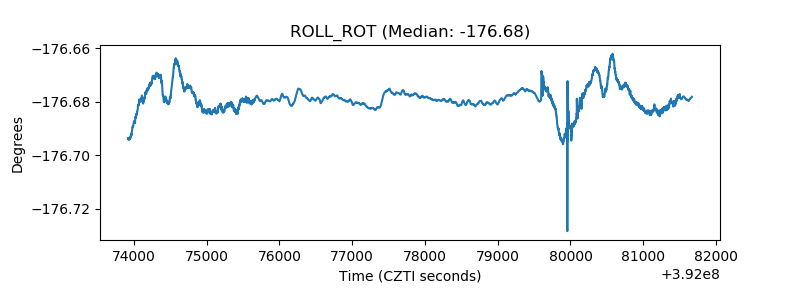 |
| _Roll_DEC |  |
| _Roll_RA | 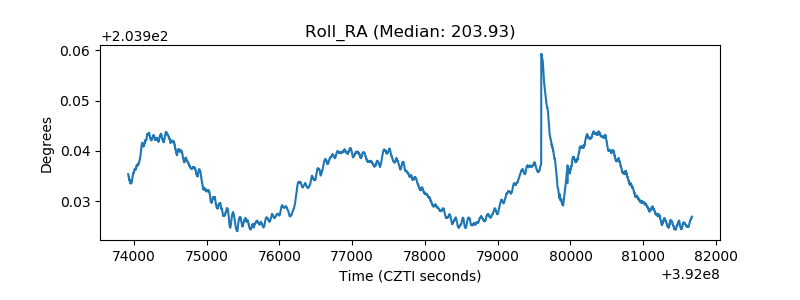 |
| Veto Counter | 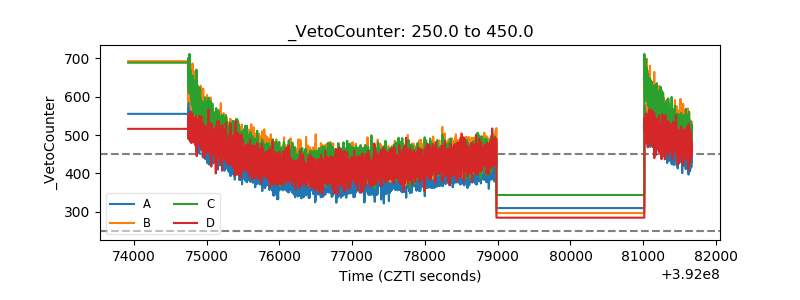 |