| Param | Original file | Final file |
|---|---|---|
| Filename | modeM0/AS1T04_069T01_9000005158_36140cztM0_level2.evt | modeM0/AS1T04_069T01_9000005158_36140cztM0_level2_quad_clean.evt |
| Size (bytes) | 454,656,960 | 69,252,480 |
| Size | 433.6 MB | 66.0 MB |
| Events in quadrant A | 2,722,393 | 449,601 |
| Events in quadrant B | 3,856,363 | 421,011 |
| Events in quadrant C | 2,840,116 | 427,452 |
| Events in quadrant D | 3,973,478 | 410,355 |
| Mode M0 | |||
|---|---|---|---|
| Quadrant | BADHDUFLAG | Total packets | Discarded packets |
| A | 0 | 11688 | 3 |
| B | 0 | 15059 | 2 |
| C | 0 | 11901 | 2 |
| D | 0 | 15529 | 2 |
| Mode M9 | |||
|---|---|---|---|
| Quadrant | BADHDUFLAG | Total packets | Discarded packets |
| A | 0 | 21 | 0 |
| B | 0 | 21 | 0 |
| C | 0 | 21 | 0 |
| D | 0 | 22 | 0 |
| Mode SS | |||
|---|---|---|---|
| Quadrant | BADHDUFLAG | Total packets | Discarded packets |
| A | 0 | 114 | 0 |
| B | 0 | 114 | 0 |
| C | 0 | 114 | 0 |
| D | 0 | 114 | 0 |
| Quadrant | Total seconds | Saturated seconds | Saturation percentage |
|---|---|---|---|
| A | 5546 | 15 | 0.270465% |
| B | 5546 | 380 | 6.851785% |
| C | 5546 | 86 | 1.550667% |
| D | 5546 | 251 | 4.525784% |
Noise dominated data is calculated using 1-second bins in cleaned event files. If a bin has >2000 counts, and if more than 50% of those come from <1% of pixels, then it is considered to be noise-dominated and hence unusable.
| Quadrant | # 1 sec bins | Bins with >0 counts | Bins with >2000 counts | High rate bins dominated by noise | Noise dominated (total time) | Noise dominated (detector-on time) | Marked lightcurve |
|---|---|---|---|---|---|---|---|
| A | 7190 | 5547 | 2 | 2 | 0.03% | 0.04% | 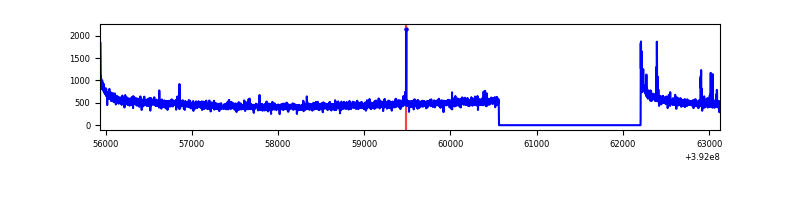 |
| B | 7189 | 5546 | 296 | 296 | 4.12% | 5.34% | 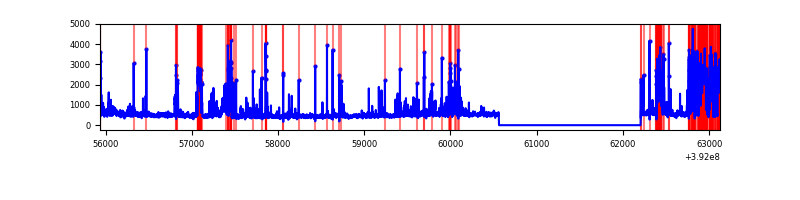 |
| C | 7190 | 5547 | 63 | 63 | 0.88% | 1.14% | 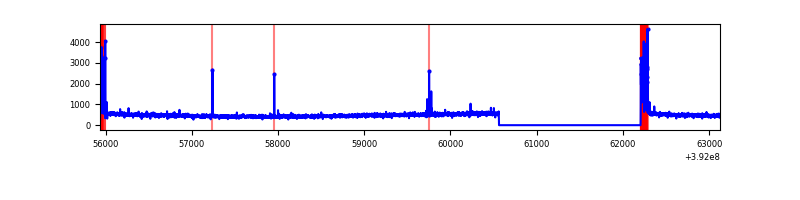 |
| D | 7190 | 5547 | 235 | 235 | 3.27% | 4.24% | 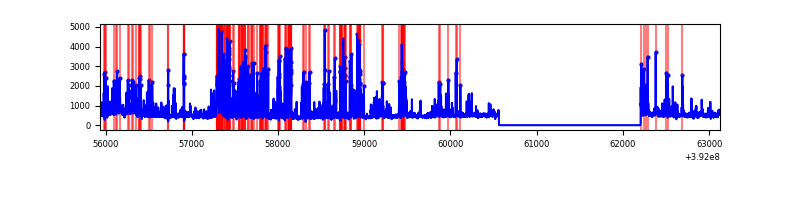 |
Top three noisy pixels from each quadrant. If the there are fewer than three noisy pixels in the level2.evt file, extra rows are filled as -1
| Pixel properties | Quadrant properties | ||||||
|---|---|---|---|---|---|---|---|
| Quadrant | DetID | PixID | Counts | Sigma | Mean | Median | Sigma |
| A | 10 | 83 | 187312 | 1436.59 | 639 | 627 | 129.9 |
| A | 9 | 143 | 36236 | 274.02 | 639 | 627 | 129.9 |
| A | 8 | 144 | 22535 | 168.59 | 639 | 627 | 129.9 |
| B | 5 | 172 | 1113345 | 9337.84 | 611 | 594 | 119.2 |
| B | 4 | 171 | 154751 | 1293.64 | 611 | 594 | 119.2 |
| B | 0 | 190 | 75315 | 627.03 | 611 | 594 | 119.2 |
| C | 15 | 214 | 235390 | 1644.97 | 606 | 609 | 142.7 |
| C | 0 | 10 | 221399 | 1546.95 | 606 | 609 | 142.7 |
| C | 10 | 49 | 18081 | 122.42 | 606 | 609 | 142.7 |
| D | 12 | 17 | 805543 | 5458.1 | 604 | 586 | 147.5 |
| D | 2 | 249 | 253726 | 1716.44 | 604 | 586 | 147.5 |
| D | 1 | 52 | 218062 | 1474.62 | 604 | 586 | 147.5 |
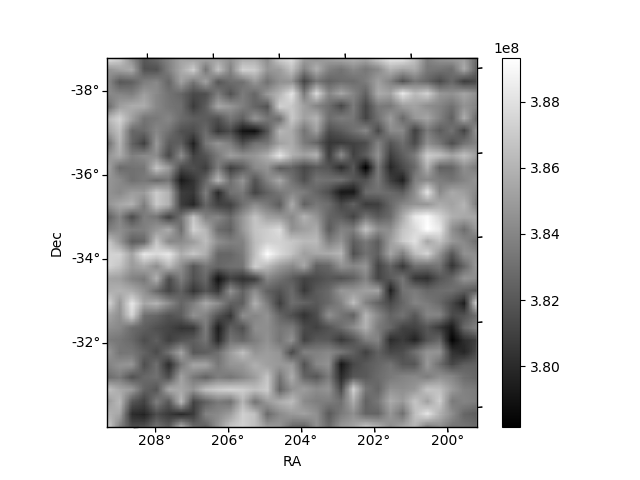
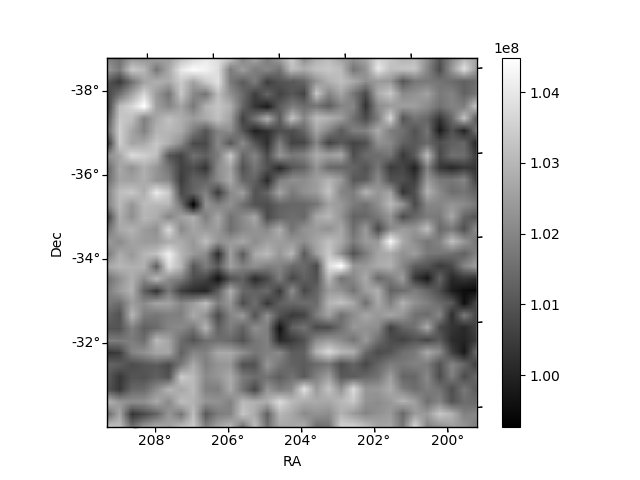
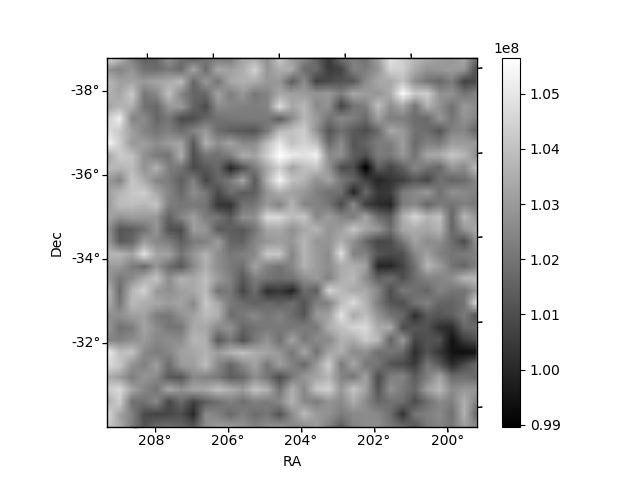
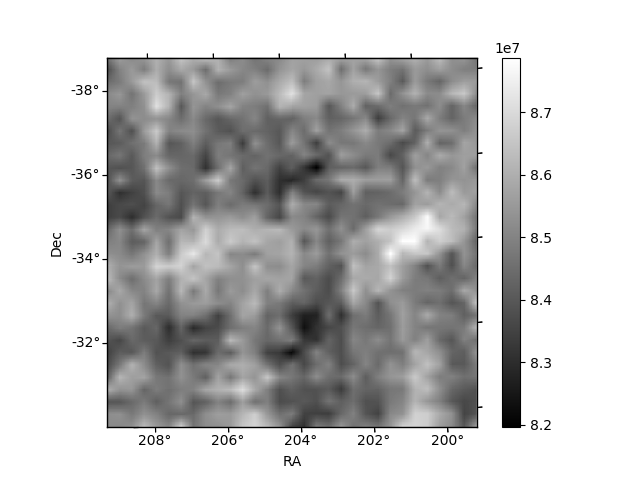
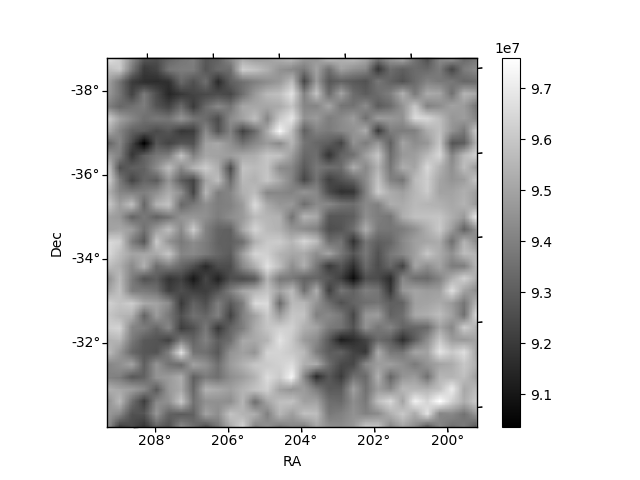
Histogram calculated using DETX and DETY for each event in the final _common_clean file
| Quadrant A | 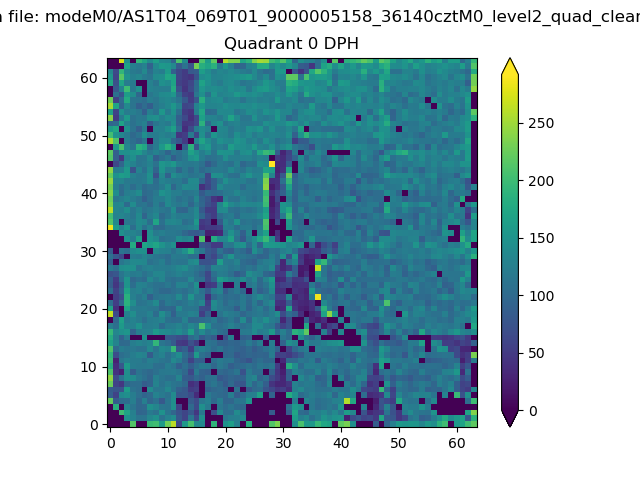 |
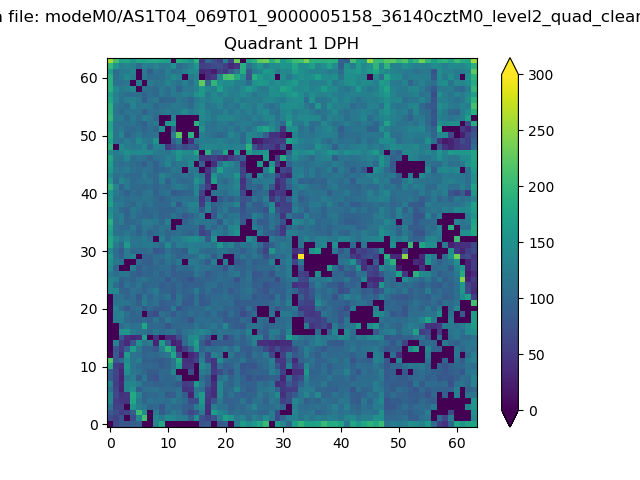 |
Quadrant B |
|---|---|---|---|
| Quadrant D | 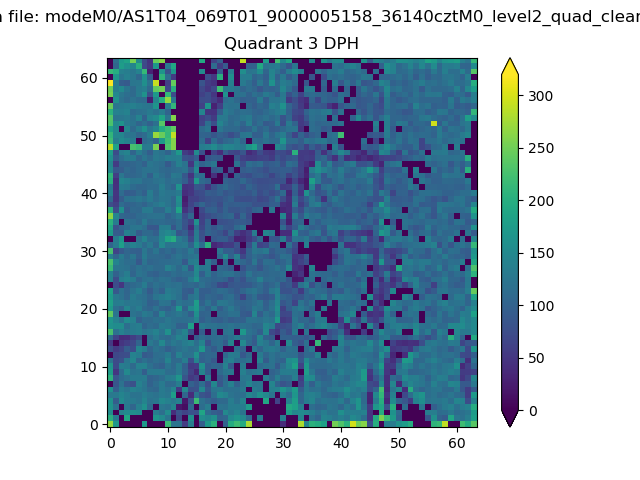 |
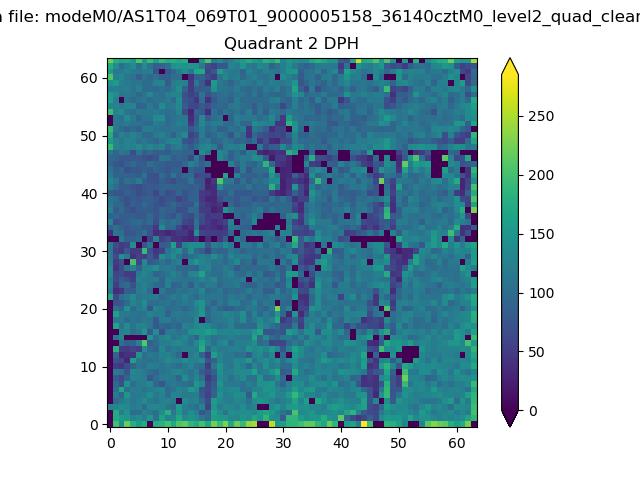 |
Quadrant C |
| Plot type | Count rate plots | Images |
|---|---|---|
| Comparison with Poisson distribution Blue bars denote a histogram of data divided into 1 sec bins. Red curve is a Poisson curve with rate = median count rate of data. |
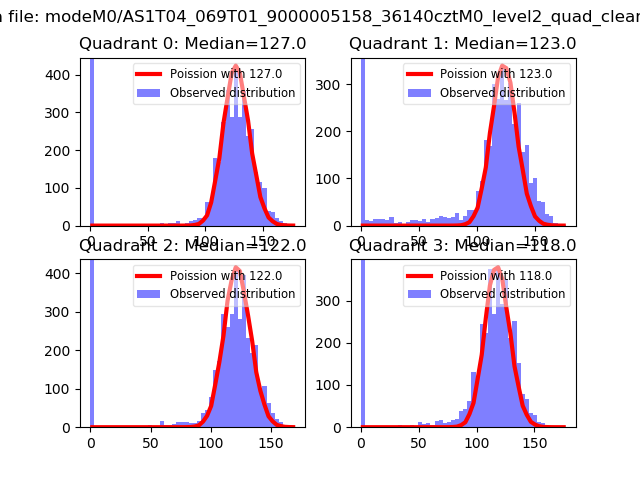 |
 |
| Quadrant-wise count rates Data is divided into 100 sec bins |
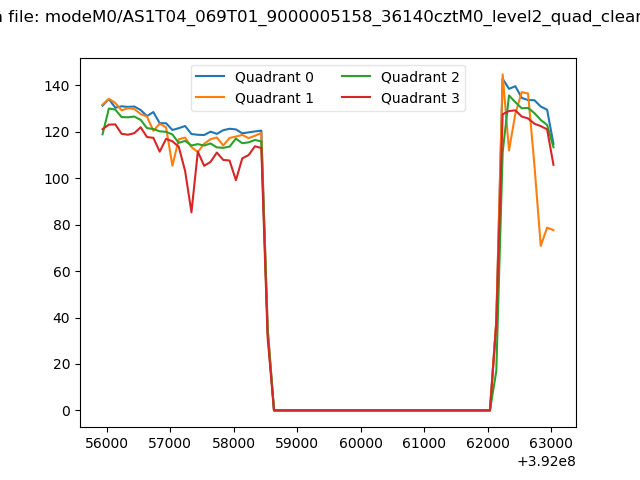 |
|
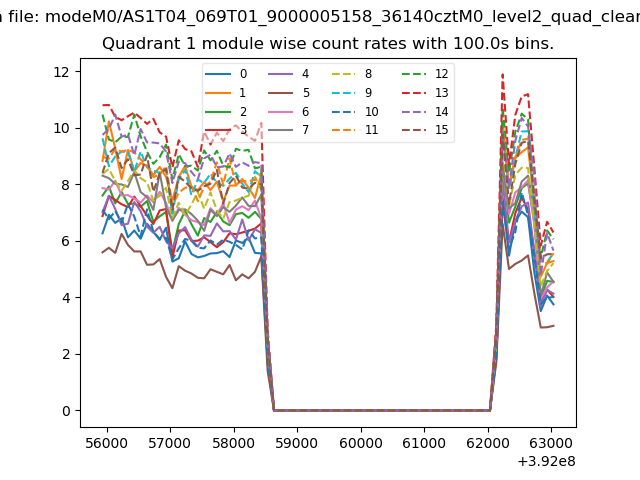
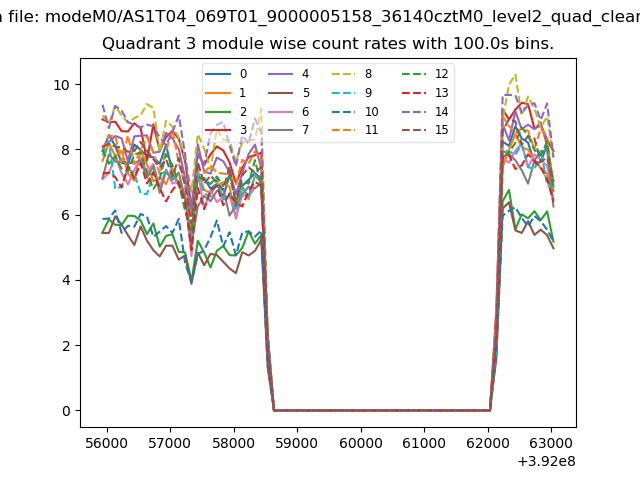
| Module-wise count rates for Quadrant A Data is divided into 100 sec bins |
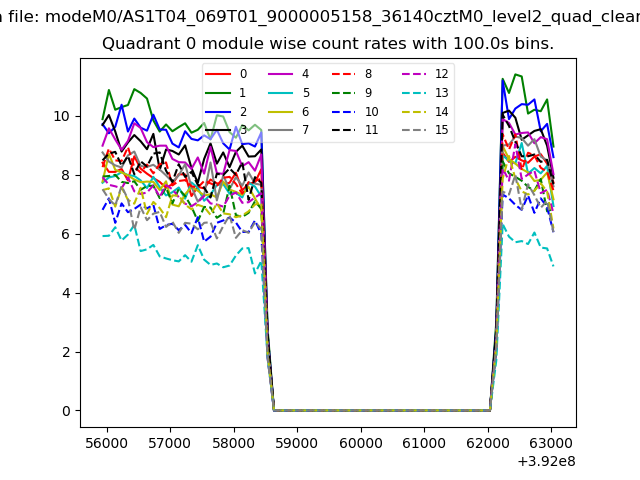 |
 |
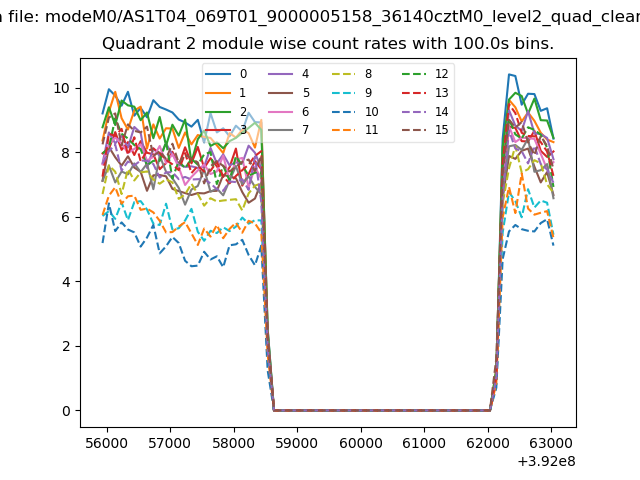
| Module-wise count rates for Quadrant B Data is divided into 100 sec bins |
 |
 |
| Module-wise count rates for Quadrant C Data is divided into 100 sec bins |
 |
 |
| Module-wise count rates for Quadrant D Data is divided into 100 sec bins |
 |
 |
| Parameter | Plot |
|---|---|
| CZT HV Monitor | 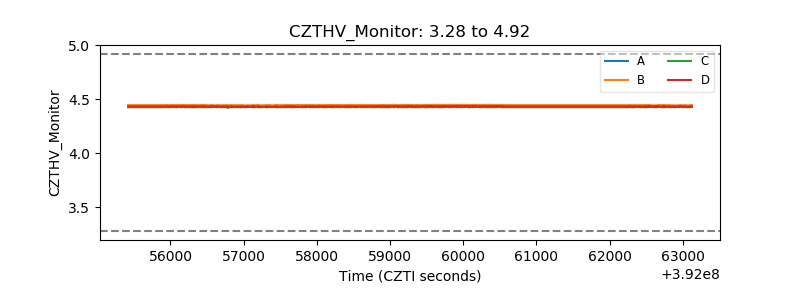 |
| D_VDD | 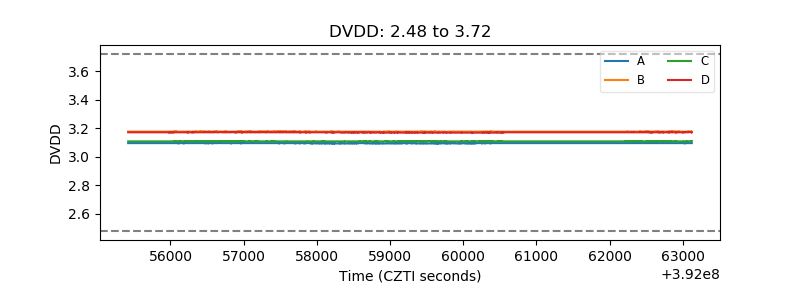 |
| Temperature 1 | 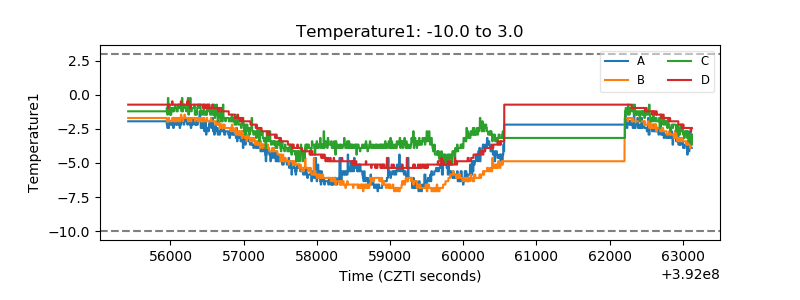 |
| Veto HV Monitor | 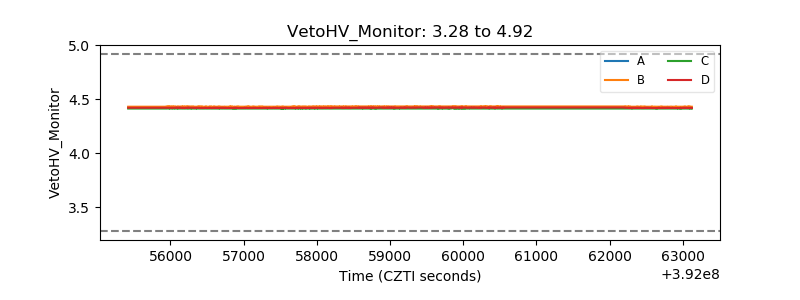 |
| Veto LLD | 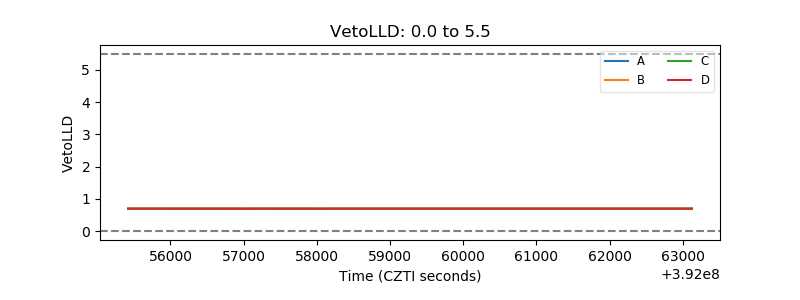 |
| Alpha Counter | 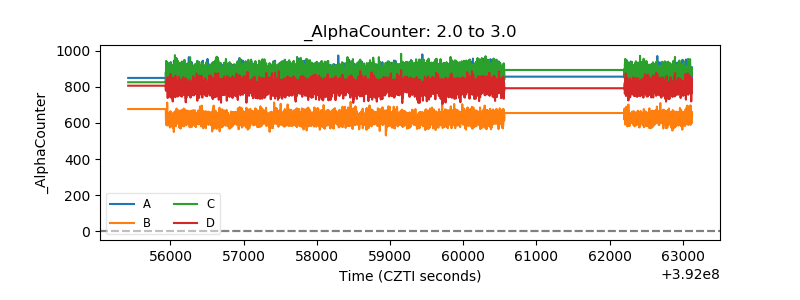 |
| _CPM_Rate | 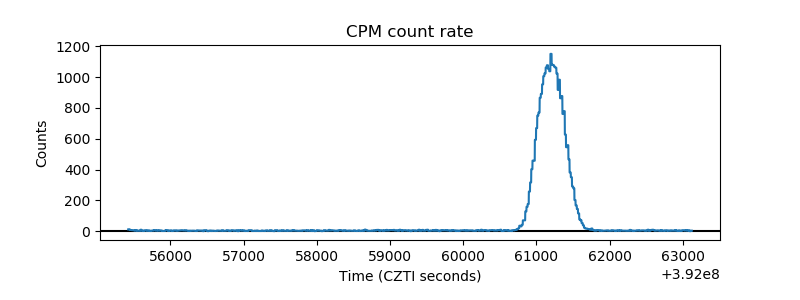 |
| CZT Counter | 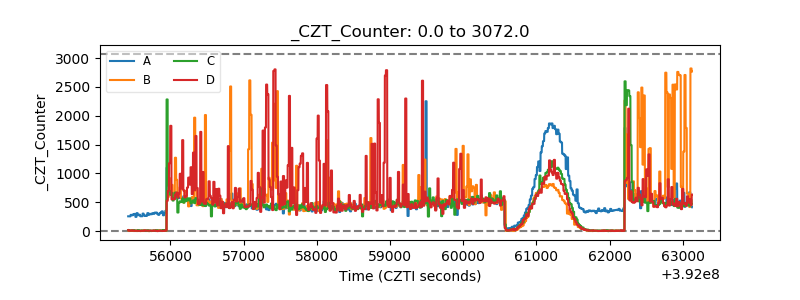 |
| +2.5 Volts monitor | 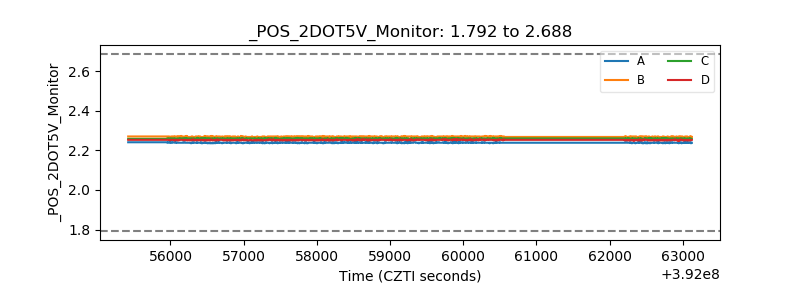 |
| +5 Volts monitor | 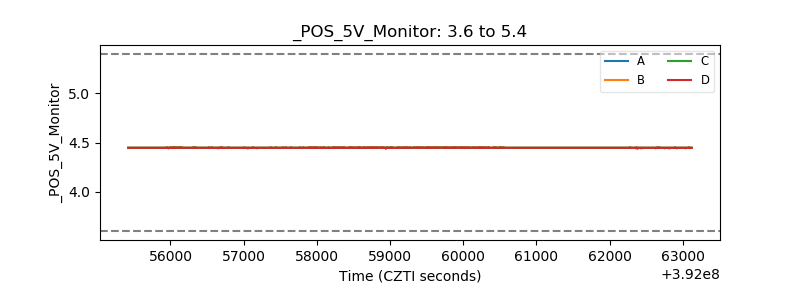 |
| _ROLL_ROT | 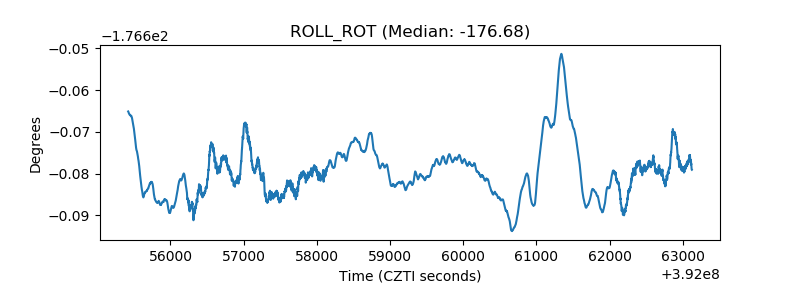 |
| _Roll_DEC | 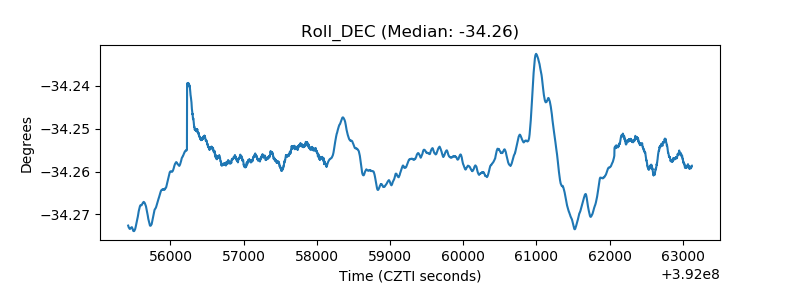 |
| _Roll_RA | 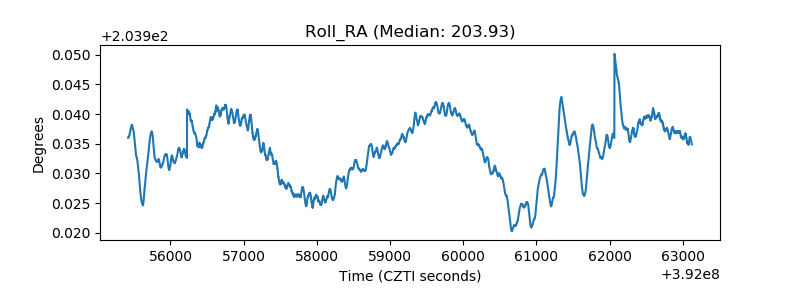 |
| Veto Counter | 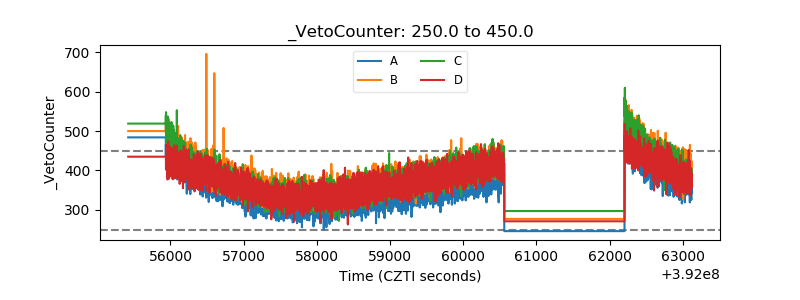 |