| Param | Original file | Final file |
|---|---|---|
| Filename | modeM0/AS1T04_069T01_9000005158_36139cztM0_level2.evt | modeM0/AS1T04_069T01_9000005158_36139cztM0_level2_quad_clean.evt |
| Size (bytes) | 1,191,176,640 | 210,283,200 |
| Size | 1.1 GB | 200.5 MB |
| Events in quadrant A | 7,482,941 | 1,366,729 |
| Events in quadrant B | 9,885,464 | 1,332,282 |
| Events in quadrant C | 8,554,175 | 1,322,939 |
| Events in quadrant D | 9,103,469 | 1,275,583 |
| Mode M0 | |||
|---|---|---|---|
| Quadrant | BADHDUFLAG | Total packets | Discarded packets |
| A | 0 | 32094 | 23 |
| B | 0 | 39618 | 32 |
| C | 0 | 35176 | 16 |
| D | 0 | 37589 | 39 |
| Mode M9 | |||
|---|---|---|---|
| Quadrant | BADHDUFLAG | Total packets | Discarded packets |
| A | 0 | 53 | 0 |
| B | 0 | 53 | 0 |
| C | 0 | 53 | 0 |
| D | 0 | 54 | 0 |
| Mode SS | |||
|---|---|---|---|
| Quadrant | BADHDUFLAG | Total packets | Discarded packets |
| A | 0 | 314 | 0 |
| B | 0 | 314 | 0 |
| C | 0 | 314 | 0 |
| D | 0 | 314 | 0 |
| Quadrant | Total seconds | Saturated seconds | Saturation percentage |
|---|---|---|---|
| A | 15536 | 22 | 0.141607% |
| B | 15535 | 737 | 4.744126% |
| C | 15539 | 217 | 1.396486% |
| D | 15532 | 294 | 1.892866% |
Noise dominated data is calculated using 1-second bins in cleaned event files. If a bin has >2000 counts, and if more than 50% of those come from <1% of pixels, then it is considered to be noise-dominated and hence unusable.
| Quadrant | # 1 sec bins | Bins with >0 counts | Bins with >2000 counts | High rate bins dominated by noise | Noise dominated (total time) | Noise dominated (detector-on time) | Marked lightcurve |
|---|---|---|---|---|---|---|---|
| A | 19784 | 15548 | 1 | 1 | 0.01% | 0.01% | 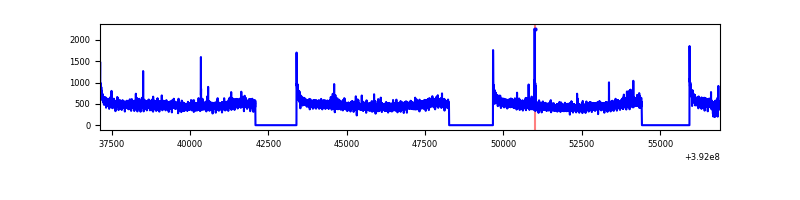 |
| B | 19784 | 15547 | 456 | 456 | 2.30% | 2.93% | 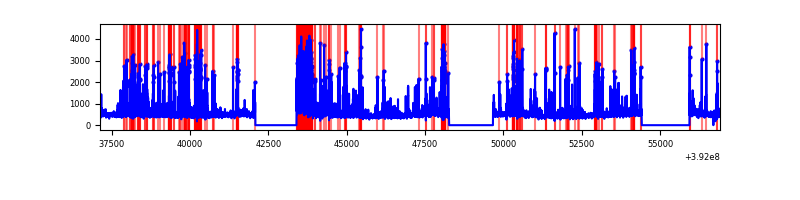 |
| C | 19784 | 15548 | 175 | 175 | 0.88% | 1.13% | 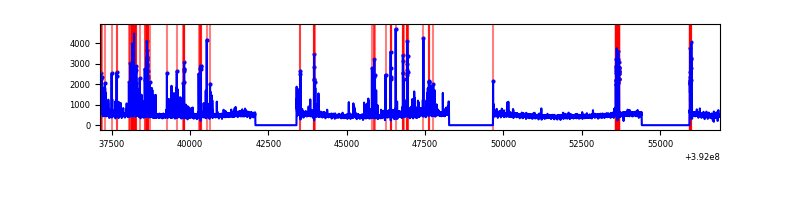 |
| D | 19784 | 15546 | 255 | 255 | 1.29% | 1.64% | 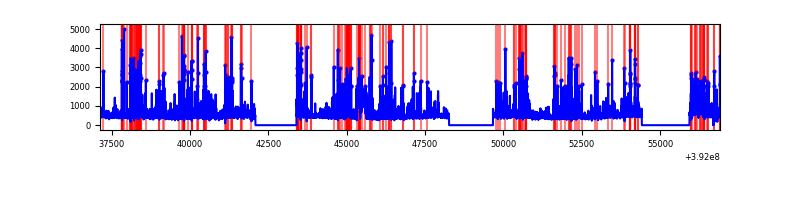 |
Top three noisy pixels from each quadrant. If the there are fewer than three noisy pixels in the level2.evt file, extra rows are filled as -1
| Pixel properties | Quadrant properties | ||||||
|---|---|---|---|---|---|---|---|
| Quadrant | DetID | PixID | Counts | Sigma | Mean | Median | Sigma |
| A | 10 | 83 | 444746 | 1234.4 | 1784 | 1747 | 358.9 |
| A | 8 | 144 | 93532 | 255.75 | 1784 | 1747 | 358.9 |
| A | 9 | 143 | 26072 | 67.78 | 1784 | 1747 | 358.9 |
| B | 5 | 172 | 2461063 | 7372.33 | 1736 | 1688 | 333.6 |
| B | 0 | 213 | 147513 | 437.13 | 1736 | 1688 | 333.6 |
| B | 4 | 171 | 134185 | 397.18 | 1736 | 1688 | 333.6 |
| C | 0 | 207 | 725258 | 1822.86 | 1705 | 1715 | 396.9 |
| C | 15 | 214 | 657385 | 1651.87 | 1705 | 1715 | 396.9 |
| C | 1 | 23 | 246271 | 616.12 | 1705 | 1715 | 396.9 |
| D | 1 | 52 | 655433 | 1554.45 | 1712 | 1664 | 420.6 |
| D | 2 | 249 | 328061 | 776.07 | 1712 | 1664 | 420.6 |
| D | 12 | 17 | 321743 | 761.05 | 1712 | 1664 | 420.6 |
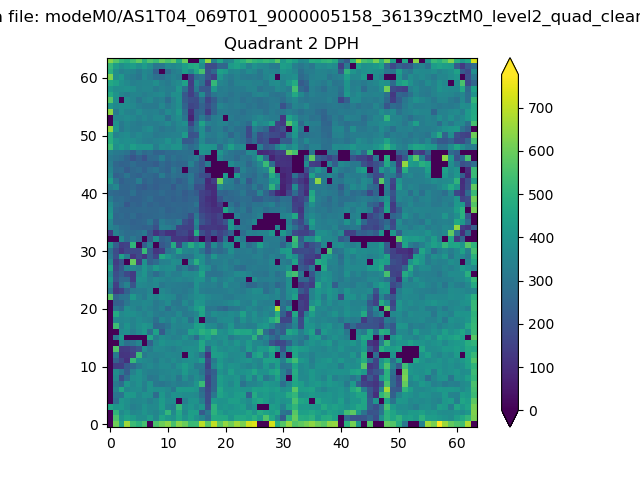
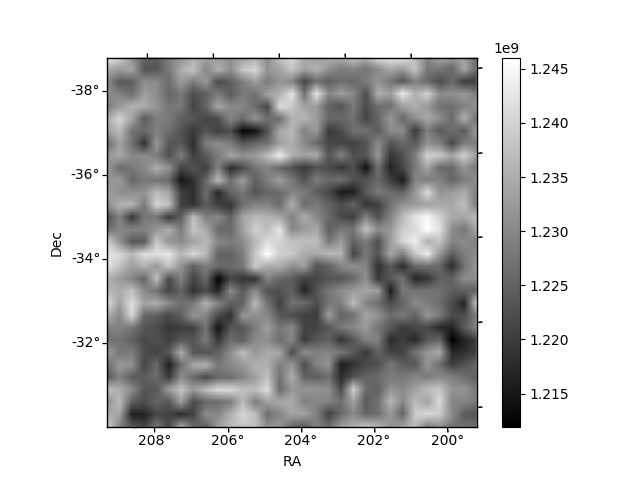
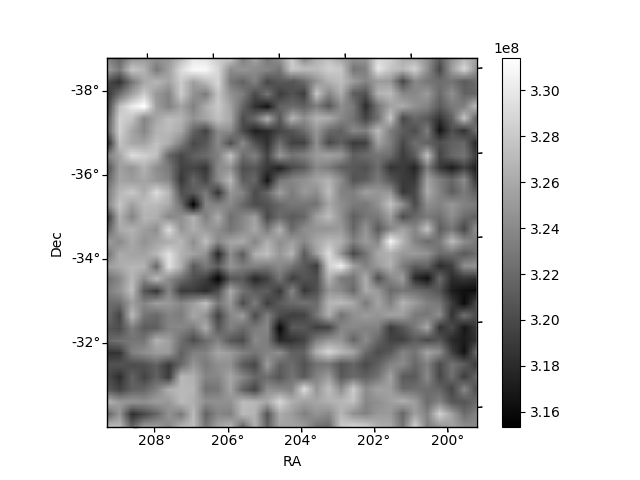
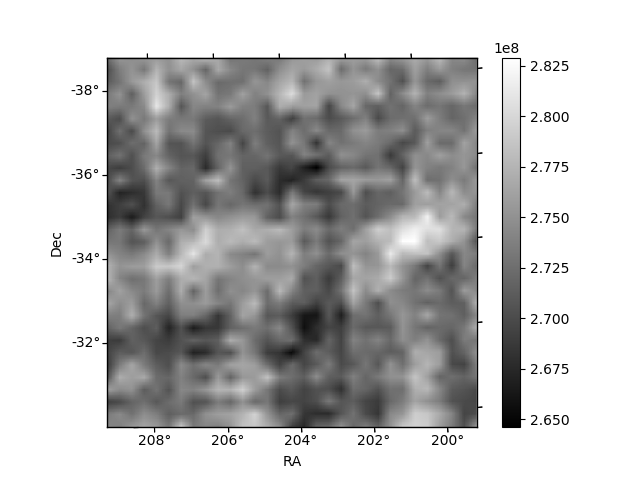
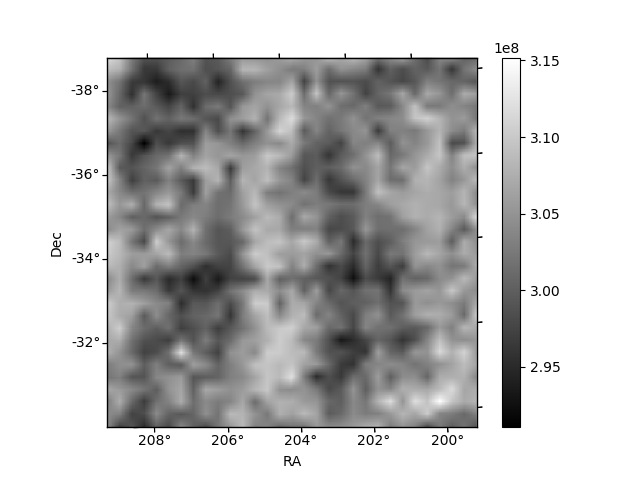
Histogram calculated using DETX and DETY for each event in the final _common_clean file
| Quadrant A | 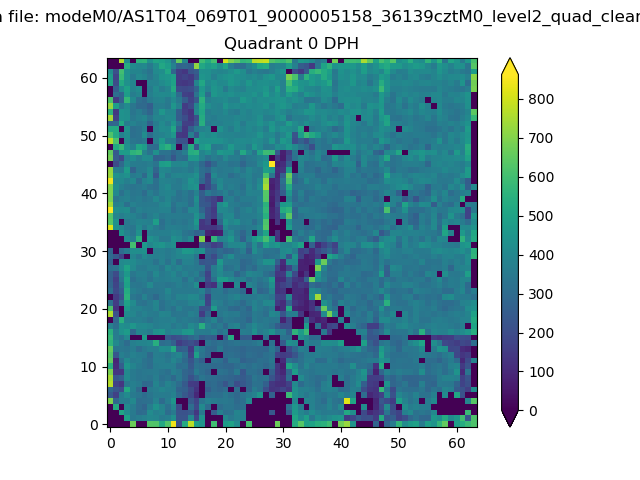 |
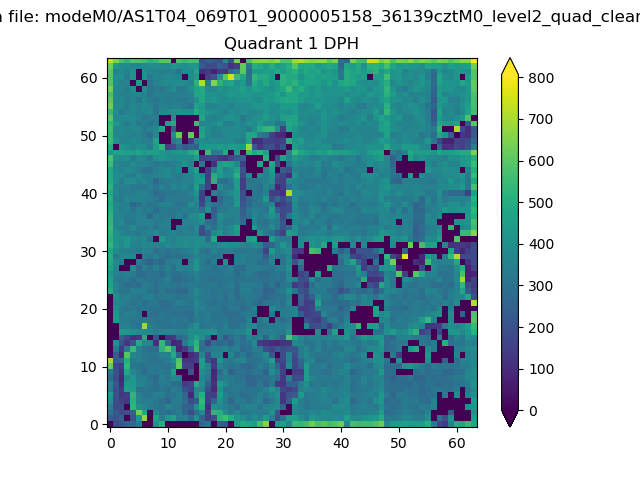 |
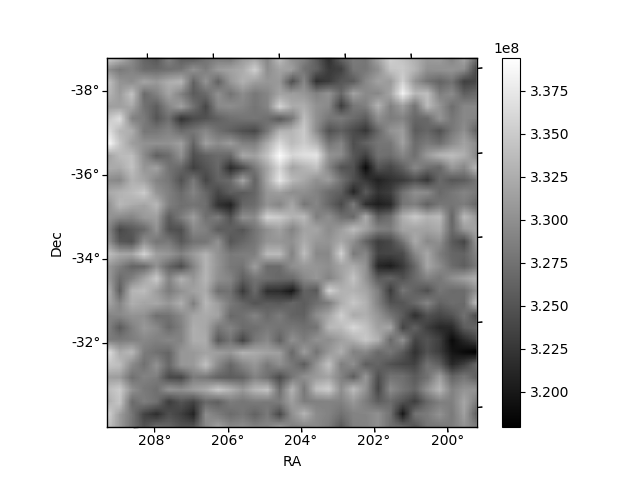
Quadrant B |
|---|---|---|---|
| Quadrant D | 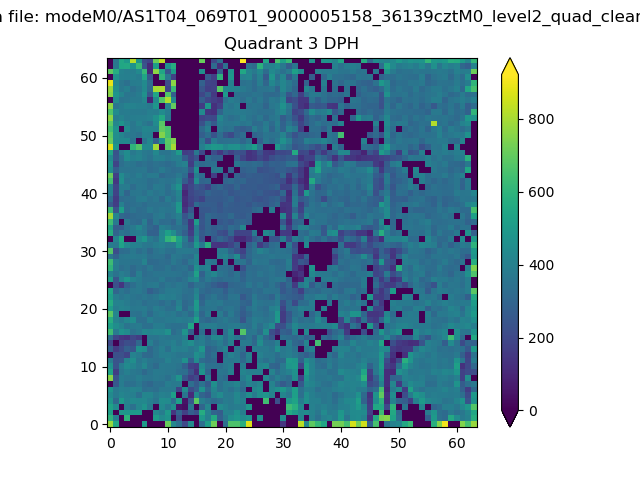 |
 |
Quadrant C |
| Plot type | Count rate plots | Images |
|---|---|---|
| Comparison with Poisson distribution Blue bars denote a histogram of data divided into 1 sec bins. Red curve is a Poisson curve with rate = median count rate of data. |
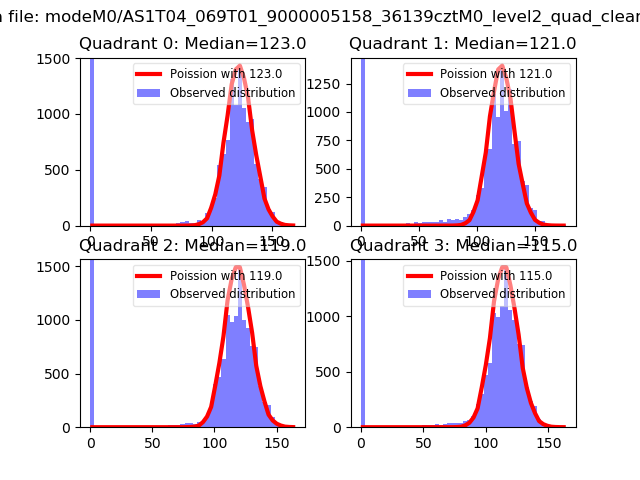 |
 |
| Quadrant-wise count rates Data is divided into 100 sec bins |
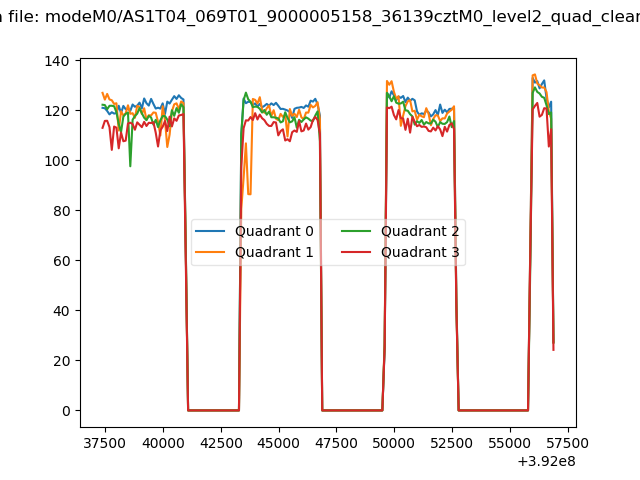 |
|
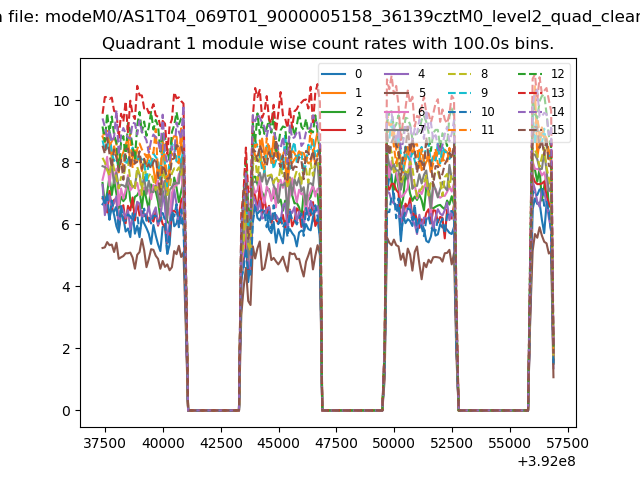
| Module-wise count rates for Quadrant A Data is divided into 100 sec bins |
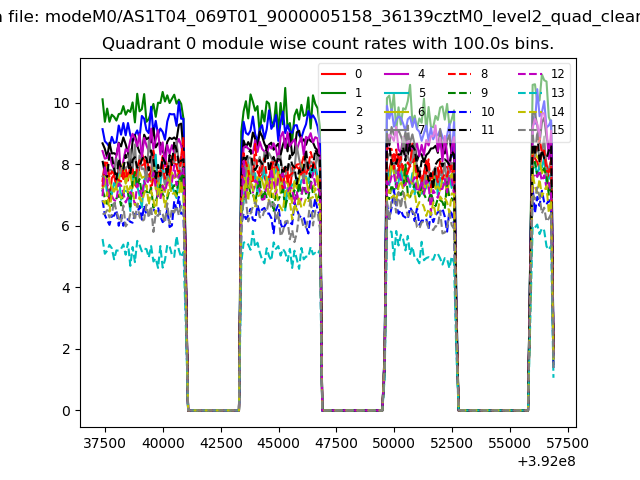 |
 |
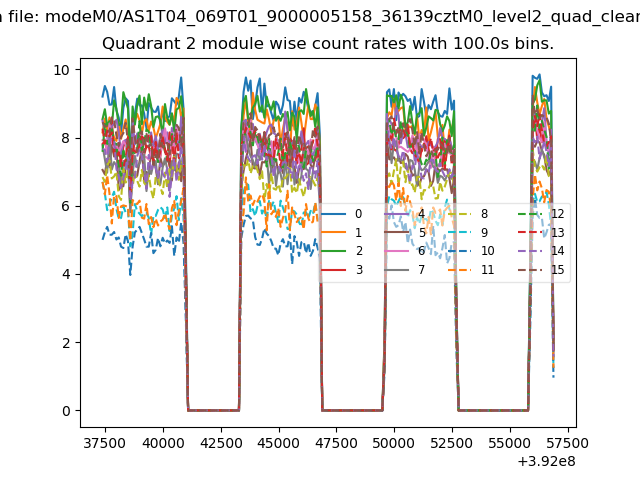
| Module-wise count rates for Quadrant B Data is divided into 100 sec bins |
 |
 |
| Module-wise count rates for Quadrant C Data is divided into 100 sec bins |
 |
 |
| Module-wise count rates for Quadrant D Data is divided into 100 sec bins |
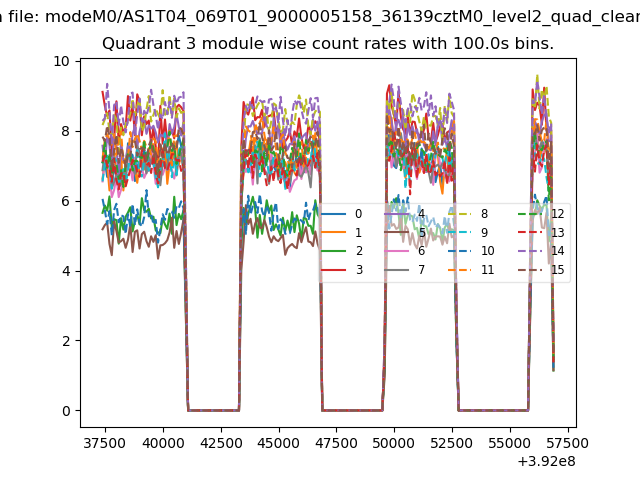 |
 |
| Parameter | Plot |
|---|---|
| CZT HV Monitor | 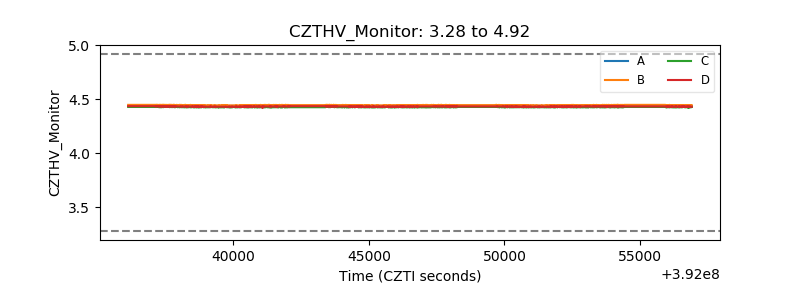 |
| D_VDD | 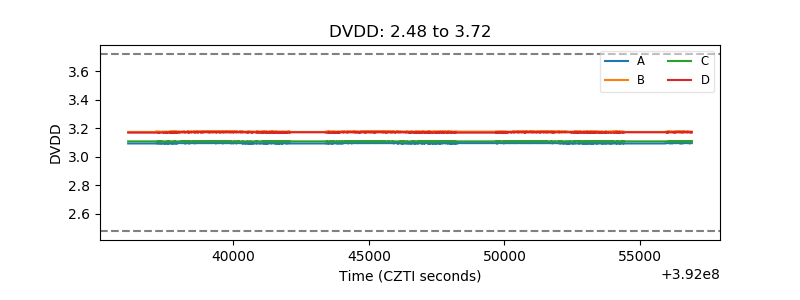 |
| Temperature 1 | 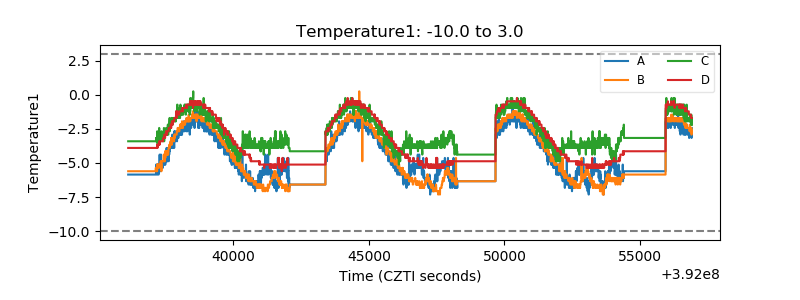 |
| Veto HV Monitor | 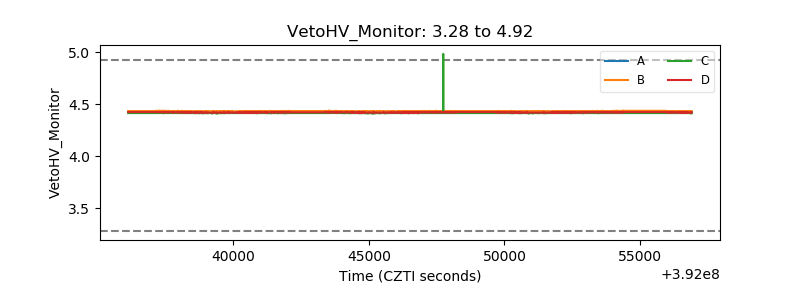 |
| Veto LLD | 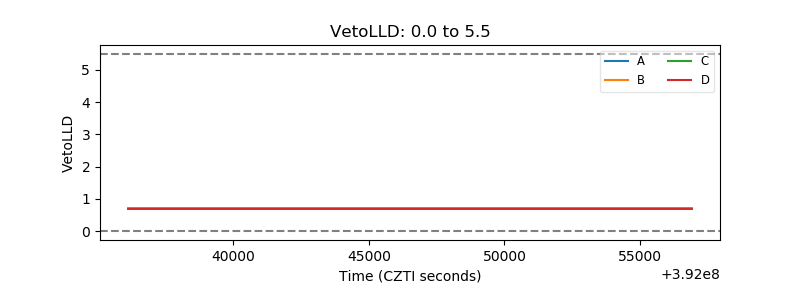 |
| Alpha Counter | 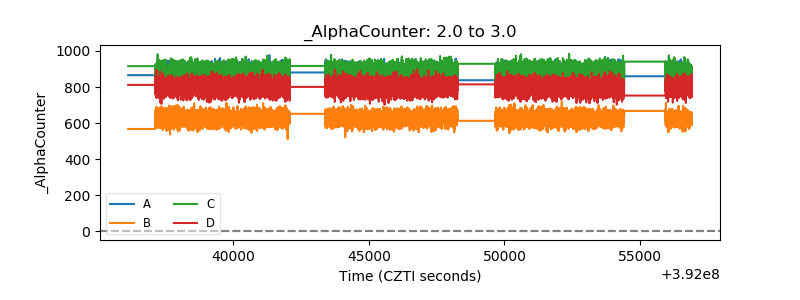 |
| _CPM_Rate | 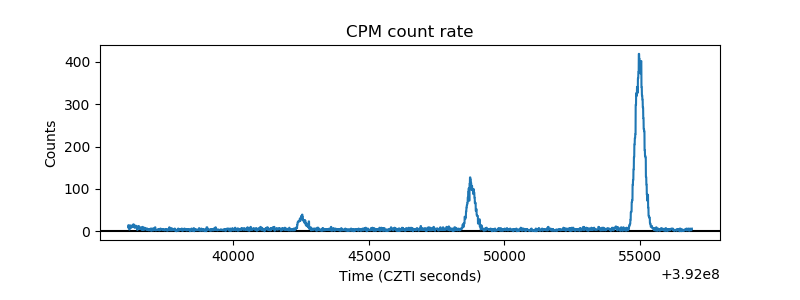 |
| CZT Counter | 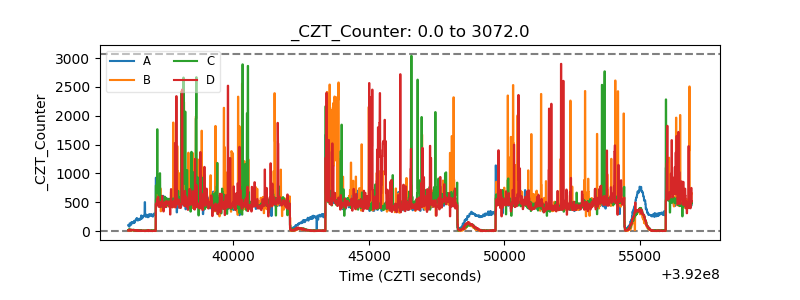 |
| +2.5 Volts monitor | 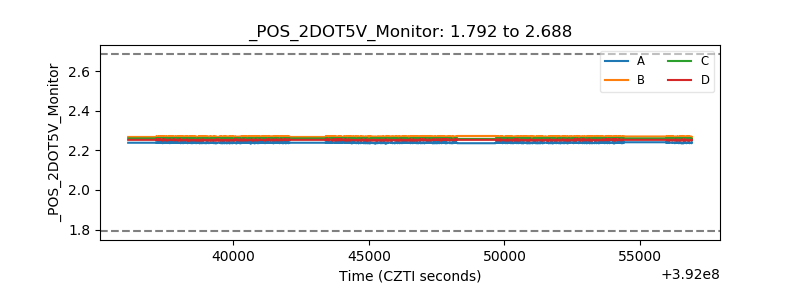 |
| +5 Volts monitor | 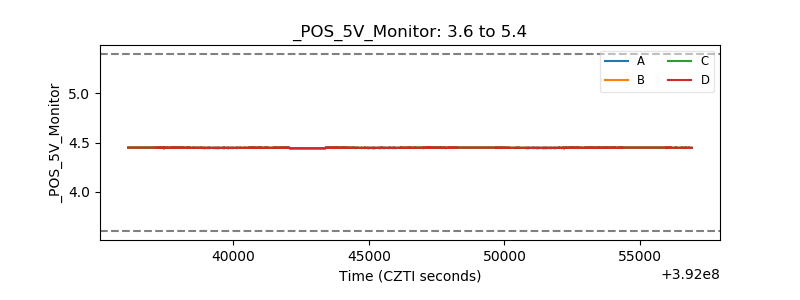 |
| _ROLL_ROT | 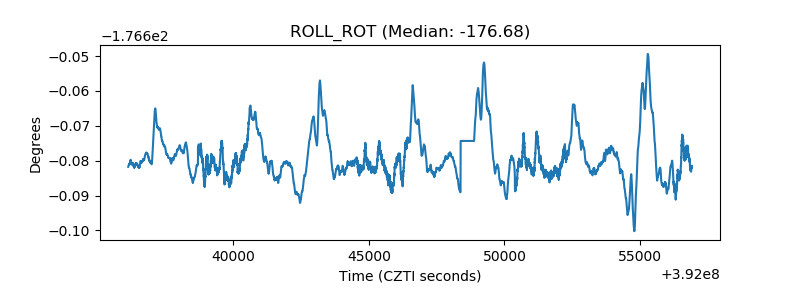 |
| _Roll_DEC | 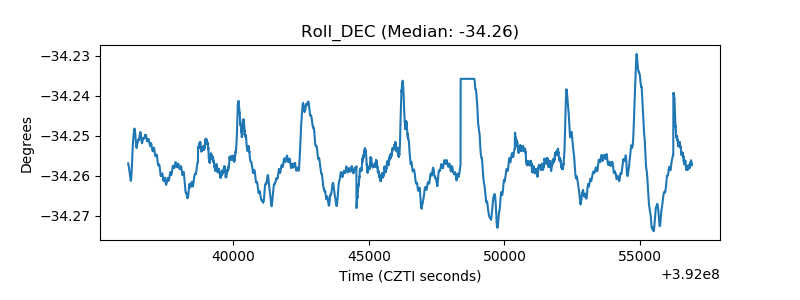 |
| _Roll_RA | 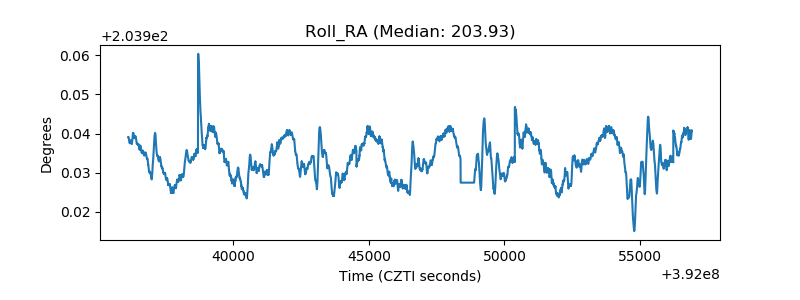 |
| Veto Counter | 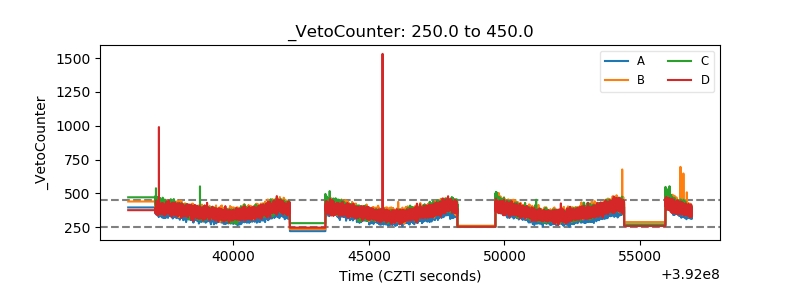 |