| Param | Original file | Final file |
|---|---|---|
| Filename | modeM0/AS1T04_069T01_9000005158_36130cztM0_level2.evt | modeM0/AS1T04_069T01_9000005158_36130cztM0_level2_quad_clean.evt |
| Size (bytes) | 445,746,240 | 60,796,800 |
| Size | 425.1 MB | 58.0 MB |
| Events in quadrant A | 2,664,293 | 384,643 |
| Events in quadrant B | 3,092,800 | 384,858 |
| Events in quadrant C | 3,041,255 | 371,118 |
| Events in quadrant D | 4,358,395 | 346,061 |
| Mode M0 | |||
|---|---|---|---|
| Quadrant | BADHDUFLAG | Total packets | Discarded packets |
| A | 0 | 10958 | 3 |
| B | 0 | 12283 | 2 |
| C | 0 | 11902 | 2 |
| D | 0 | 16294 | 2 |
| Mode M9 | |||
|---|---|---|---|
| Quadrant | BADHDUFLAG | Total packets | Discarded packets |
| A | 0 | 29 | 0 |
| B | 0 | 29 | 0 |
| C | 0 | 29 | 0 |
| D | 0 | 30 | 0 |
| Mode SS | |||
|---|---|---|---|
| Quadrant | BADHDUFLAG | Total packets | Discarded packets |
| A | 0 | 104 | 0 |
| B | 0 | 104 | 0 |
| C | 0 | 104 | 0 |
| D | 0 | 104 | 0 |
| Quadrant | Total seconds | Saturated seconds | Saturation percentage |
|---|---|---|---|
| A | 5043 | 6 | 0.118977% |
| B | 5043 | 182 | 3.608963% |
| C | 5043 | 132 | 2.617490% |
| D | 5043 | 467 | 9.260361% |
Noise dominated data is calculated using 1-second bins in cleaned event files. If a bin has >2000 counts, and if more than 50% of those come from <1% of pixels, then it is considered to be noise-dominated and hence unusable.
| Quadrant | # 1 sec bins | Bins with >0 counts | Bins with >2000 counts | High rate bins dominated by noise | Noise dominated (total time) | Noise dominated (detector-on time) | Marked lightcurve |
|---|---|---|---|---|---|---|---|
| A | 7105 | 5044 | 2 | 2 | 0.03% | 0.04% | 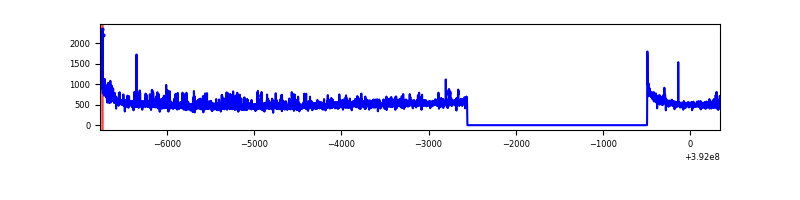 |
| B | 7105 | 5044 | 116 | 116 | 1.63% | 2.30% | 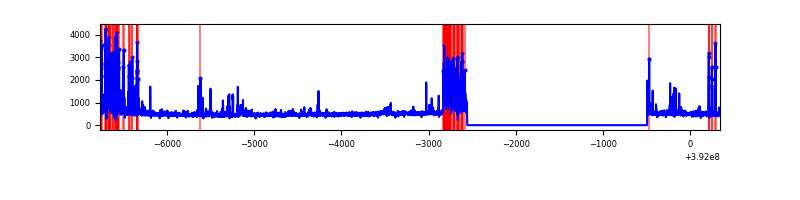 |
| C | 7105 | 5044 | 98 | 98 | 1.38% | 1.94% | 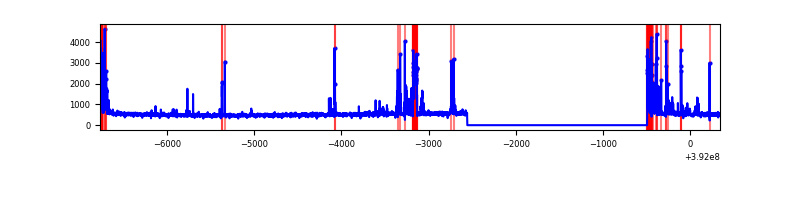 |
| D | 7105 | 5044 | 417 | 417 | 5.87% | 8.27% | 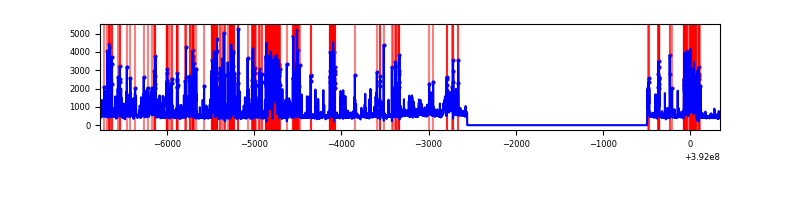 |
Top three noisy pixels from each quadrant. If the there are fewer than three noisy pixels in the level2.evt file, extra rows are filled as -1
| Pixel properties | Quadrant properties | ||||||
|---|---|---|---|---|---|---|---|
| Quadrant | DetID | PixID | Counts | Sigma | Mean | Median | Sigma |
| A | 10 | 83 | 166324 | 1337.76 | 614 | 603 | 123.9 |
| A | 15 | 223 | 98858 | 793.15 | 614 | 603 | 123.9 |
| A | 13 | 6 | 9408 | 71.08 | 614 | 603 | 123.9 |
| B | 5 | 172 | 544594 | 4727.13 | 609 | 594 | 115.1 |
| B | 5 | 255 | 63894 | 550.05 | 609 | 594 | 115.1 |
| B | 0 | 155 | 35393 | 302.39 | 609 | 594 | 115.1 |
| C | 0 | 207 | 280812 | 2011.84 | 594 | 600 | 139.3 |
| C | 15 | 214 | 213037 | 1525.24 | 594 | 600 | 139.3 |
| C | 0 | 10 | 193651 | 1386.05 | 594 | 600 | 139.3 |
| D | 12 | 17 | 684647 | 4851.88 | 568 | 554 | 141.0 |
| D | 12 | 6 | 615350 | 4360.4 | 568 | 554 | 141.0 |
| D | 1 | 52 | 314104 | 2223.83 | 568 | 554 | 141.0 |
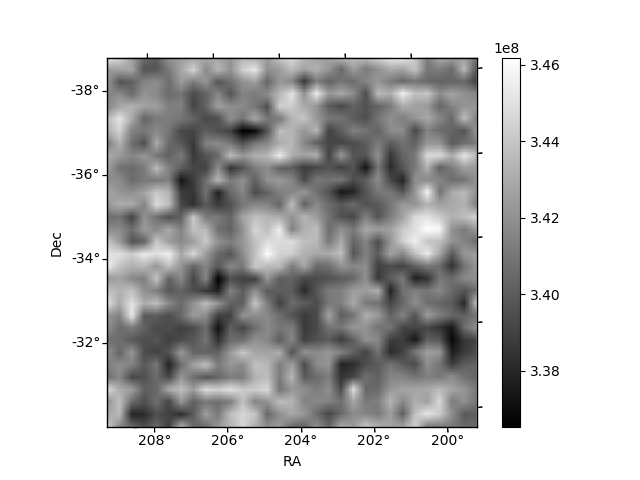
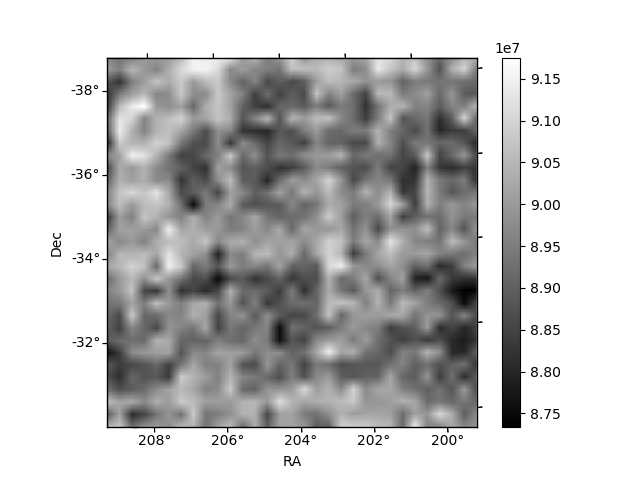
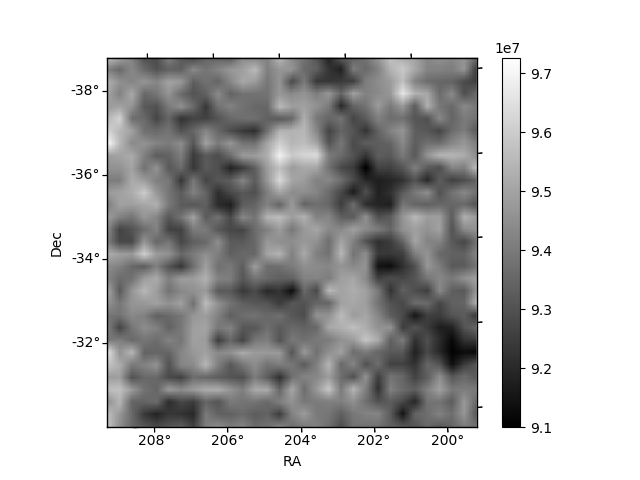
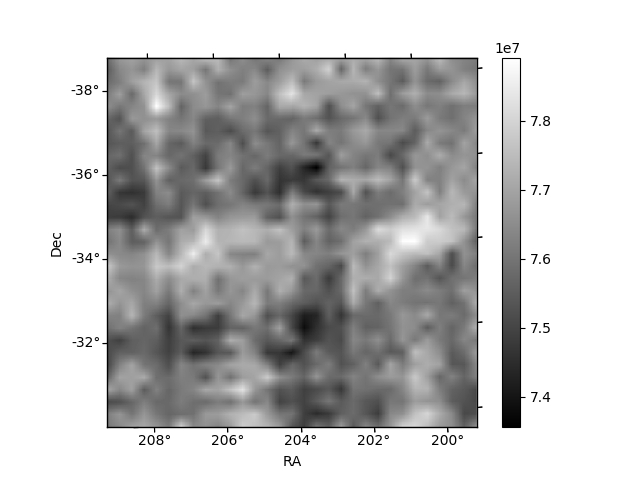
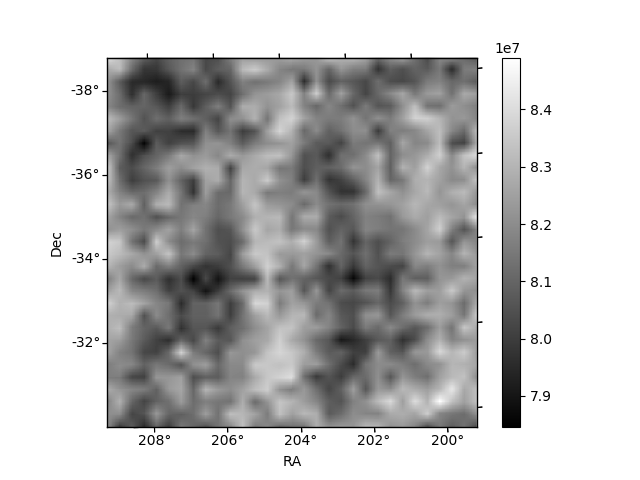
Histogram calculated using DETX and DETY for each event in the final _common_clean file
| Quadrant A | 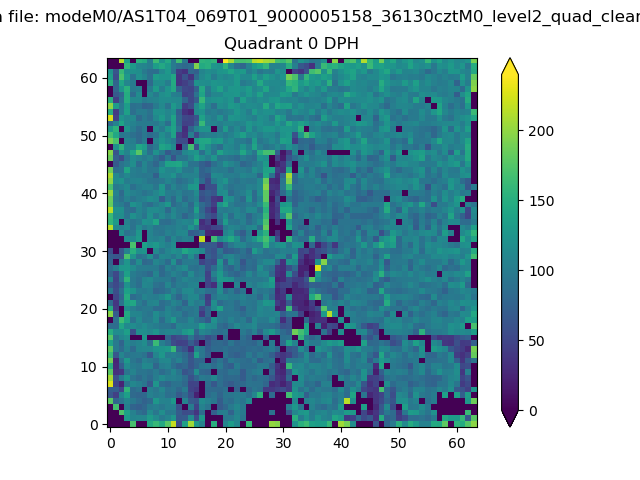 |
 |
Quadrant B |
|---|---|---|---|
| Quadrant D | 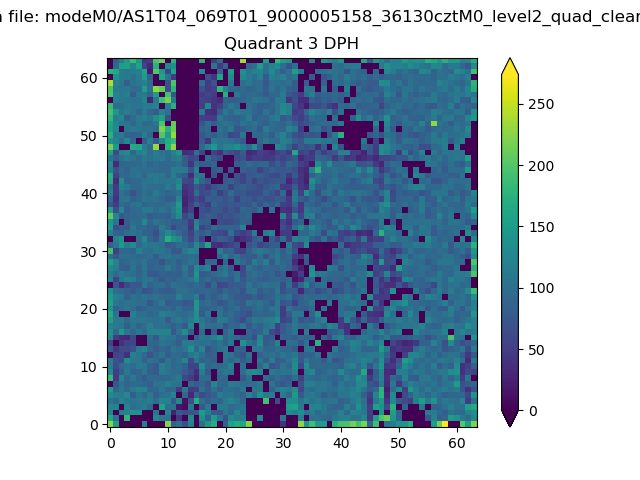 |
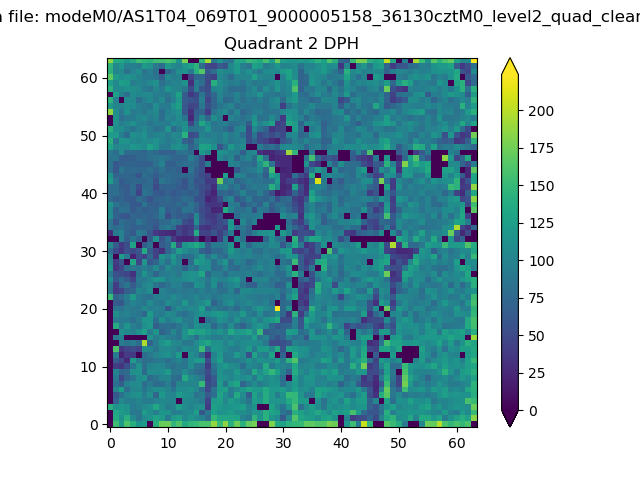 |
Quadrant C |
| Plot type | Count rate plots | Images |
|---|---|---|
| Comparison with Poisson distribution Blue bars denote a histogram of data divided into 1 sec bins. Red curve is a Poisson curve with rate = median count rate of data. |
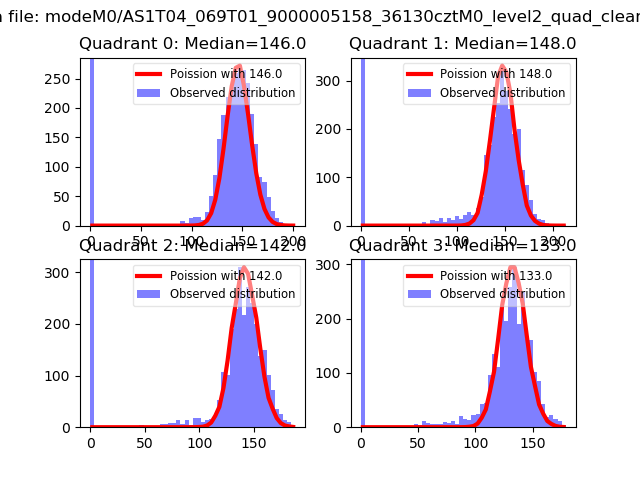 |
 |
| Quadrant-wise count rates Data is divided into 100 sec bins |
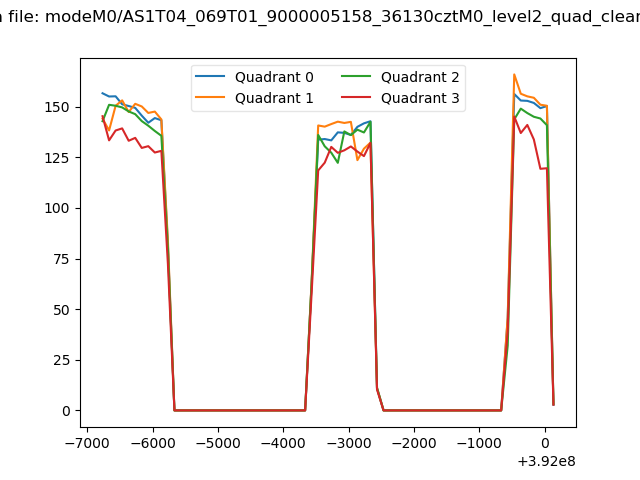 |
|
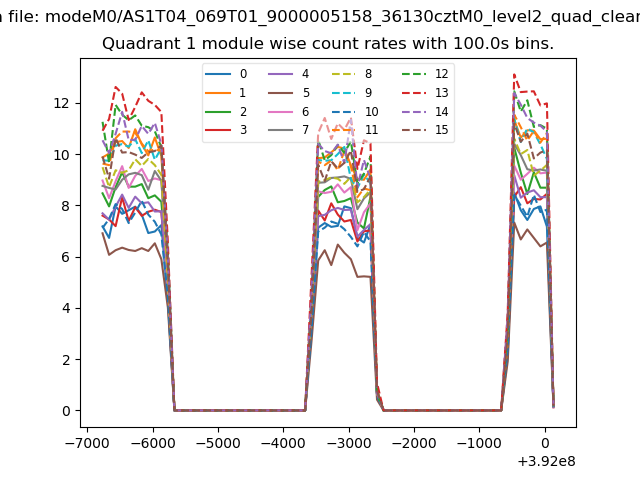
| Module-wise count rates for Quadrant A Data is divided into 100 sec bins |
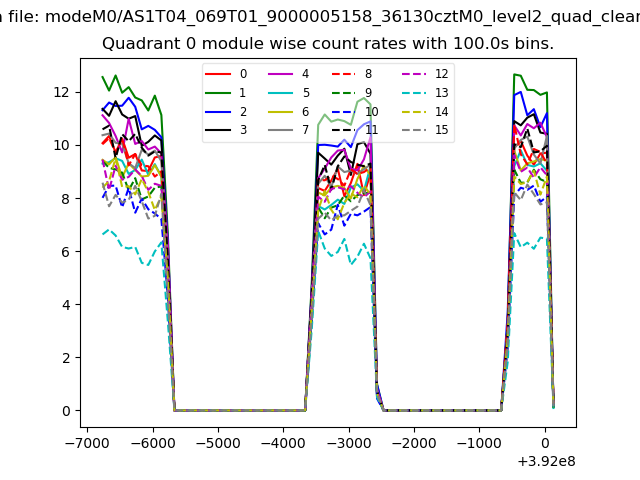 |
 |
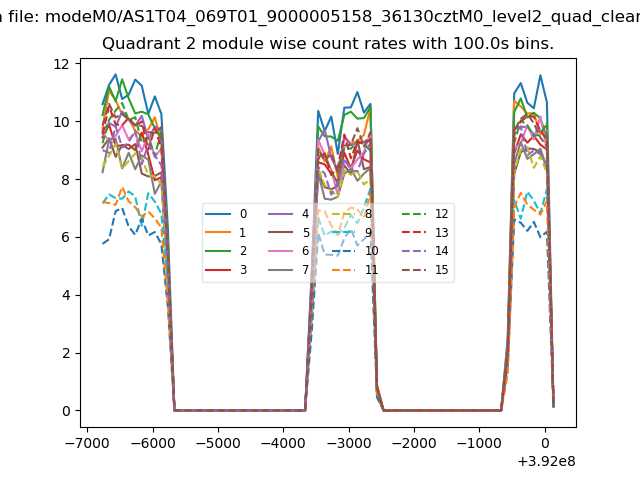
| Module-wise count rates for Quadrant B Data is divided into 100 sec bins |
 |
 |
| Module-wise count rates for Quadrant C Data is divided into 100 sec bins |
 |
 |
| Module-wise count rates for Quadrant D Data is divided into 100 sec bins |
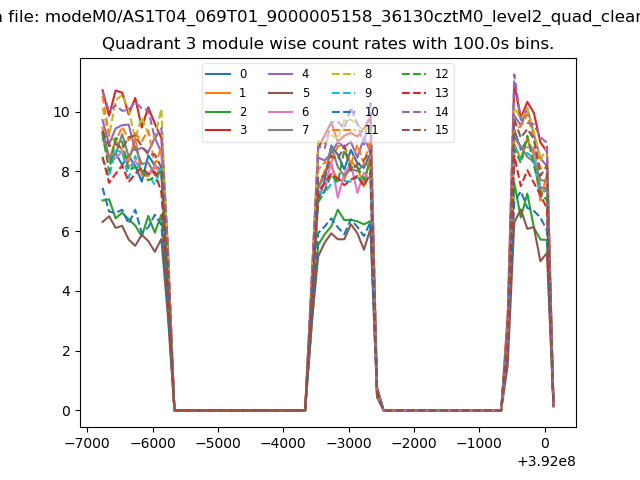 |
 |
| Parameter | Plot |
|---|---|
| CZT HV Monitor | 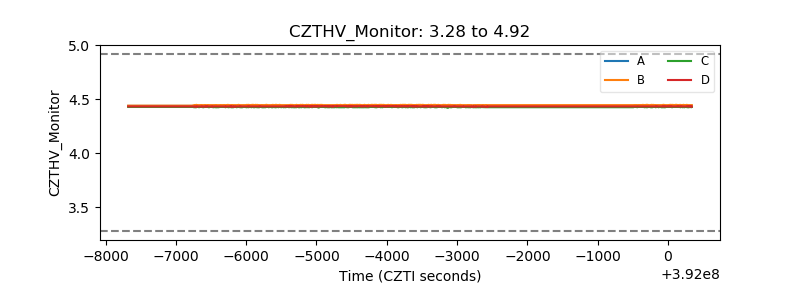 |
| D_VDD | 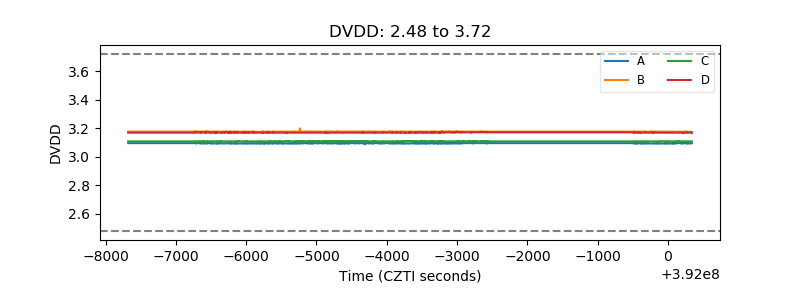 |
| Temperature 1 | 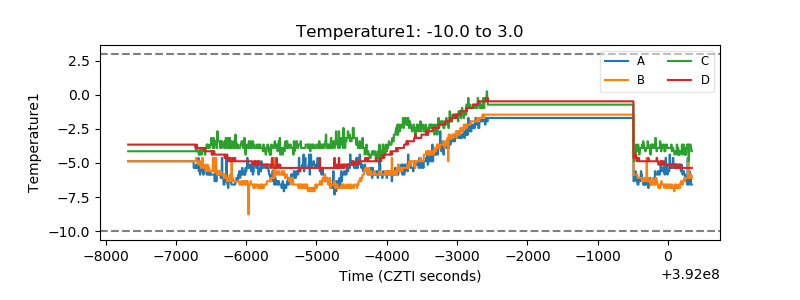 |
| Veto HV Monitor | 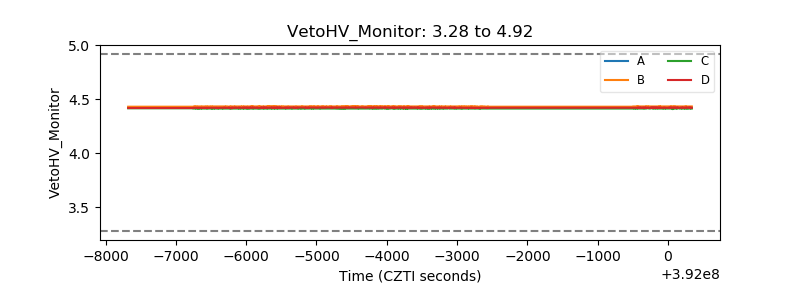 |
| Veto LLD | 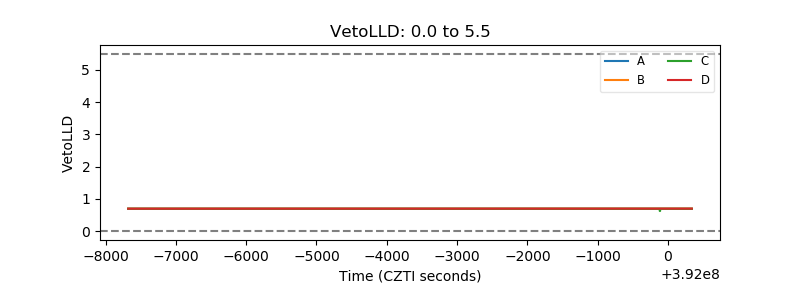 |
| Alpha Counter | 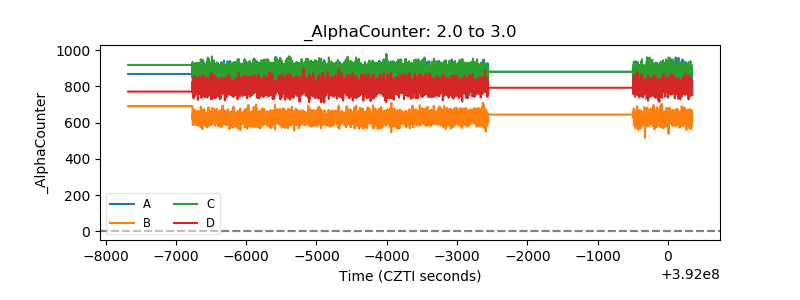 |
| _CPM_Rate | 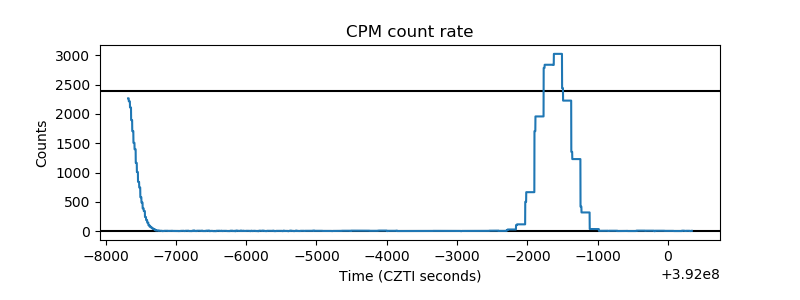 |
| CZT Counter | 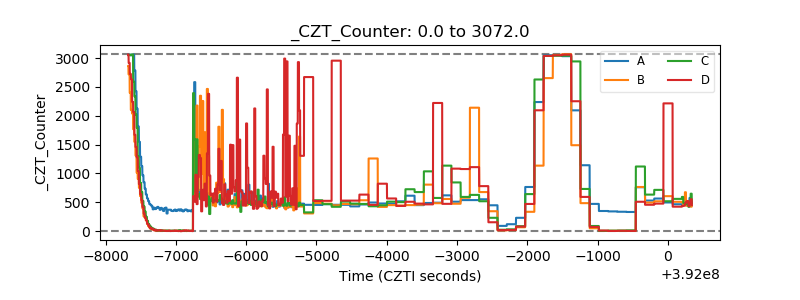 |
| +2.5 Volts monitor | 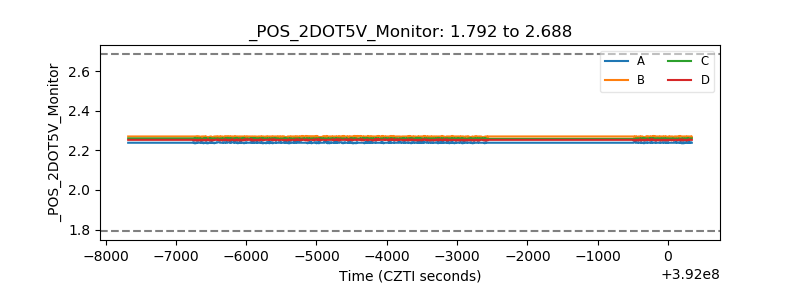 |
| +5 Volts monitor | 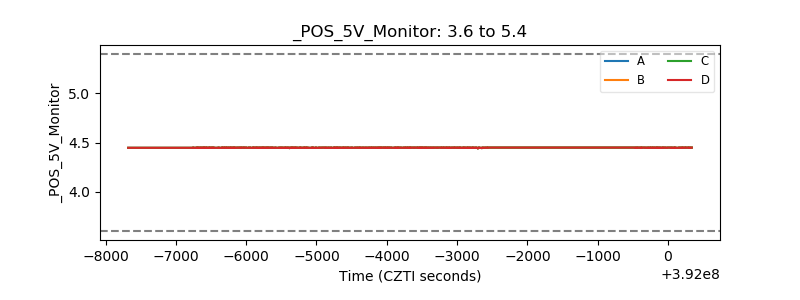 |
| _ROLL_ROT | 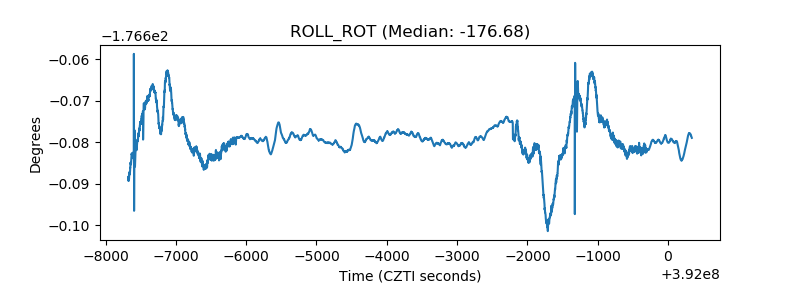 |
| _Roll_DEC | 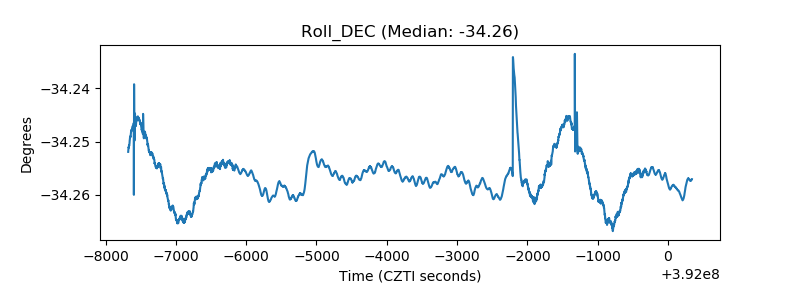 |
| _Roll_RA | 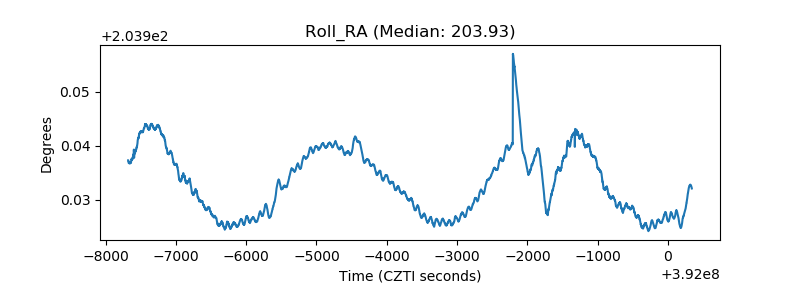 |
| Veto Counter | 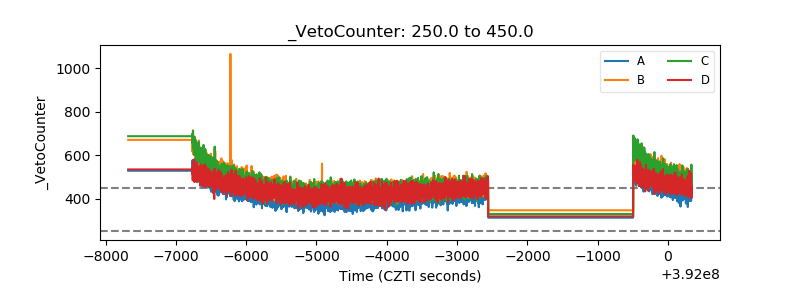 |