| Param | Original file | Final file |
|---|---|---|
| Filename | modeM0/AS1T04_069T01_9000005158_36128cztM0_level2.evt | modeM0/AS1T04_069T01_9000005158_36128cztM0_level2_quad_clean.evt |
| Size (bytes) | 434,707,200 | 64,604,160 |
| Size | 414.6 MB | 61.6 MB |
| Events in quadrant A | 2,738,785 | 412,711 |
| Events in quadrant B | 2,965,059 | 412,165 |
| Events in quadrant C | 2,874,708 | 394,135 |
| Events in quadrant D | 4,229,722 | 368,965 |
| Mode M0 | |||
|---|---|---|---|
| Quadrant | BADHDUFLAG | Total packets | Discarded packets |
| A | 0 | 11541 | 3 |
| B | 0 | 12224 | 2 |
| C | 0 | 11670 | 2 |
| D | 0 | 16055 | 2 |
| Mode M9 | |||
|---|---|---|---|
| Quadrant | BADHDUFLAG | Total packets | Discarded packets |
| A | 0 | 28 | 0 |
| B | 0 | 28 | 0 |
| C | 0 | 28 | 0 |
| D | 0 | 29 | 0 |
| Mode SS | |||
|---|---|---|---|
| Quadrant | BADHDUFLAG | Total packets | Discarded packets |
| A | 0 | 108 | 0 |
| B | 0 | 108 | 0 |
| C | 0 | 108 | 0 |
| D | 0 | 108 | 0 |
| Quadrant | Total seconds | Saturated seconds | Saturation percentage |
|---|---|---|---|
| A | 5251 | 13 | 0.247572% |
| B | 5251 | 100 | 1.904399% |
| C | 5251 | 83 | 1.580651% |
| D | 5251 | 391 | 7.446201% |
Noise dominated data is calculated using 1-second bins in cleaned event files. If a bin has >2000 counts, and if more than 50% of those come from <1% of pixels, then it is considered to be noise-dominated and hence unusable.
| Quadrant | # 1 sec bins | Bins with >0 counts | Bins with >2000 counts | High rate bins dominated by noise | Noise dominated (total time) | Noise dominated (detector-on time) | Marked lightcurve |
|---|---|---|---|---|---|---|---|
| A | 7074 | 5252 | 1 | 1 | 0.01% | 0.02% | 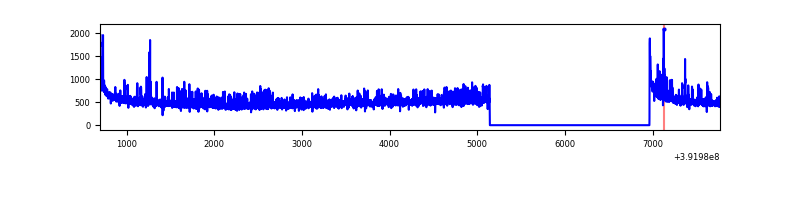 |
| B | 7074 | 5252 | 63 | 63 | 0.89% | 1.20% | 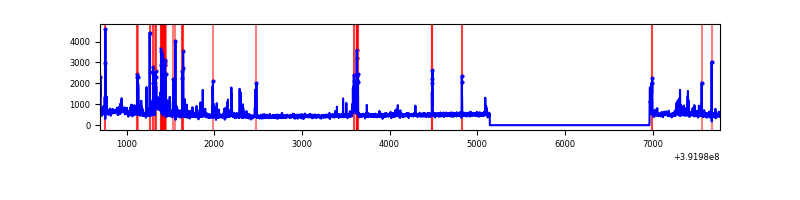 |
| C | 7074 | 5252 | 71 | 71 | 1.00% | 1.35% | 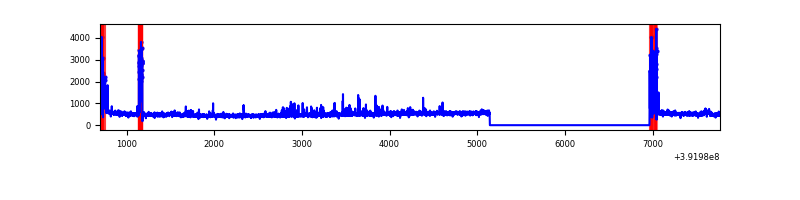 |
| D | 7074 | 5252 | 327 | 327 | 4.62% | 6.23% | 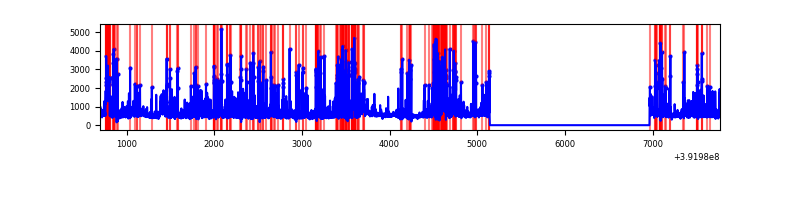 |
Top three noisy pixels from each quadrant. If the there are fewer than three noisy pixels in the level2.evt file, extra rows are filled as -1
| Pixel properties | Quadrant properties | ||||||
|---|---|---|---|---|---|---|---|
| Quadrant | DetID | PixID | Counts | Sigma | Mean | Median | Sigma |
| A | 10 | 83 | 176346 | 1407.93 | 613 | 602 | 124.8 |
| A | 15 | 223 | 144910 | 1156.09 | 613 | 602 | 124.8 |
| A | 9 | 143 | 23986 | 187.34 | 613 | 602 | 124.8 |
| B | 5 | 172 | 371988 | 3120.08 | 609 | 592 | 119.0 |
| B | 0 | 229 | 58415 | 485.77 | 609 | 592 | 119.0 |
| B | 5 | 255 | 35849 | 296.19 | 609 | 592 | 119.0 |
| C | 15 | 214 | 223264 | 1603.95 | 588 | 594 | 138.8 |
| C | 0 | 10 | 166413 | 1194.44 | 588 | 594 | 138.8 |
| C | 10 | 49 | 89079 | 637.38 | 588 | 594 | 138.8 |
| D | 12 | 17 | 811164 | 5845.06 | 565 | 550 | 138.7 |
| D | 1 | 52 | 338879 | 2439.58 | 565 | 550 | 138.7 |
| D | 12 | 6 | 326042 | 2347.01 | 565 | 550 | 138.7 |
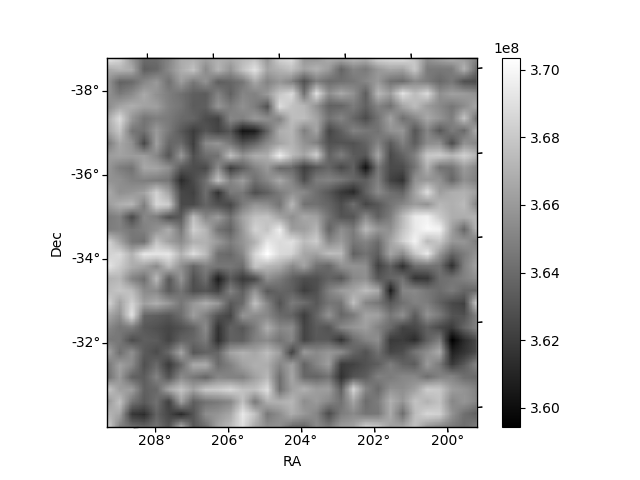
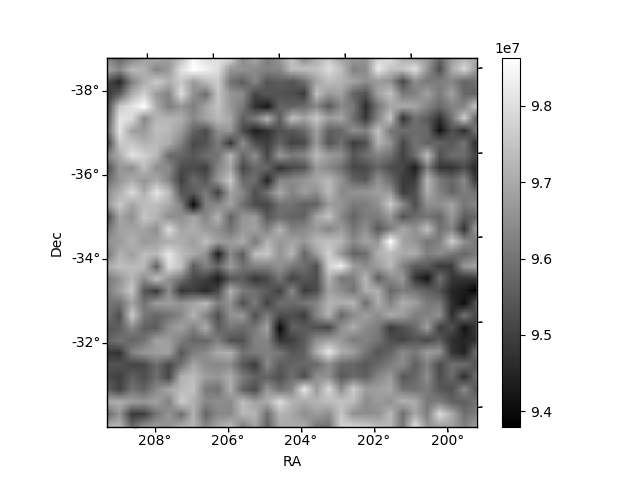
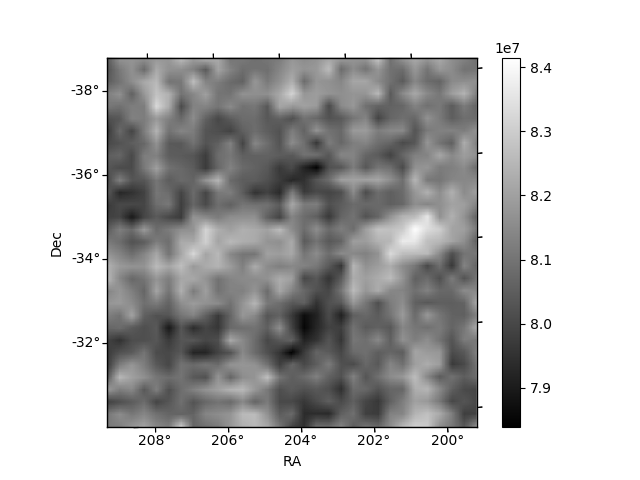
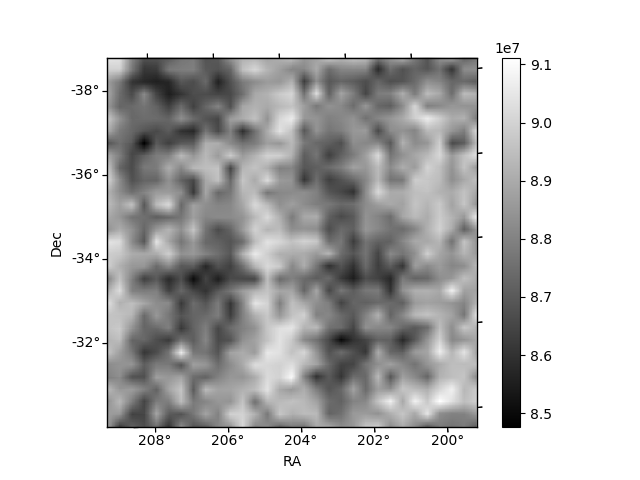
Histogram calculated using DETX and DETY for each event in the final _common_clean file
| Quadrant A | 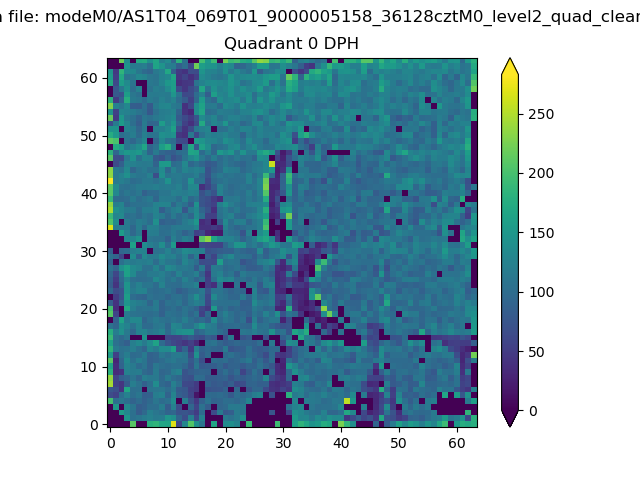 |
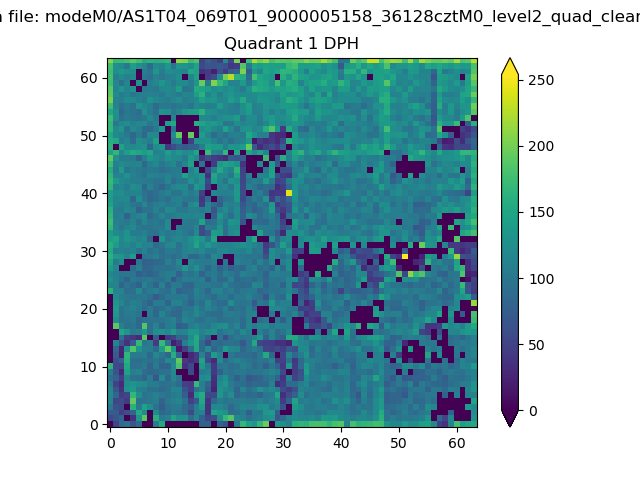 |
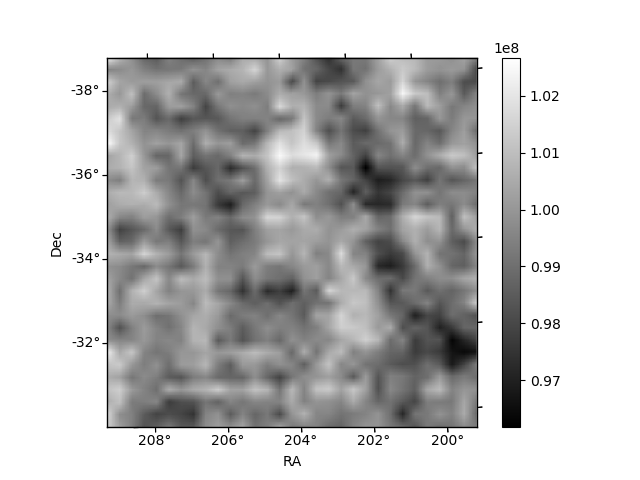
Quadrant B |
|---|---|---|---|
| Quadrant D | 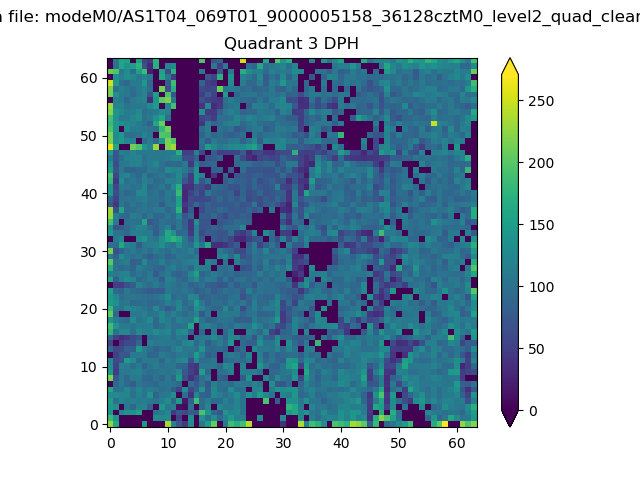 |
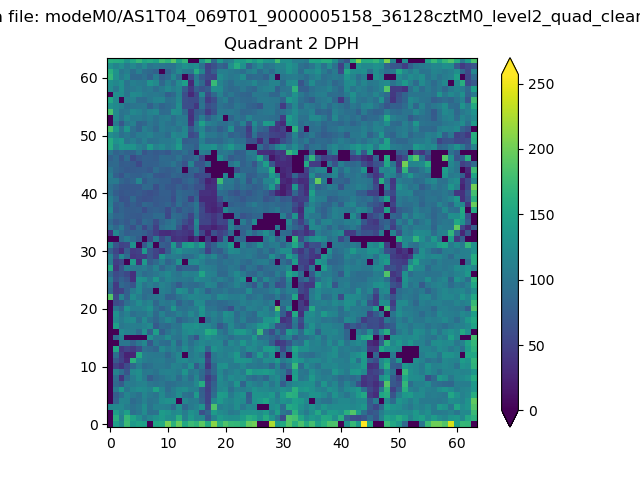 |
Quadrant C |
| Plot type | Count rate plots | Images |
|---|---|---|
| Comparison with Poisson distribution Blue bars denote a histogram of data divided into 1 sec bins. Red curve is a Poisson curve with rate = median count rate of data. |
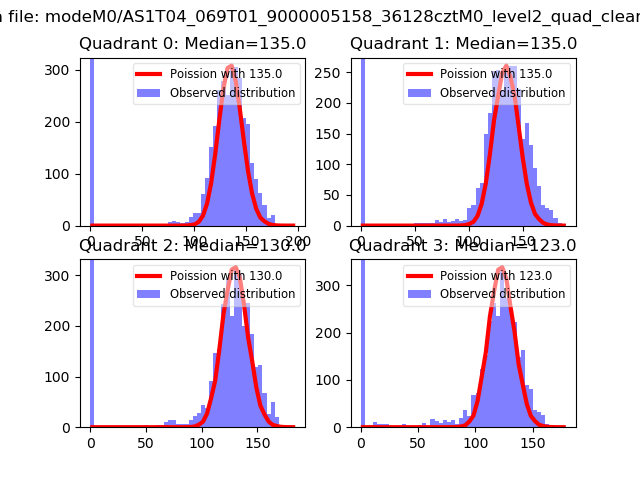 |
 |
| Quadrant-wise count rates Data is divided into 100 sec bins |
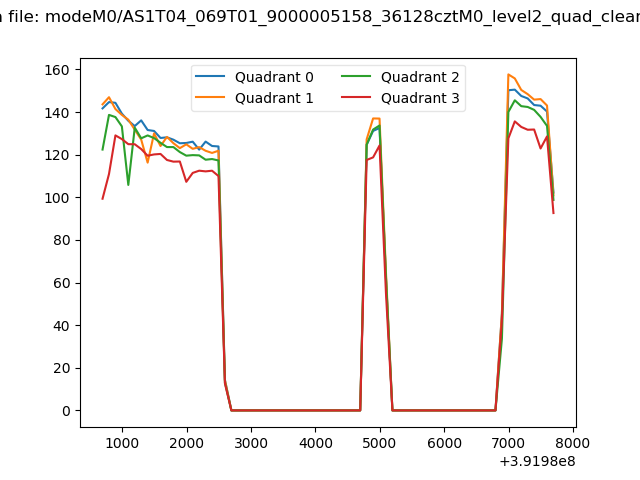 |
|
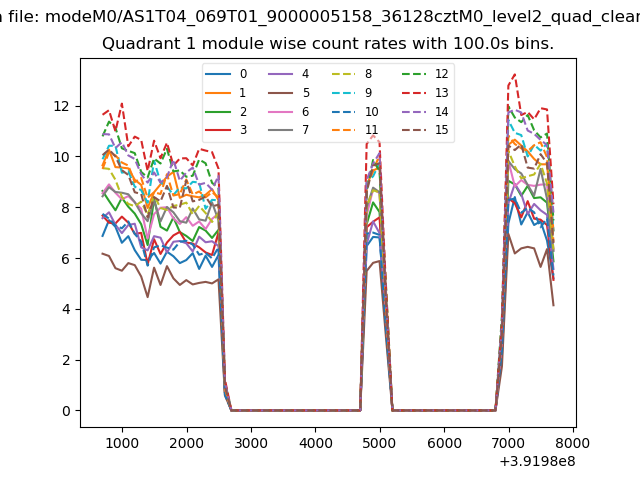
| Module-wise count rates for Quadrant A Data is divided into 100 sec bins |
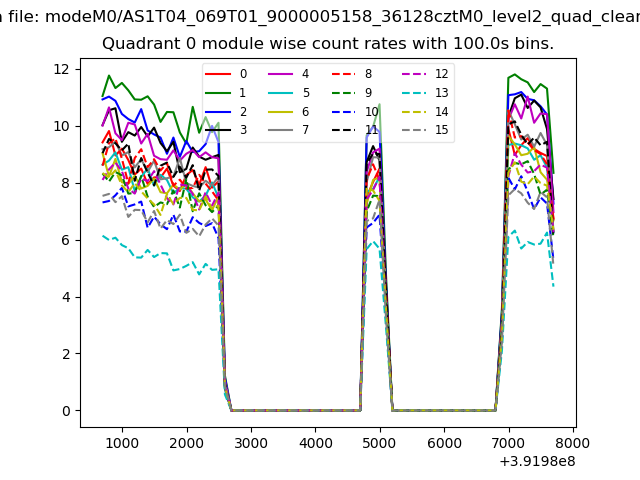 |
 |
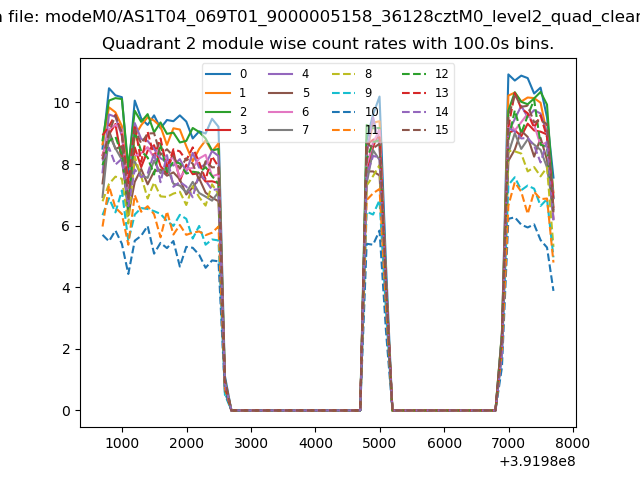
| Module-wise count rates for Quadrant B Data is divided into 100 sec bins |
 |
 |
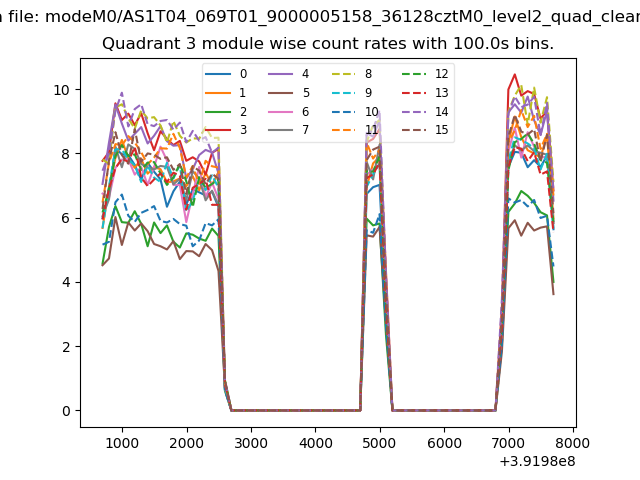
| Module-wise count rates for Quadrant C Data is divided into 100 sec bins |
 |
 |
| Module-wise count rates for Quadrant D Data is divided into 100 sec bins |
 |
 |
| Parameter | Plot |
|---|---|
| CZT HV Monitor | 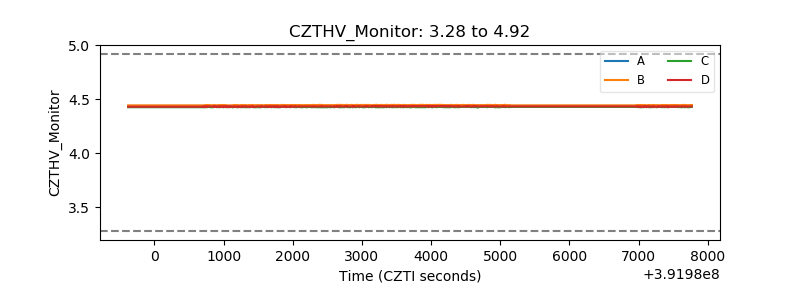 |
| D_VDD | 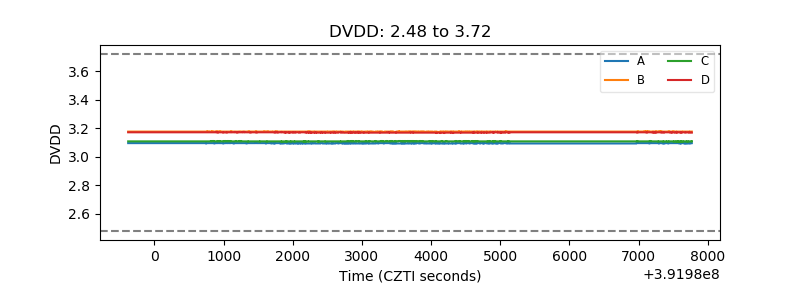 |
| Temperature 1 | 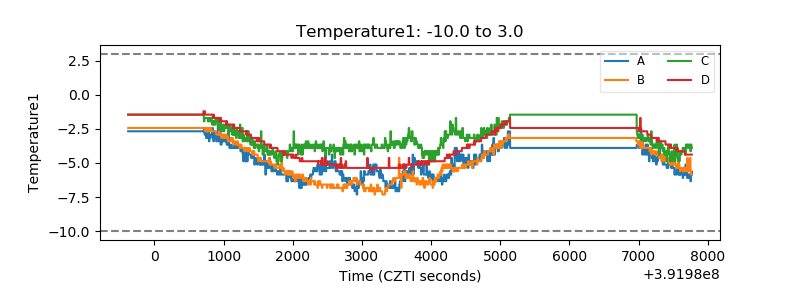 |
| Veto HV Monitor | 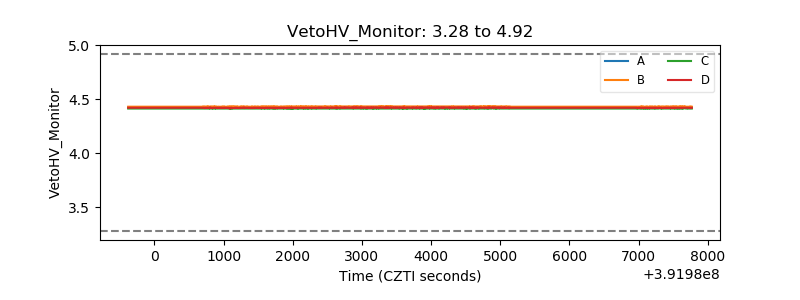 |
| Veto LLD | 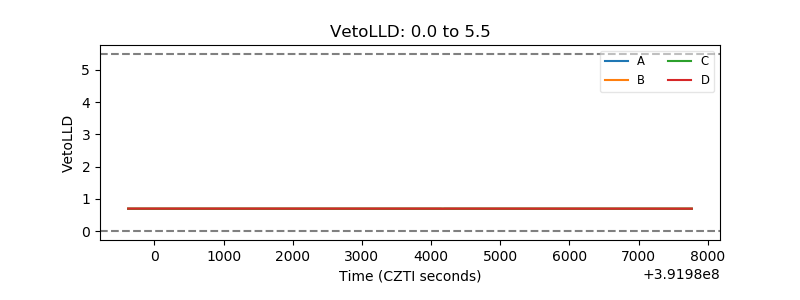 |
| Alpha Counter | 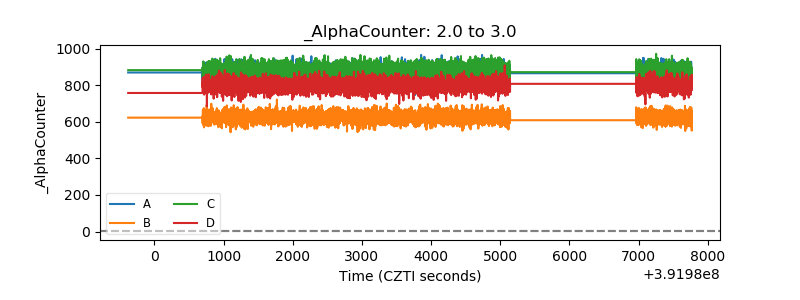 |
| _CPM_Rate | 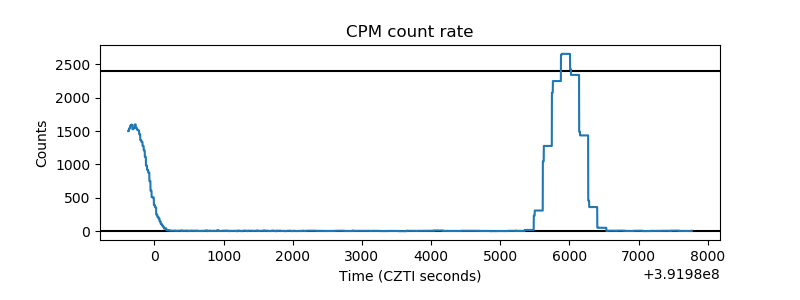 |
| CZT Counter | 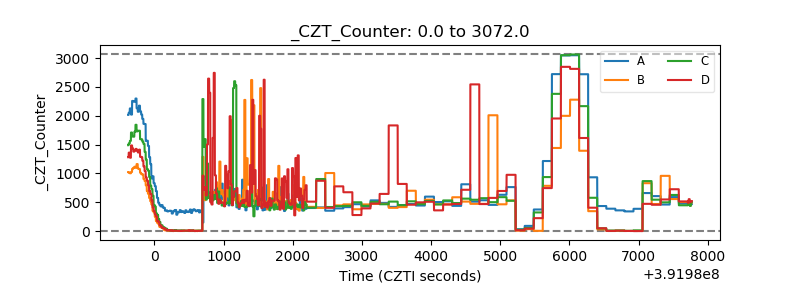 |
| +2.5 Volts monitor | 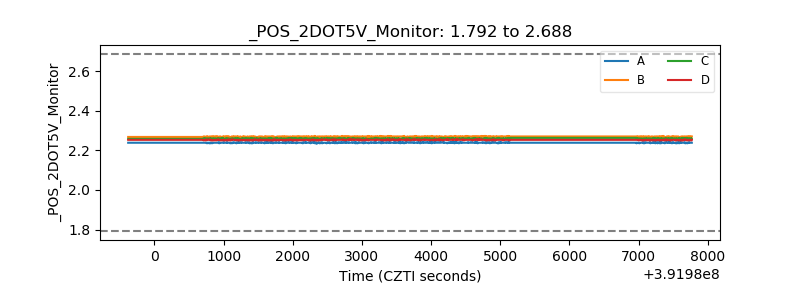 |
| +5 Volts monitor | 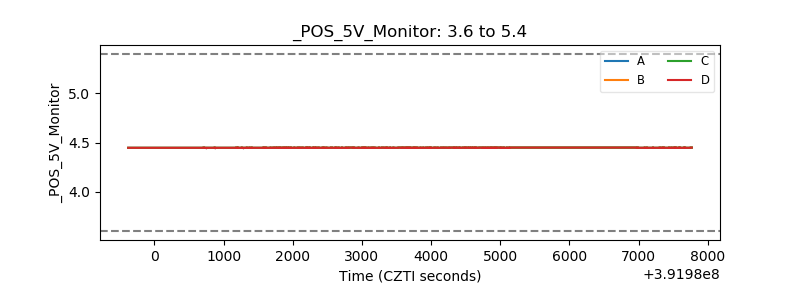 |
| _ROLL_ROT | 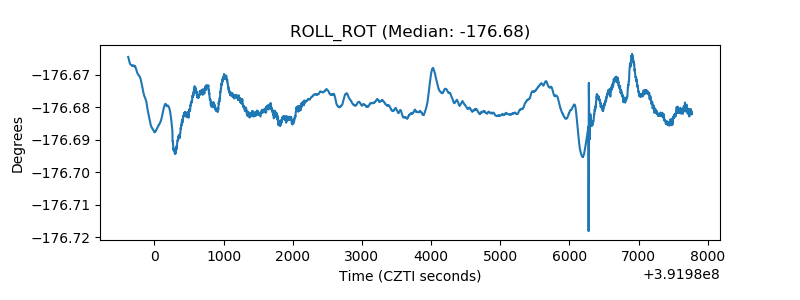 |
| _Roll_DEC | 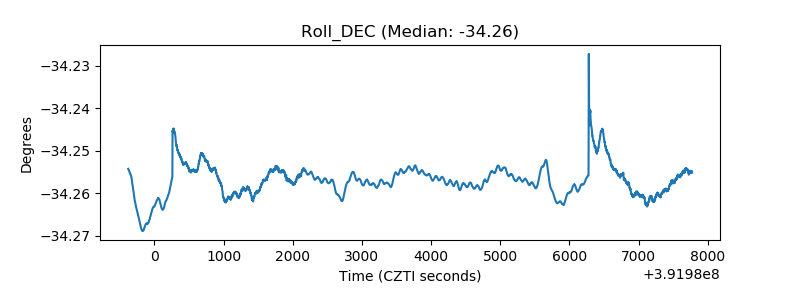 |
| _Roll_RA | 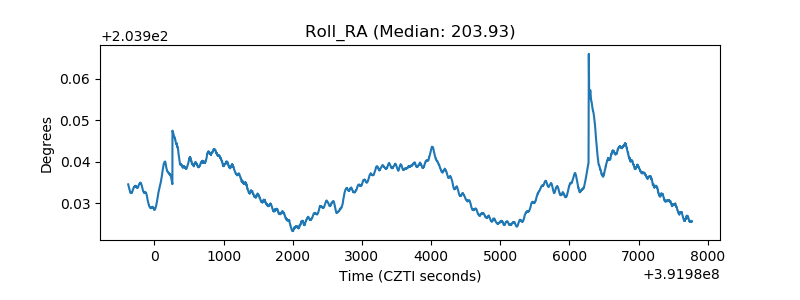 |
| Veto Counter | 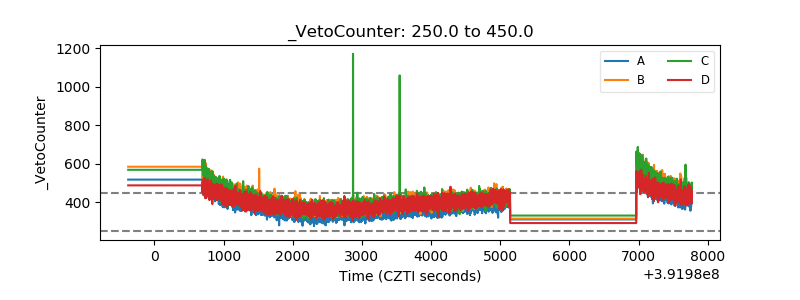 |