| Param | Original file | Final file |
|---|---|---|
| Filename | modeM0/AS1T04_069T01_9000005158_36126cztM0_level2.evt | modeM0/AS1T04_069T01_9000005158_36126cztM0_level2_quad_clean.evt |
| Size (bytes) | 490,118,400 | 63,296,640 |
| Size | 467.4 MB | 60.4 MB |
| Events in quadrant A | 2,744,580 | 408,552 |
| Events in quadrant B | 3,536,256 | 390,228 |
| Events in quadrant C | 3,020,516 | 388,388 |
| Events in quadrant D | 5,177,246 | 352,674 |
| Mode M0 | |||
|---|---|---|---|
| Quadrant | BADHDUFLAG | Total packets | Discarded packets |
| A | 0 | 11662 | 3 |
| B | 0 | 14066 | 2 |
| C | 0 | 12300 | 2 |
| D | 0 | 19010 | 2 |
| Mode M9 | |||
|---|---|---|---|
| Quadrant | BADHDUFLAG | Total packets | Discarded packets |
| A | 0 | 28 | 0 |
| B | 0 | 28 | 0 |
| C | 0 | 28 | 0 |
| D | 0 | 29 | 0 |
| Mode SS | |||
|---|---|---|---|
| Quadrant | BADHDUFLAG | Total packets | Discarded packets |
| A | 0 | 110 | 0 |
| B | 0 | 110 | 0 |
| C | 0 | 110 | 0 |
| D | 0 | 110 | 0 |
| Quadrant | Total seconds | Saturated seconds | Saturation percentage |
|---|---|---|---|
| A | 5372 | 18 | 0.335071% |
| B | 5372 | 283 | 5.268057% |
| C | 5372 | 68 | 1.265823% |
| D | 5372 | 711 | 13.235294% |
Noise dominated data is calculated using 1-second bins in cleaned event files. If a bin has >2000 counts, and if more than 50% of those come from <1% of pixels, then it is considered to be noise-dominated and hence unusable.
| Quadrant | # 1 sec bins | Bins with >0 counts | Bins with >2000 counts | High rate bins dominated by noise | Noise dominated (total time) | Noise dominated (detector-on time) | Marked lightcurve |
|---|---|---|---|---|---|---|---|
| A | 7045 | 5373 | 2 | 2 | 0.03% | 0.04% | 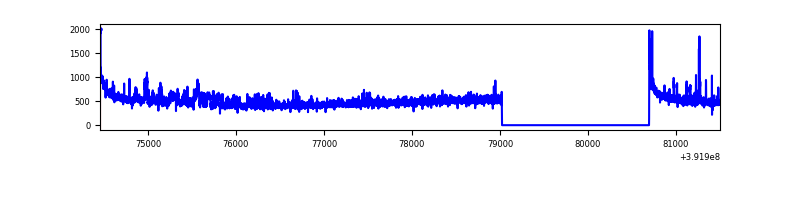 |
| B | 7045 | 5373 | 209 | 209 | 2.97% | 3.89% | 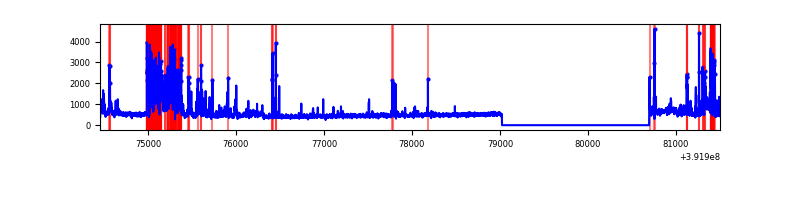 |
| C | 7045 | 5373 | 65 | 65 | 0.92% | 1.21% | 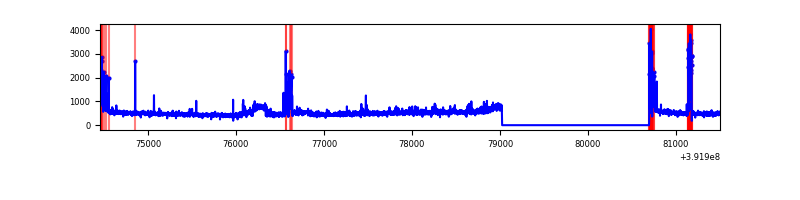 |
| D | 7045 | 5373 | 626 | 626 | 8.89% | 11.65% | 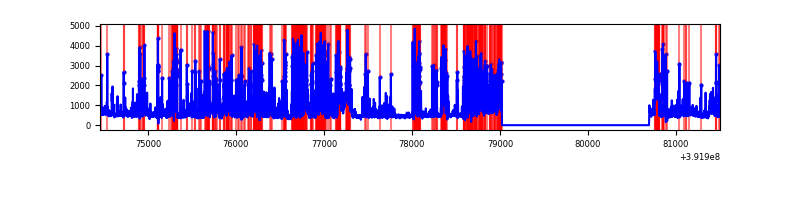 |
Top three noisy pixels from each quadrant. If the there are fewer than three noisy pixels in the level2.evt file, extra rows are filled as -1
| Pixel properties | Quadrant properties | ||||||
|---|---|---|---|---|---|---|---|
| Quadrant | DetID | PixID | Counts | Sigma | Mean | Median | Sigma |
| A | 10 | 83 | 181714 | 1430.55 | 619 | 605 | 126.6 |
| A | 15 | 223 | 123863 | 973.6 | 619 | 605 | 126.6 |
| A | 8 | 144 | 26193 | 202.11 | 619 | 605 | 126.6 |
| B | 5 | 172 | 910528 | 7777.4 | 602 | 586 | 117.0 |
| B | 0 | 229 | 87176 | 740.1 | 602 | 586 | 117.0 |
| B | 0 | 190 | 69604 | 589.91 | 602 | 586 | 117.0 |
| C | 15 | 214 | 228216 | 1640.79 | 592 | 595 | 138.7 |
| C | 9 | 187 | 153630 | 1103.14 | 592 | 595 | 138.7 |
| C | 0 | 10 | 145721 | 1046.13 | 592 | 595 | 138.7 |
| D | 12 | 17 | 1232153 | 8994.46 | 555 | 539 | 136.9 |
| D | 1 | 52 | 563400 | 4110.57 | 555 | 539 | 136.9 |
| D | 2 | 249 | 478077 | 3487.45 | 555 | 539 | 136.9 |
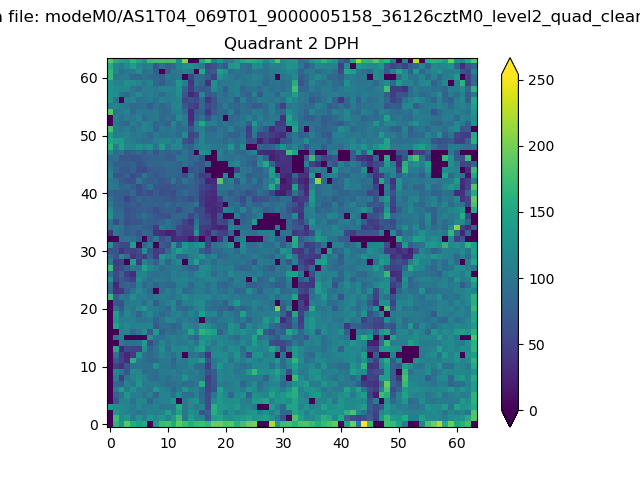
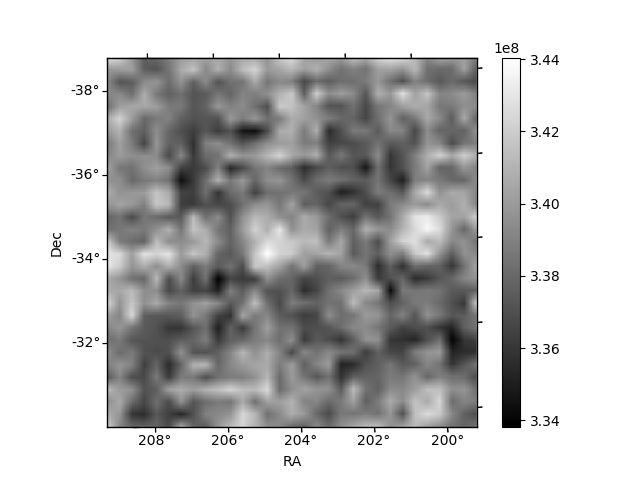
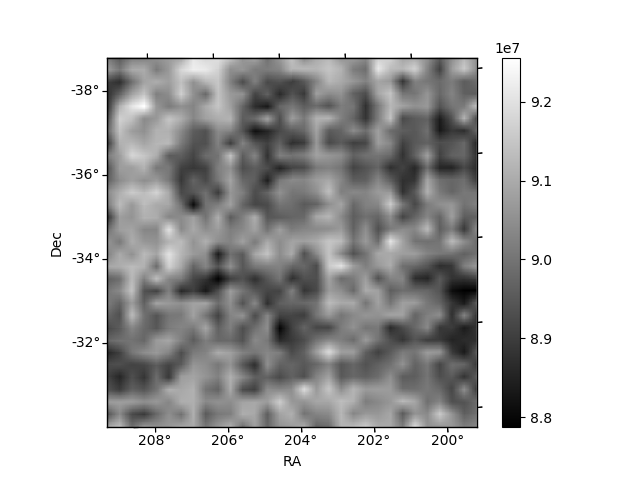
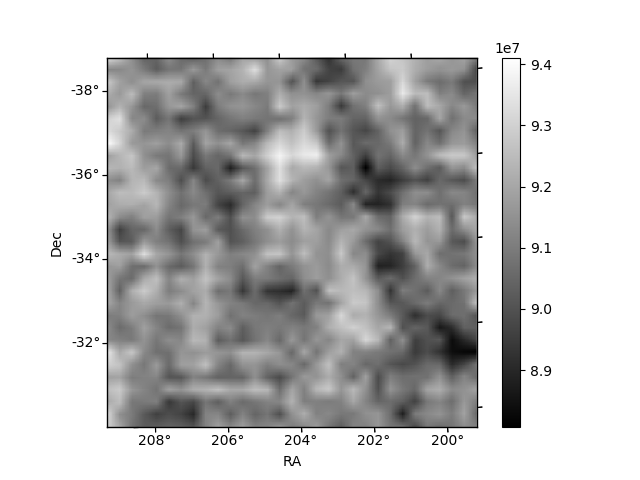
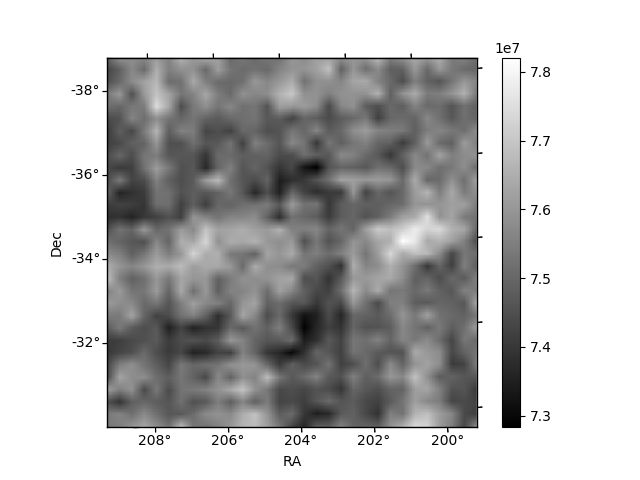
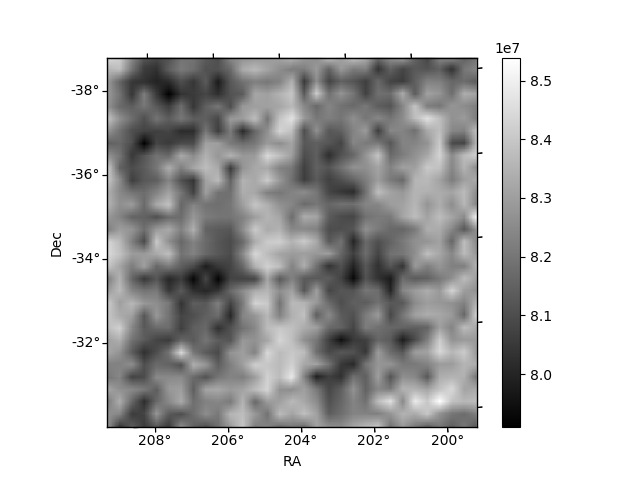
Histogram calculated using DETX and DETY for each event in the final _common_clean file
| Quadrant A | 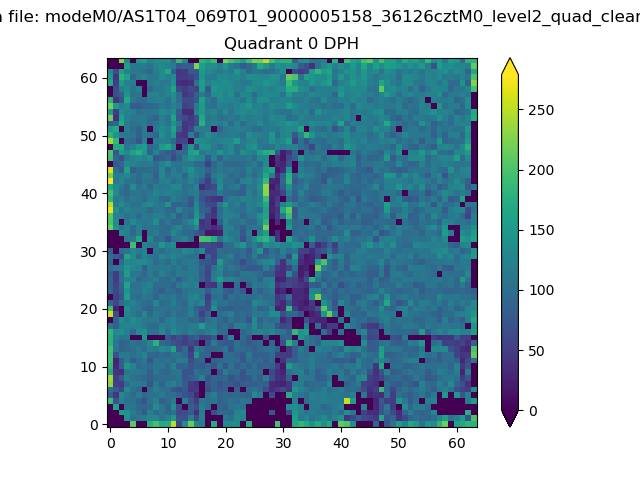 |
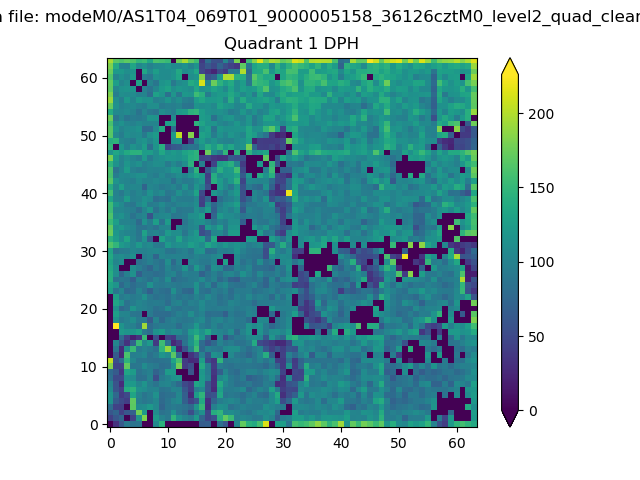 |
Quadrant B |
|---|---|---|---|
| Quadrant D | 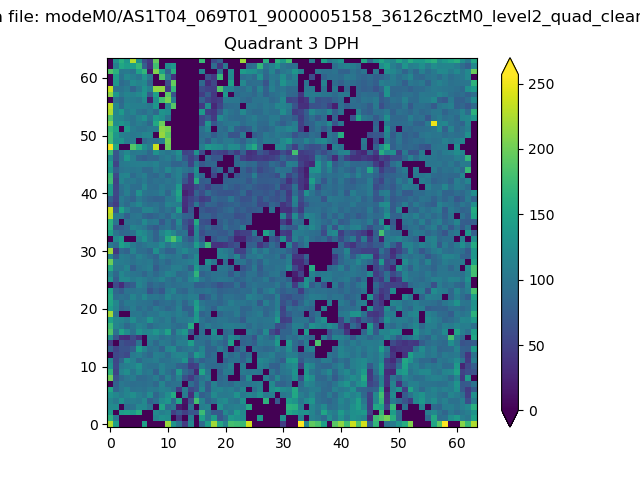 |
 |
Quadrant C |
| Plot type | Count rate plots | Images |
|---|---|---|
| Comparison with Poisson distribution Blue bars denote a histogram of data divided into 1 sec bins. Red curve is a Poisson curve with rate = median count rate of data. |
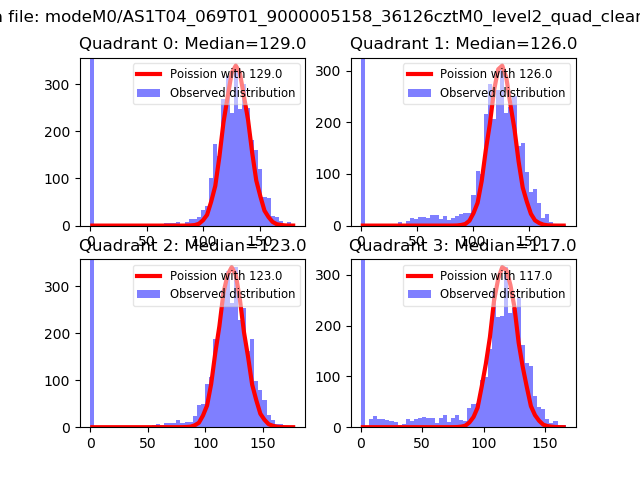 |
 |
| Quadrant-wise count rates Data is divided into 100 sec bins |
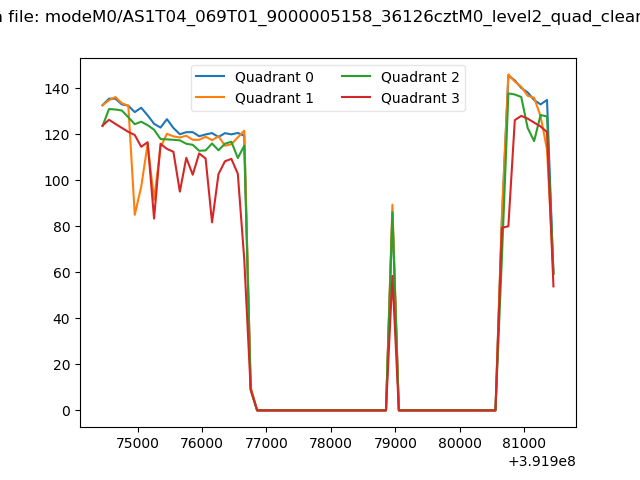 |
|
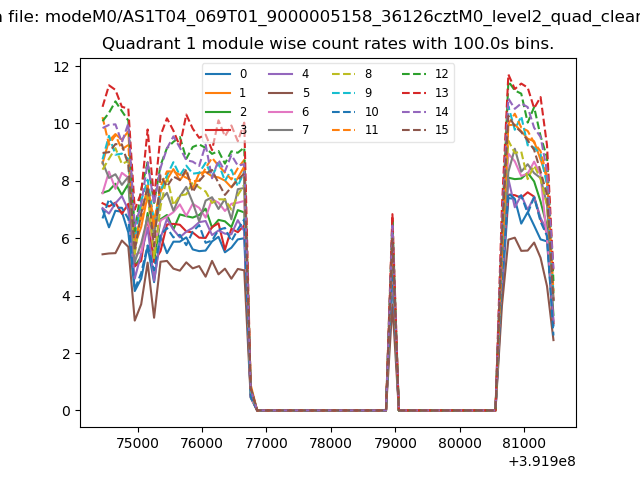
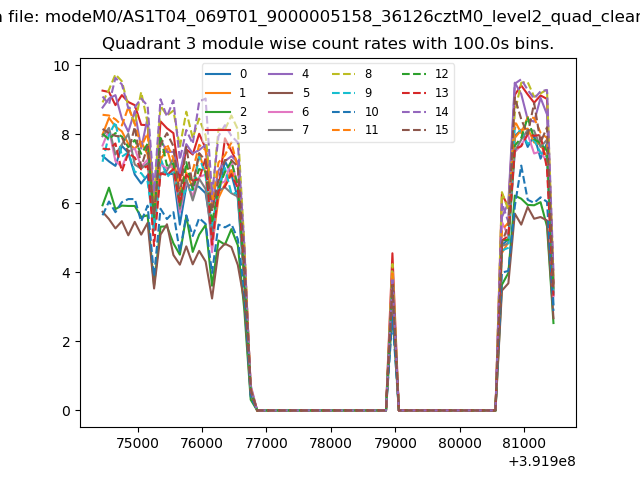
| Module-wise count rates for Quadrant A Data is divided into 100 sec bins |
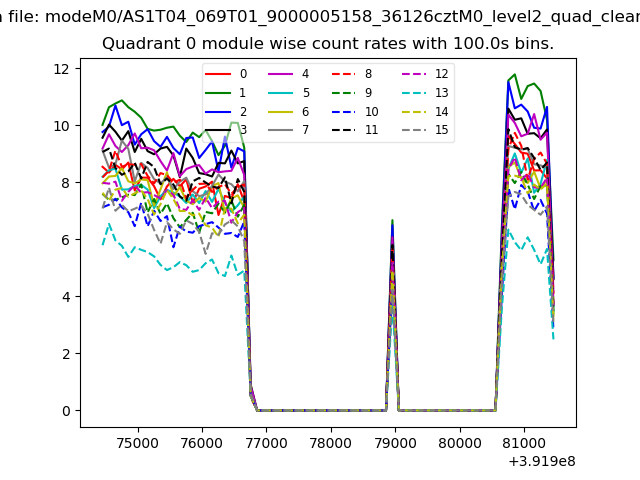 |
 |
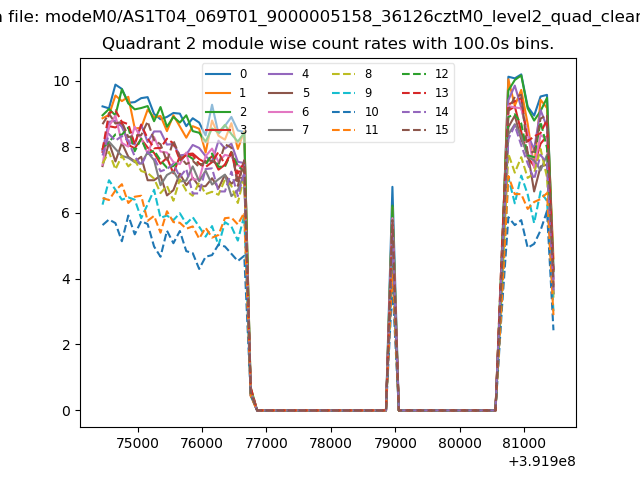
| Module-wise count rates for Quadrant B Data is divided into 100 sec bins |
 |
 |
| Module-wise count rates for Quadrant C Data is divided into 100 sec bins |
 |
 |
| Module-wise count rates for Quadrant D Data is divided into 100 sec bins |
 |
 |
| Parameter | Plot |
|---|---|
| CZT HV Monitor | 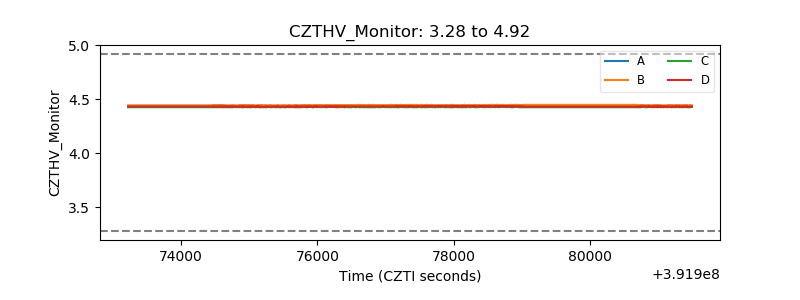 |
| D_VDD | 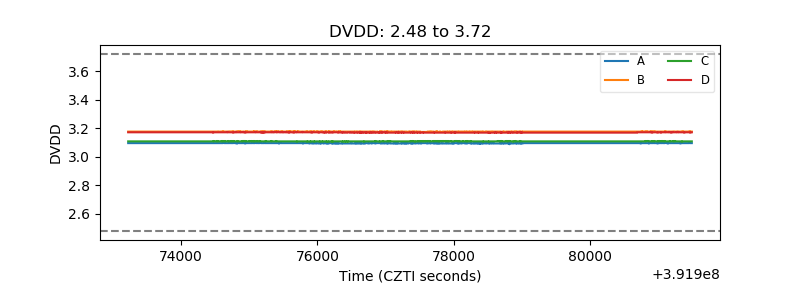 |
| Temperature 1 | 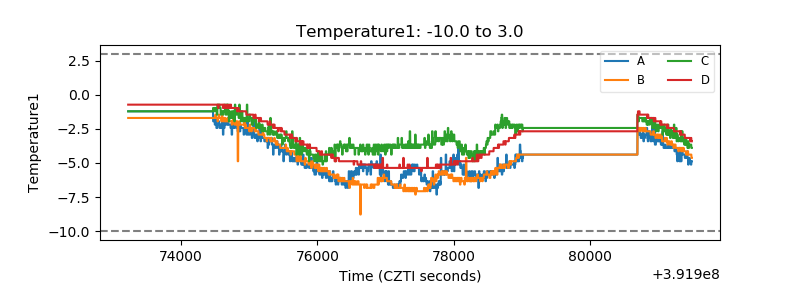 |
| Veto HV Monitor | 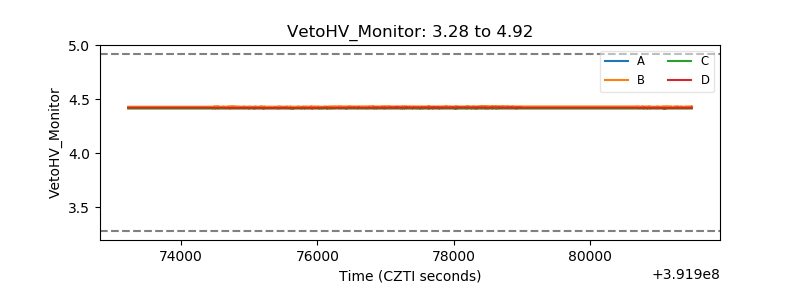 |
| Veto LLD | 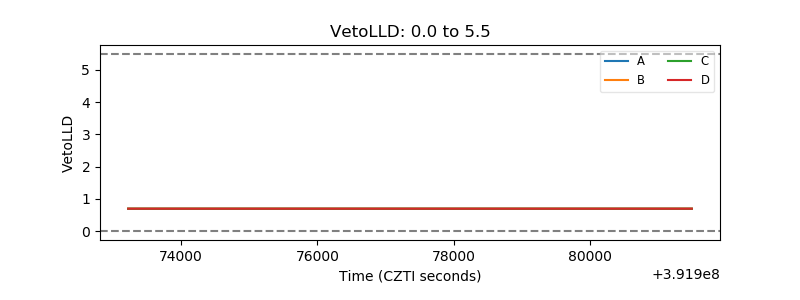 |
| Alpha Counter | 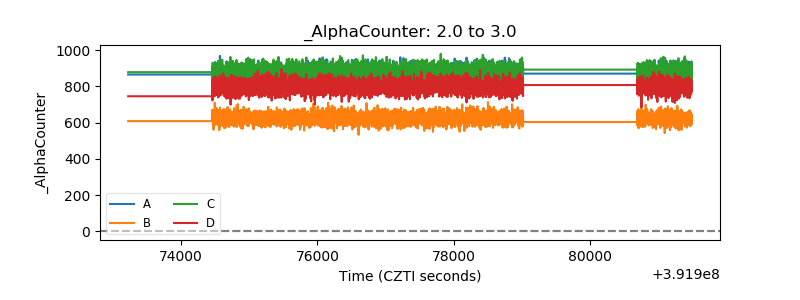 |
| _CPM_Rate | 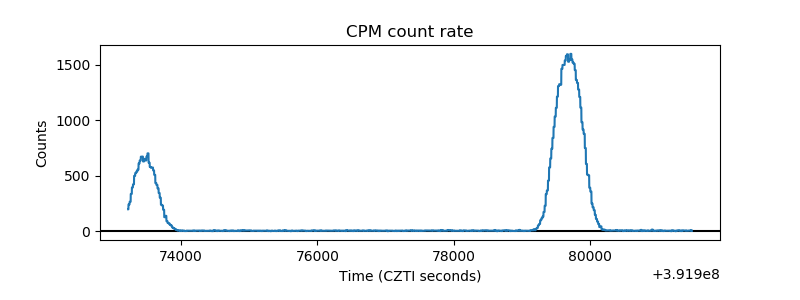 |
| CZT Counter | 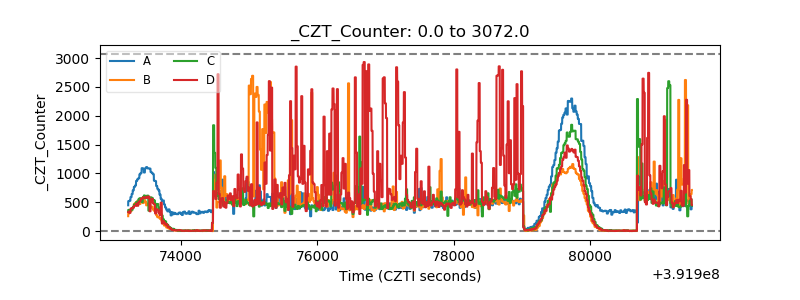 |
| +2.5 Volts monitor | 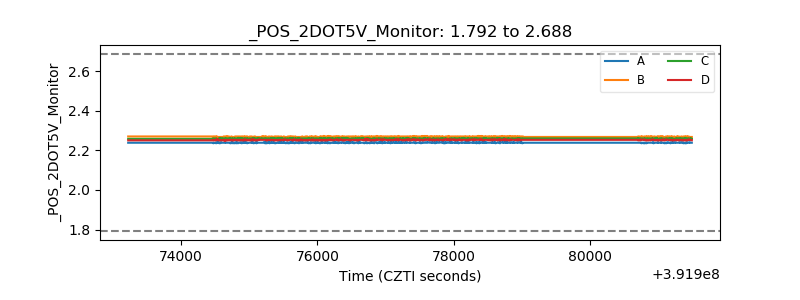 |
| +5 Volts monitor | 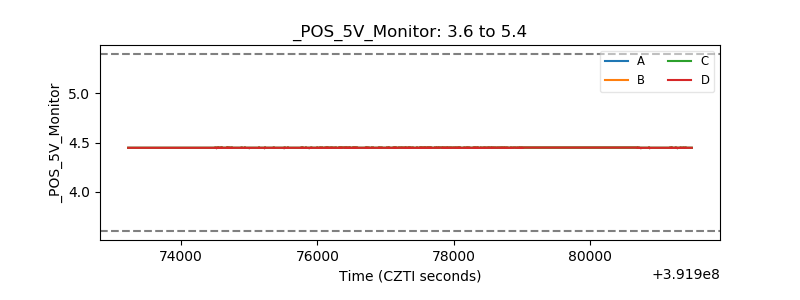 |
| _ROLL_ROT | 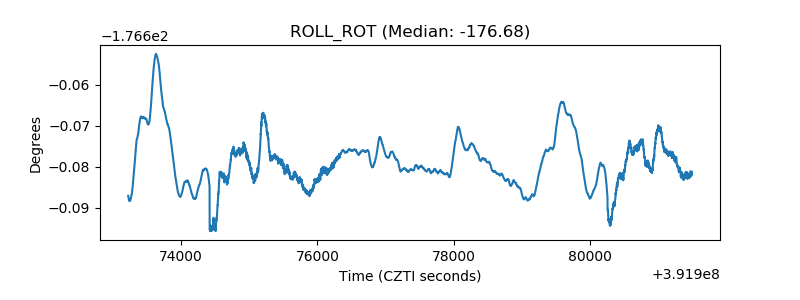 |
| _Roll_DEC | 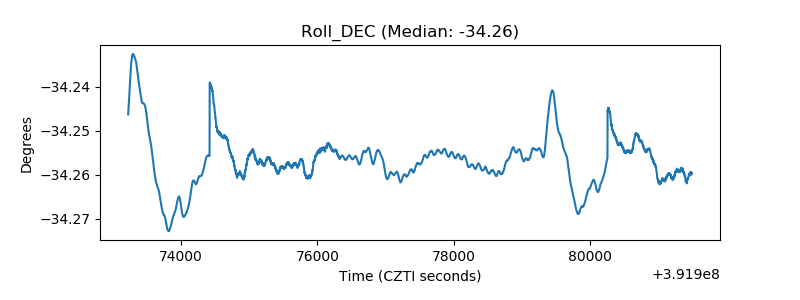 |
| _Roll_RA | 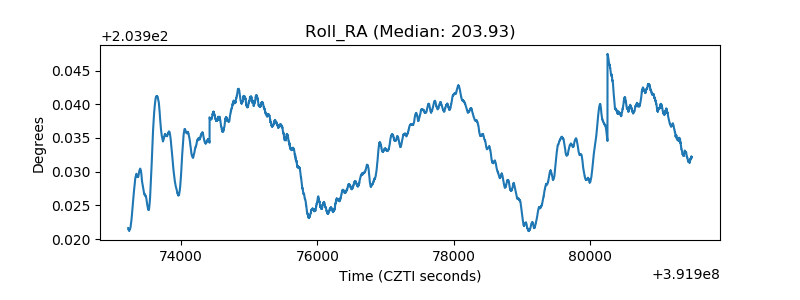 |
| Veto Counter | 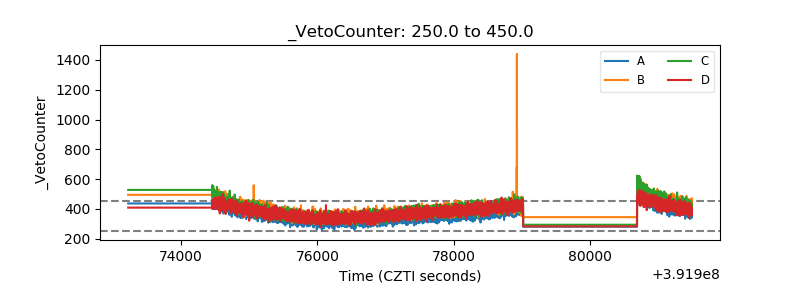 |