| Param | Original file | Final file |
|---|---|---|
| Filename | modeM0/AS1T04_069T01_9000005158_36124cztM0_level2.evt | modeM0/AS1T04_069T01_9000005158_36124cztM0_level2_quad_clean.evt |
| Size (bytes) | 1,119,015,360 | 140,852,160 |
| Size | 1.0 GB | 134.3 MB |
| Events in quadrant A | 5,302,739 | 941,484 |
| Events in quadrant B | 7,187,550 | 922,594 |
| Events in quadrant C | 6,116,154 | 904,684 |
| Events in quadrant D | 14,564,202 | 757,033 |
| Mode M0 | |||
|---|---|---|---|
| Quadrant | BADHDUFLAG | Total packets | Discarded packets |
| A | 0 | 22612 | 5 |
| B | 0 | 28327 | 12 |
| C | 0 | 24750 | 12 |
| D | 0 | 50513 | 99 |
| Mode M9 | |||
|---|---|---|---|
| Quadrant | BADHDUFLAG | Total packets | Discarded packets |
| A | 0 | 27 | 0 |
| B | 0 | 27 | 0 |
| C | 0 | 26 | 0 |
| D | 0 | 27 | 0 |
| Mode SS | |||
|---|---|---|---|
| Quadrant | BADHDUFLAG | Total packets | Discarded packets |
| A | 0 | 220 | 0 |
| B | 0 | 220 | 0 |
| C | 0 | 219 | 0 |
| D | 0 | 220 | 0 |
| Quadrant | Total seconds | Saturated seconds | Saturation percentage |
|---|---|---|---|
| A | 10666 | 60 | 0.562535% |
| B | 10662 | 764 | 7.165635% |
| C | 10660 | 212 | 1.988743% |
| D | 10653 | 2764 | 25.945743% |
Noise dominated data is calculated using 1-second bins in cleaned event files. If a bin has >2000 counts, and if more than 50% of those come from <1% of pixels, then it is considered to be noise-dominated and hence unusable.
| Quadrant | # 1 sec bins | Bins with >0 counts | Bins with >2000 counts | High rate bins dominated by noise | Noise dominated (total time) | Noise dominated (detector-on time) | Marked lightcurve |
|---|---|---|---|---|---|---|---|
| A | 13502 | 10669 | 34 | 34 | 0.25% | 0.32% | 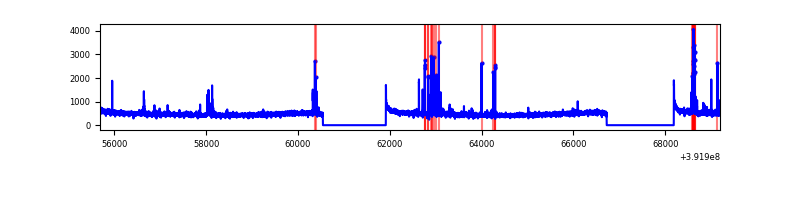 |
| B | 13502 | 10668 | 495 | 495 | 3.67% | 4.64% | 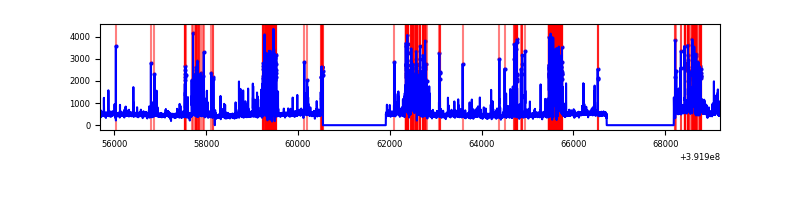 |
| C | 13502 | 10667 | 186 | 186 | 1.38% | 1.74% | 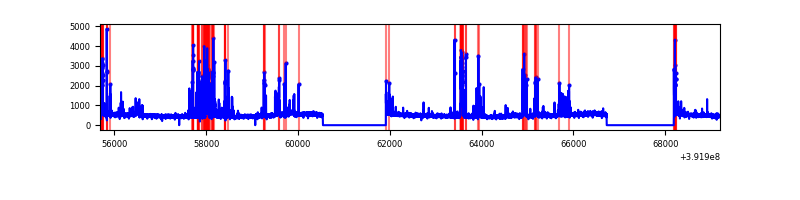 |
| D | 13502 | 10666 | 3103 | 3103 | 22.98% | 29.09% | 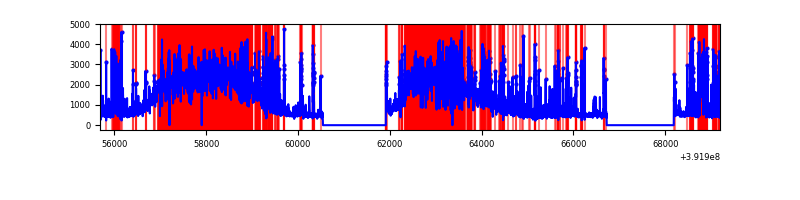 |
Top three noisy pixels from each quadrant. If the there are fewer than three noisy pixels in the level2.evt file, extra rows are filled as -1
| Pixel properties | Quadrant properties | ||||||
|---|---|---|---|---|---|---|---|
| Quadrant | DetID | PixID | Counts | Sigma | Mean | Median | Sigma |
| A | 10 | 83 | 298695 | 1190.93 | 1225 | 1200 | 249.8 |
| A | 9 | 143 | 124408 | 493.22 | 1225 | 1200 | 249.8 |
| A | 15 | 223 | 119378 | 473.09 | 1225 | 1200 | 249.8 |
| B | 5 | 172 | 1949157 | 8618.13 | 1173 | 1142 | 226.0 |
| B | 4 | 232 | 239138 | 1052.91 | 1173 | 1142 | 226.0 |
| B | 0 | 190 | 140880 | 618.21 | 1173 | 1142 | 226.0 |
| C | 0 | 207 | 604123 | 2214.48 | 1168 | 1177 | 272.3 |
| C | 15 | 214 | 445590 | 1632.22 | 1168 | 1177 | 272.3 |
| C | 9 | 187 | 321378 | 1176.02 | 1168 | 1177 | 272.3 |
| D | 10 | 203 | 7154649 | 26703.59 | 1094 | 1065 | 267.9 |
| D | 12 | 17 | 803146 | 2994.09 | 1094 | 1065 | 267.9 |
| D | 2 | 249 | 681550 | 2540.18 | 1094 | 1065 | 267.9 |
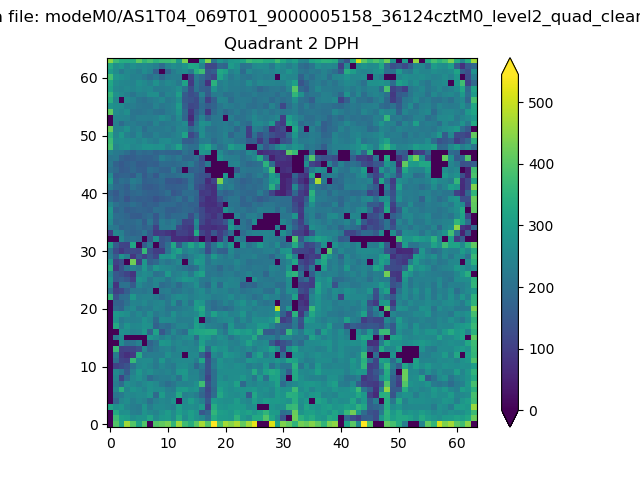
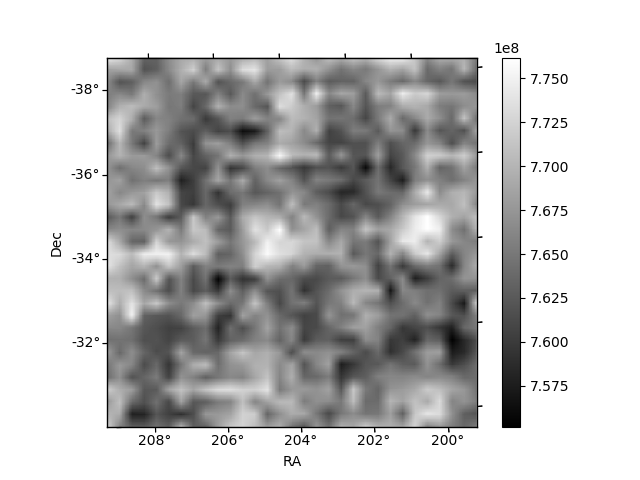
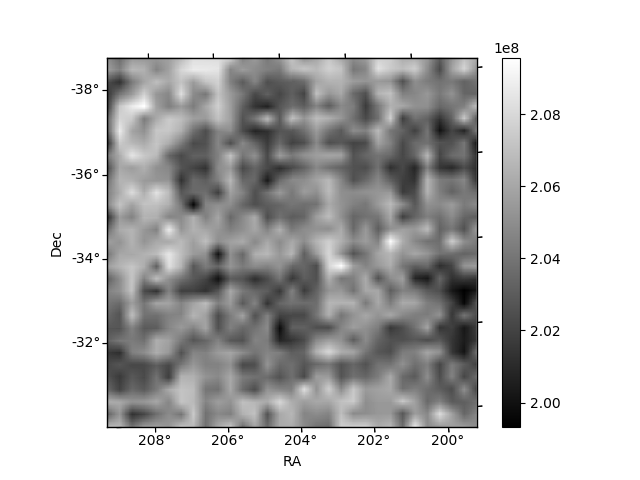
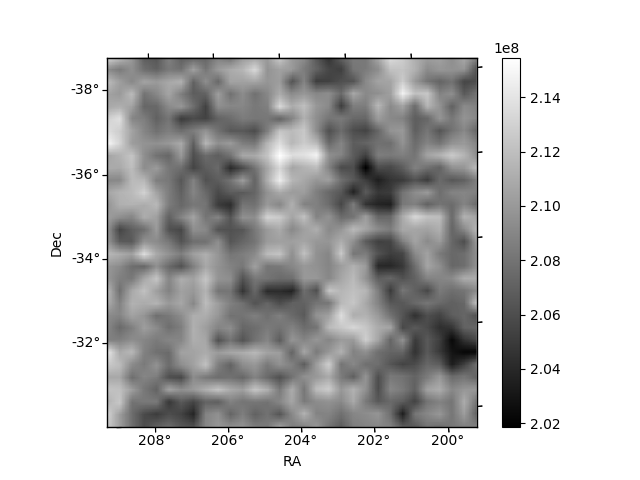
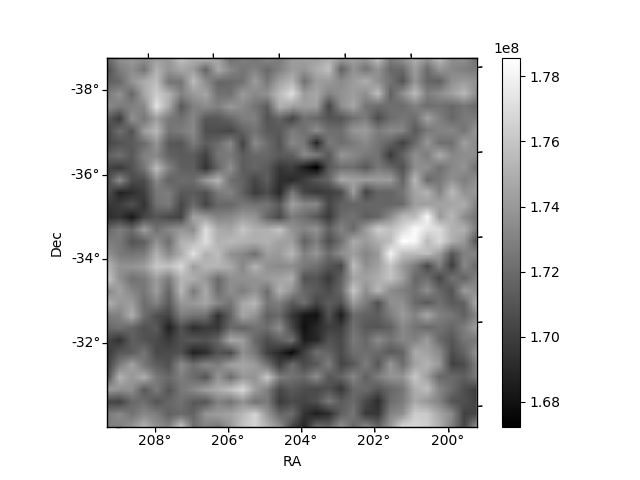
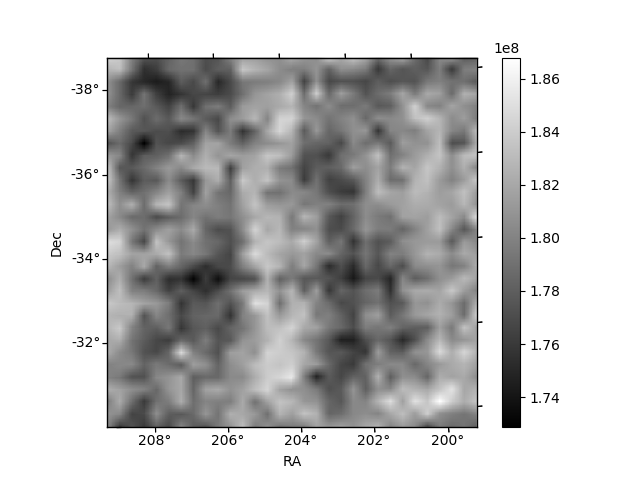
Histogram calculated using DETX and DETY for each event in the final _common_clean file
| Quadrant A | 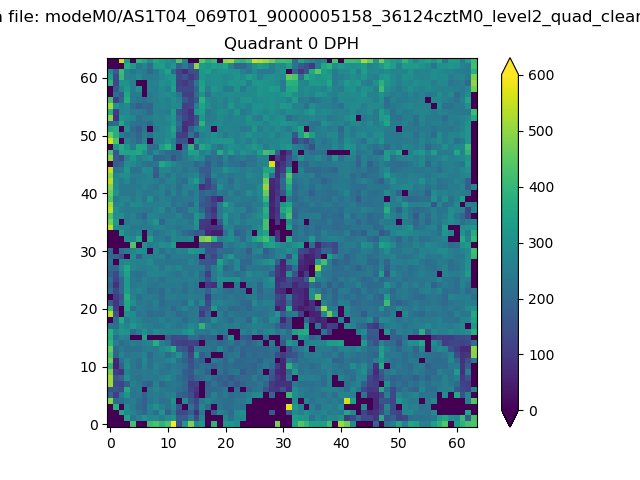 |
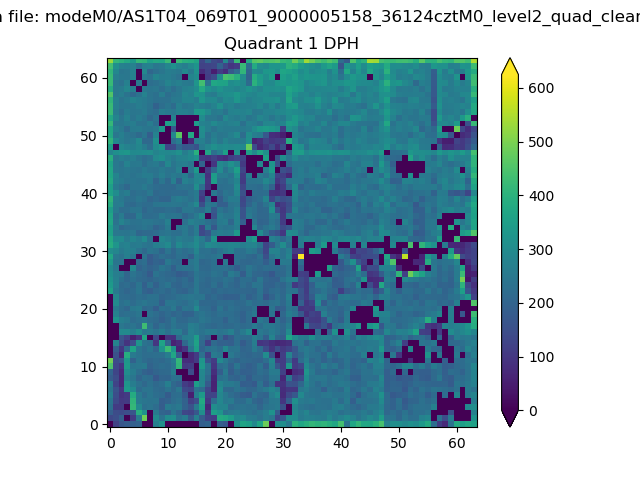 |
Quadrant B |
|---|---|---|---|
| Quadrant D | 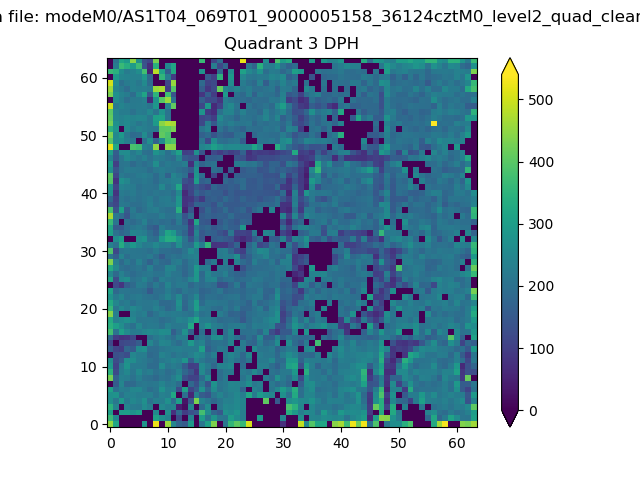 |
 |
Quadrant C |
| Plot type | Count rate plots | Images |
|---|---|---|
| Comparison with Poisson distribution Blue bars denote a histogram of data divided into 1 sec bins. Red curve is a Poisson curve with rate = median count rate of data. |
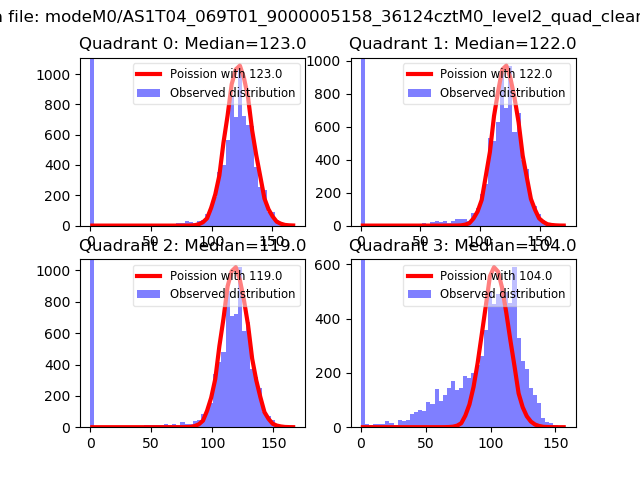 |
 |
| Quadrant-wise count rates Data is divided into 100 sec bins |
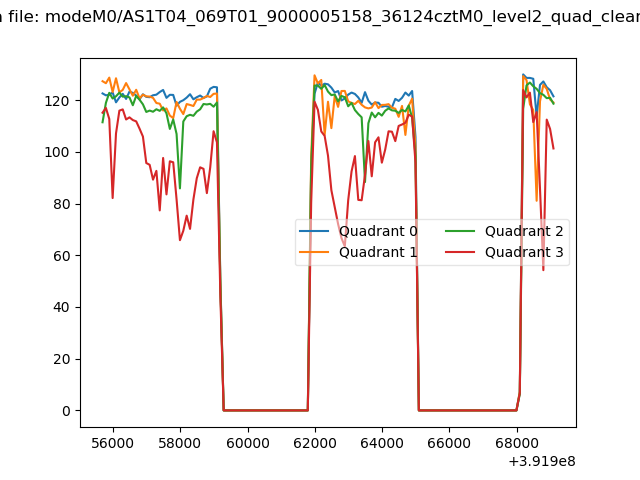 |
|
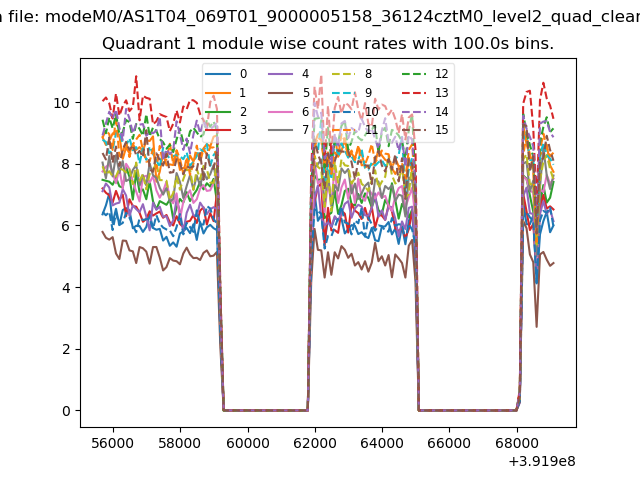
| Module-wise count rates for Quadrant A Data is divided into 100 sec bins |
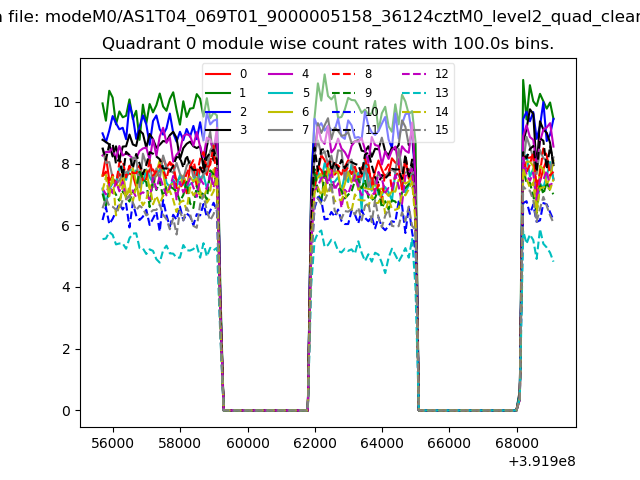 |
 |
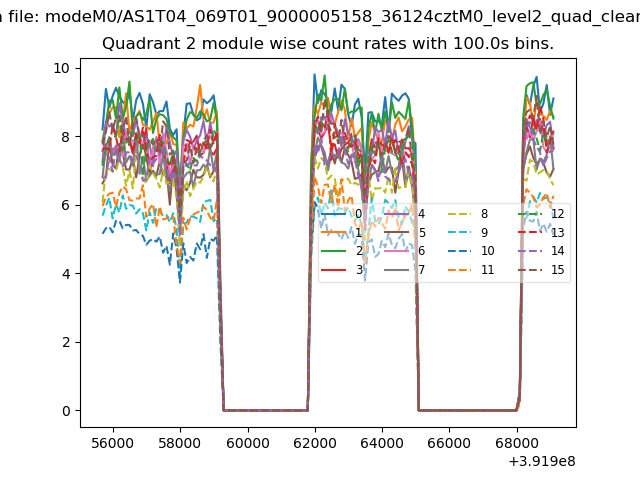
| Module-wise count rates for Quadrant B Data is divided into 100 sec bins |
 |
 |
| Module-wise count rates for Quadrant C Data is divided into 100 sec bins |
 |
 |
| Module-wise count rates for Quadrant D Data is divided into 100 sec bins |
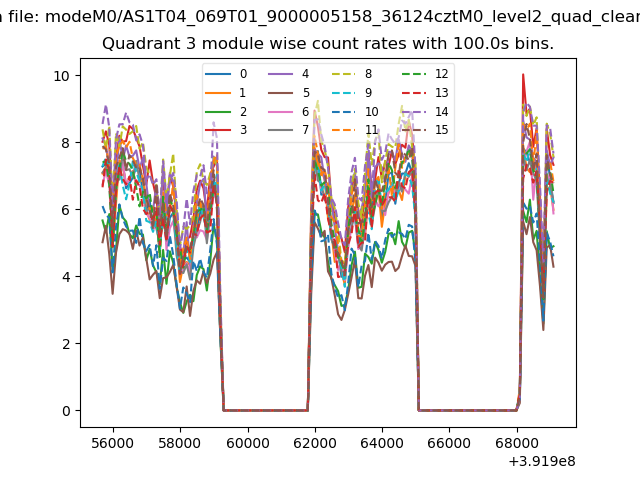 |
 |
| Parameter | Plot |
|---|---|
| CZT HV Monitor | 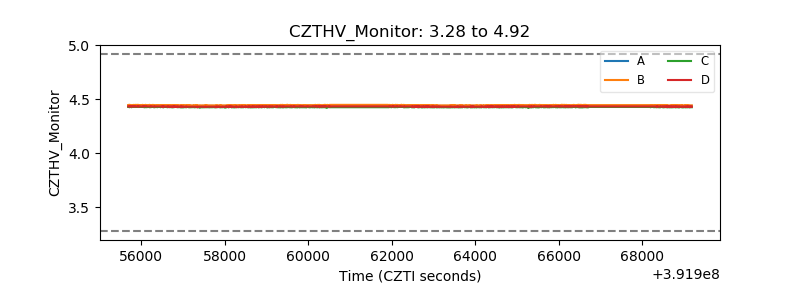 |
| D_VDD | 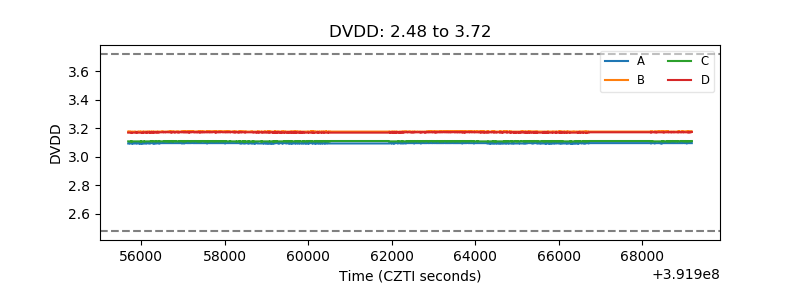 |
| Temperature 1 | 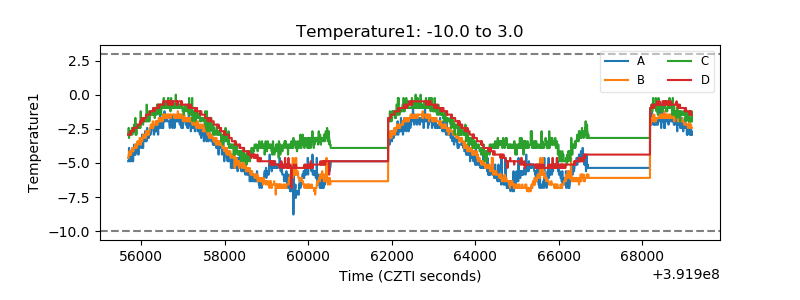 |
| Veto HV Monitor | 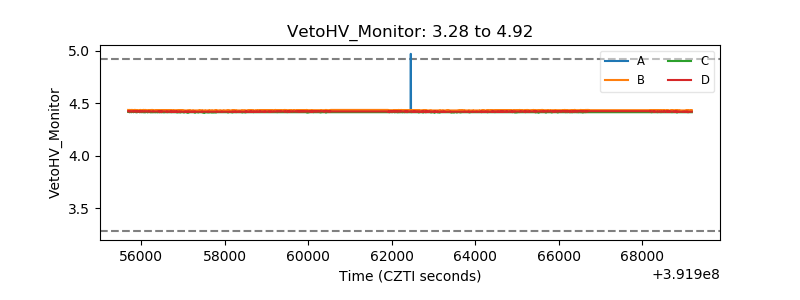 |
| Veto LLD | 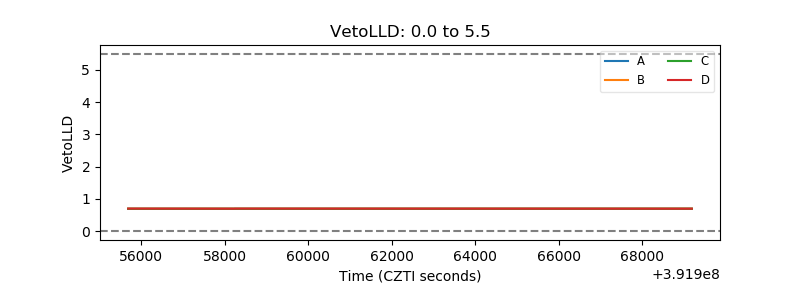 |
| Alpha Counter | 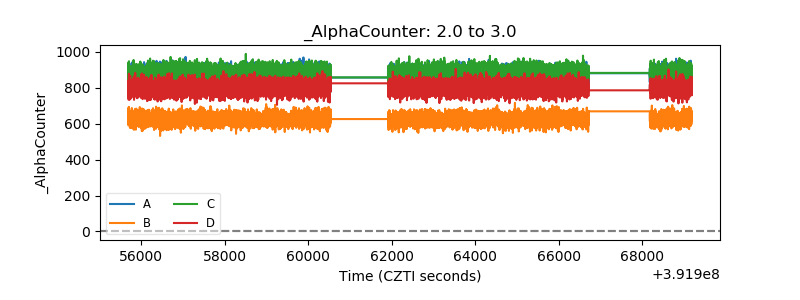 |
| _CPM_Rate | 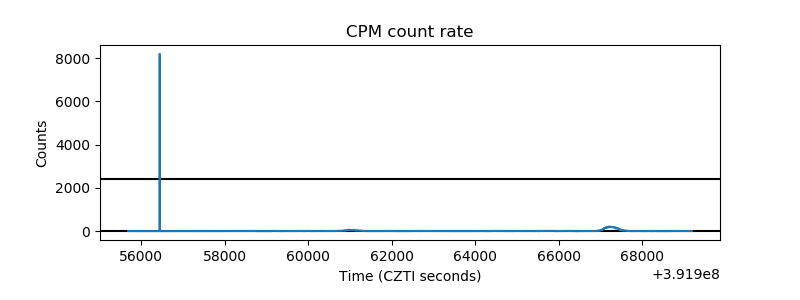 |
| CZT Counter | 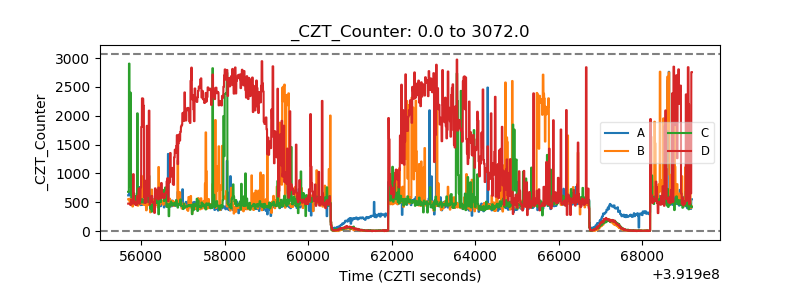 |
| +2.5 Volts monitor | 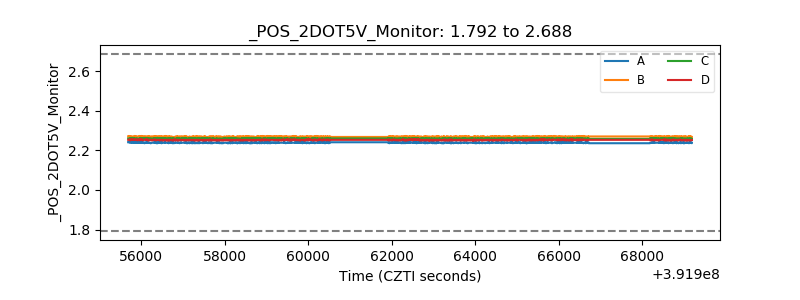 |
| +5 Volts monitor | 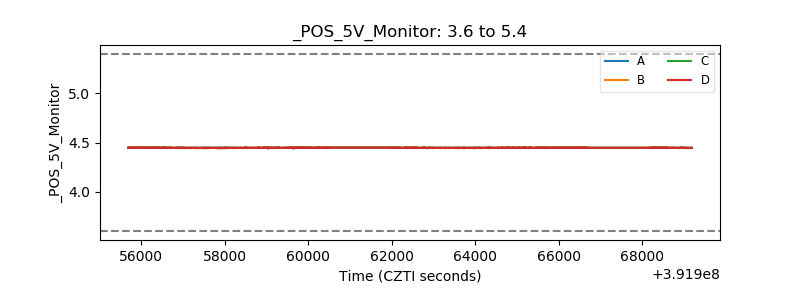 |
| _ROLL_ROT | 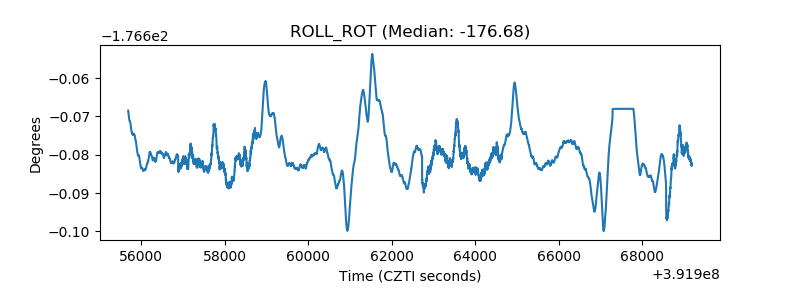 |
| _Roll_DEC | 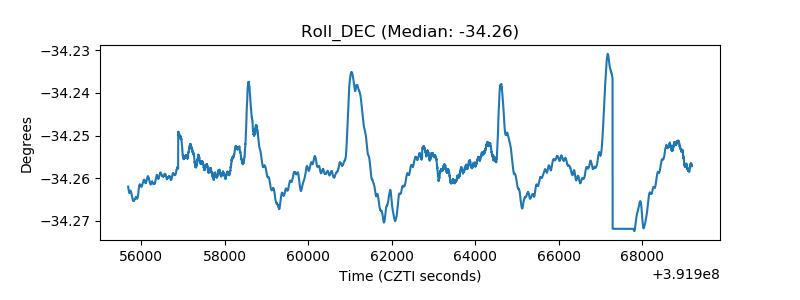 |
| _Roll_RA | 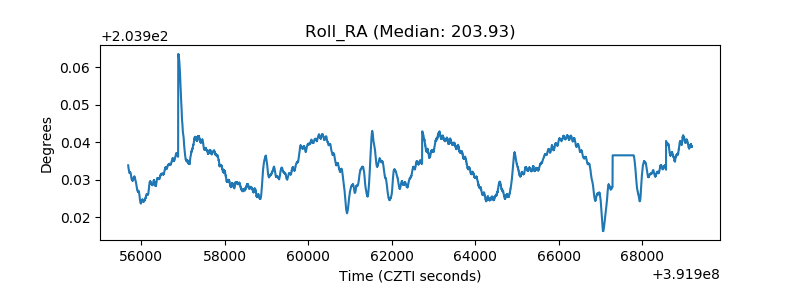 |
| Veto Counter | 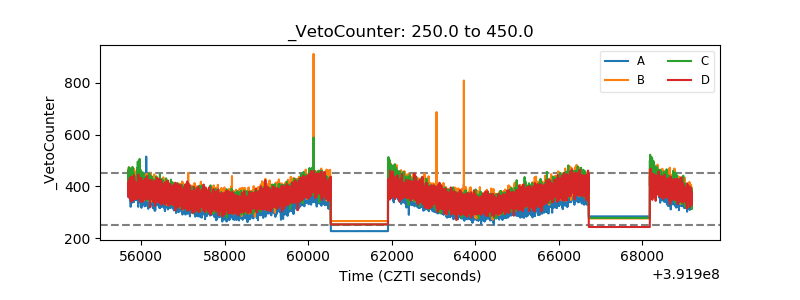 |