| Param | Original file | Final file |
|---|---|---|
| Filename | modeM0/AS1T04_069T01_9000005158_36119cztM0_level2.evt | modeM0/AS1T04_069T01_9000005158_36119cztM0_level2_quad_clean.evt |
| Size (bytes) | 481,337,280 | 64,474,560 |
| Size | 459.0 MB | 61.5 MB |
| Events in quadrant A | 2,765,472 | 403,479 |
| Events in quadrant B | 3,539,251 | 400,238 |
| Events in quadrant C | 3,264,212 | 398,148 |
| Events in quadrant D | 4,630,759 | 360,446 |
| Mode M0 | |||
|---|---|---|---|
| Quadrant | BADHDUFLAG | Total packets | Discarded packets |
| A | 0 | 11573 | 3 |
| B | 0 | 14027 | 2 |
| C | 0 | 13012 | 2 |
| D | 0 | 17470 | 2 |
| Mode M9 | |||
|---|---|---|---|
| Quadrant | BADHDUFLAG | Total packets | Discarded packets |
| A | 0 | 40 | 0 |
| B | 0 | 40 | 0 |
| C | 0 | 40 | 0 |
| D | 0 | 40 | 0 |
| Mode SS | |||
|---|---|---|---|
| Quadrant | BADHDUFLAG | Total packets | Discarded packets |
| A | 0 | 116 | 0 |
| B | 0 | 116 | 0 |
| C | 0 | 116 | 0 |
| D | 0 | 116 | 0 |
| Quadrant | Total seconds | Saturated seconds | Saturation percentage |
|---|---|---|---|
| A | 5566 | 15 | 0.269493% |
| B | 5566 | 223 | 4.006468% |
| C | 5566 | 115 | 2.066116% |
| D | 5566 | 309 | 5.551563% |
Noise dominated data is calculated using 1-second bins in cleaned event files. If a bin has >2000 counts, and if more than 50% of those come from <1% of pixels, then it is considered to be noise-dominated and hence unusable.
| Quadrant | # 1 sec bins | Bins with >0 counts | Bins with >2000 counts | High rate bins dominated by noise | Noise dominated (total time) | Noise dominated (detector-on time) | Marked lightcurve |
|---|---|---|---|---|---|---|---|
| A | 9543 | 5568 | 3 | 3 | 0.03% | 0.05% |  |
| B | 9543 | 5568 | 150 | 150 | 1.57% | 2.69% | 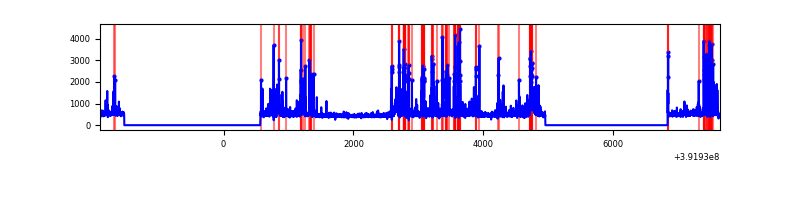 |
| C | 9543 | 5568 | 81 | 81 | 0.85% | 1.45% | 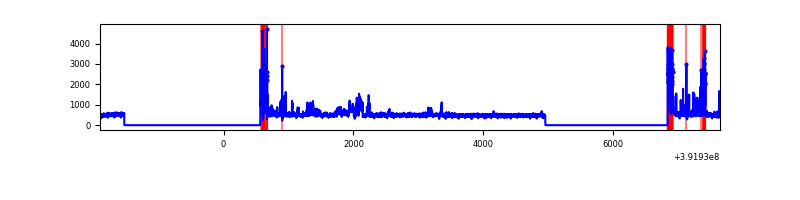 |
| D | 9543 | 5568 | 265 | 265 | 2.78% | 4.76% | 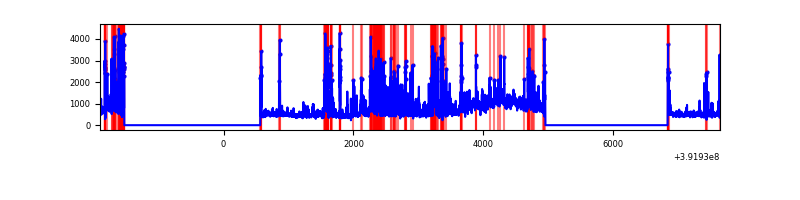 |
Top three noisy pixels from each quadrant. If the there are fewer than three noisy pixels in the level2.evt file, extra rows are filled as -1
| Pixel properties | Quadrant properties | ||||||
|---|---|---|---|---|---|---|---|
| Quadrant | DetID | PixID | Counts | Sigma | Mean | Median | Sigma |
| A | 10 | 83 | 183323 | 1397.37 | 651 | 638 | 130.7 |
| A | 9 | 143 | 34899 | 262.07 | 651 | 638 | 130.7 |
| A | 15 | 223 | 14231 | 103.97 | 651 | 638 | 130.7 |
| B | 5 | 172 | 786159 | 6376.99 | 640 | 623 | 123.2 |
| B | 5 | 236 | 137086 | 1107.81 | 640 | 623 | 123.2 |
| B | 0 | 155 | 32420 | 258.13 | 640 | 623 | 123.2 |
| C | 0 | 10 | 266837 | 1836.87 | 624 | 628 | 144.9 |
| C | 15 | 214 | 234655 | 1614.81 | 624 | 628 | 144.9 |
| C | 1 | 23 | 205130 | 1411.09 | 624 | 628 | 144.9 |
| D | 1 | 52 | 1005492 | 6682.65 | 615 | 600 | 150.4 |
| D | 10 | 203 | 717044 | 4764.44 | 615 | 600 | 150.4 |
| D | 12 | 233 | 138197 | 915.04 | 615 | 600 | 150.4 |
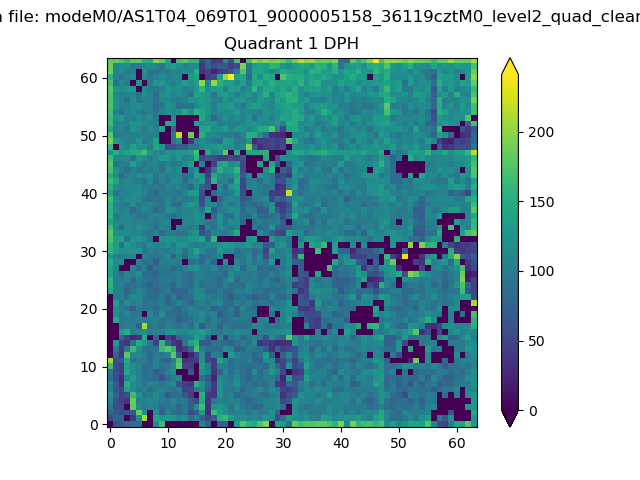
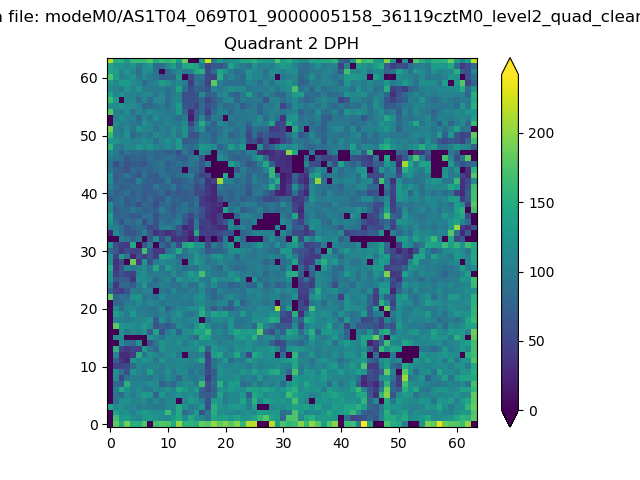
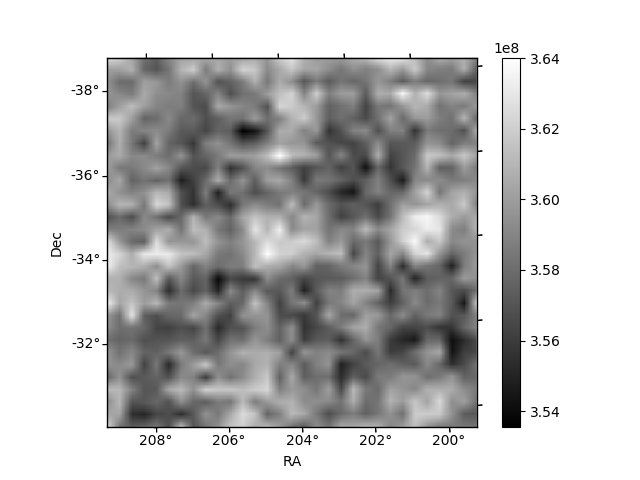
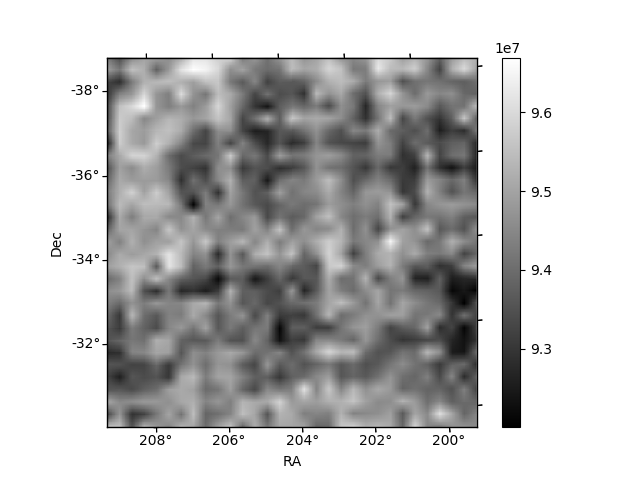
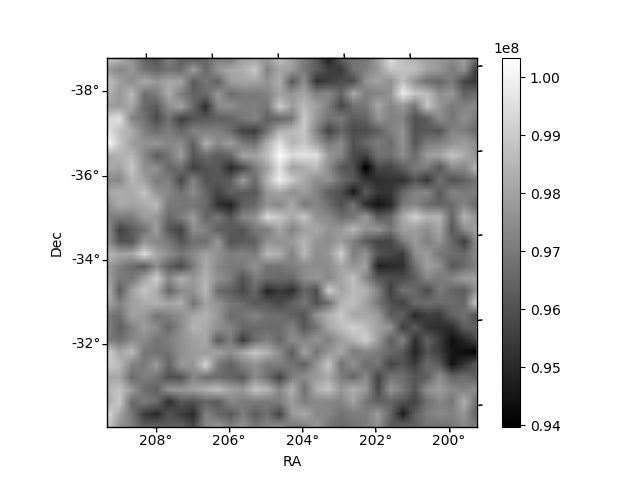
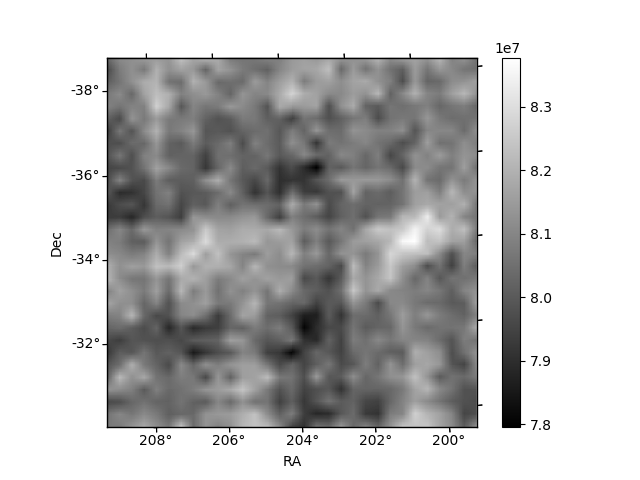
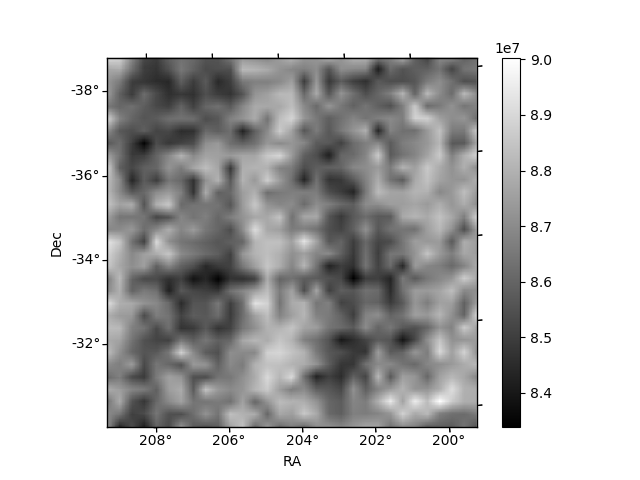
Histogram calculated using DETX and DETY for each event in the final _common_clean file
| Quadrant A | 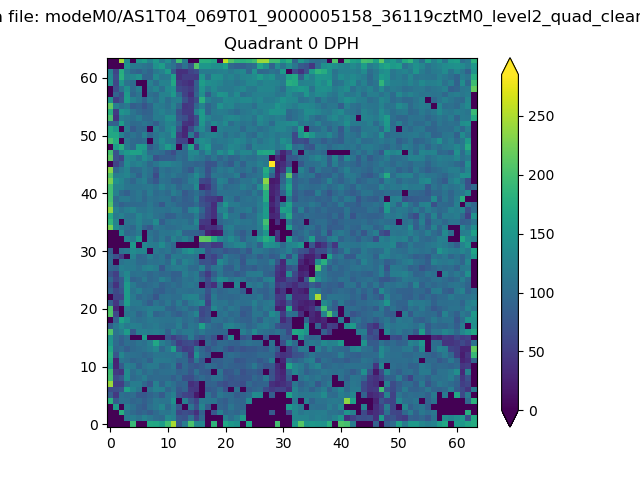 |
 |
Quadrant B |
|---|---|---|---|
| Quadrant D | 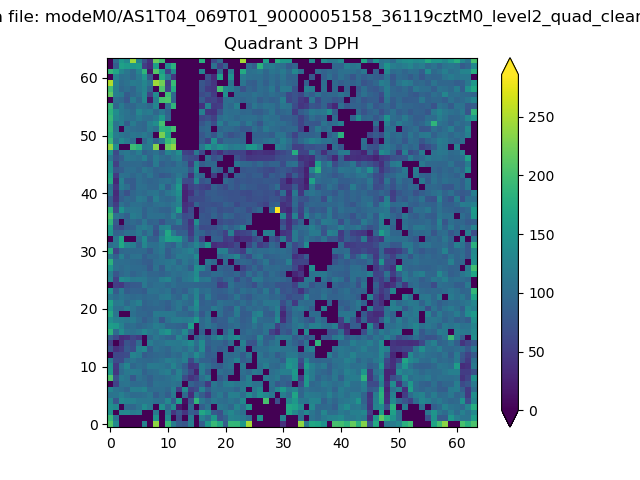 |
 |
Quadrant C |
| Plot type | Count rate plots | Images |
|---|---|---|
| Comparison with Poisson distribution Blue bars denote a histogram of data divided into 1 sec bins. Red curve is a Poisson curve with rate = median count rate of data. |
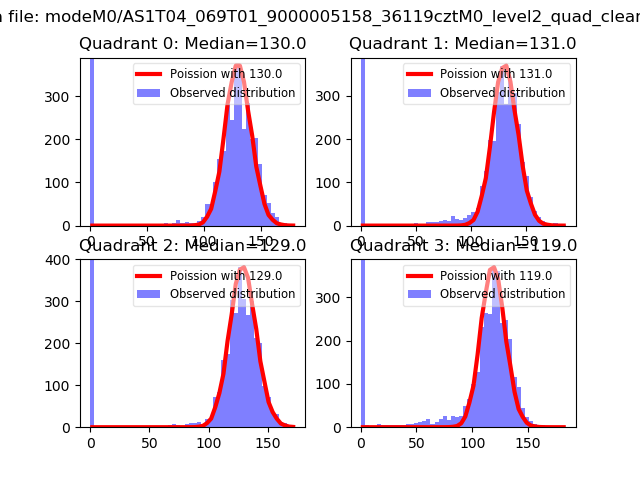 |
 |
| Quadrant-wise count rates Data is divided into 100 sec bins |
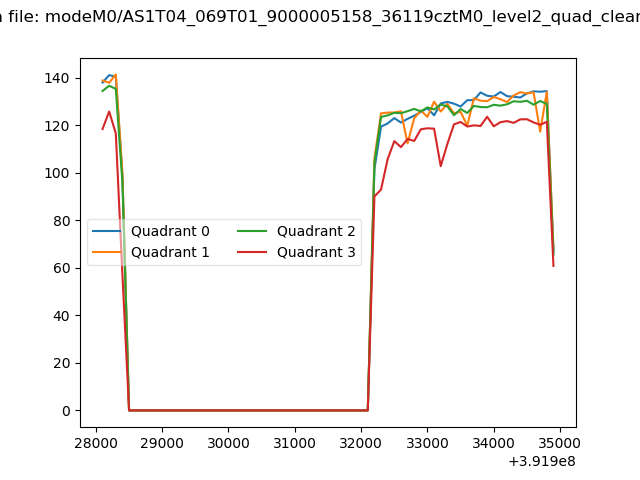 |
|
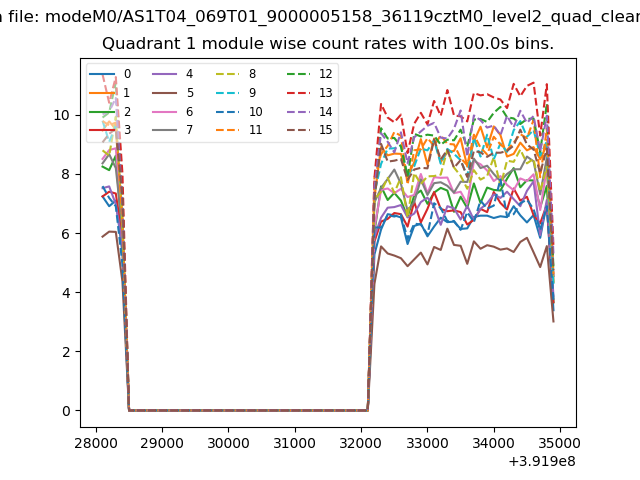
| Module-wise count rates for Quadrant A Data is divided into 100 sec bins |
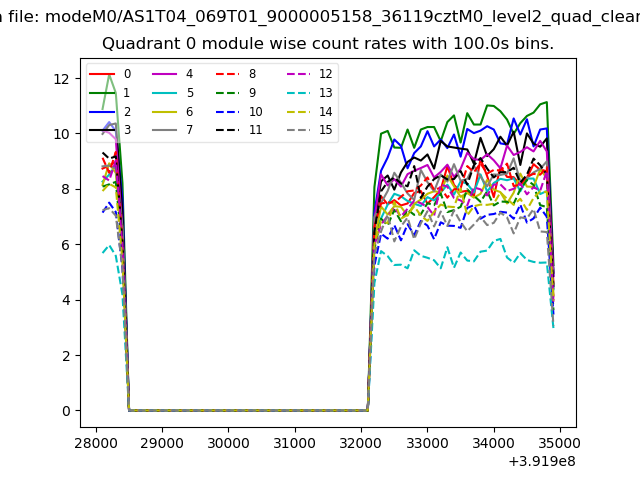 |
 |
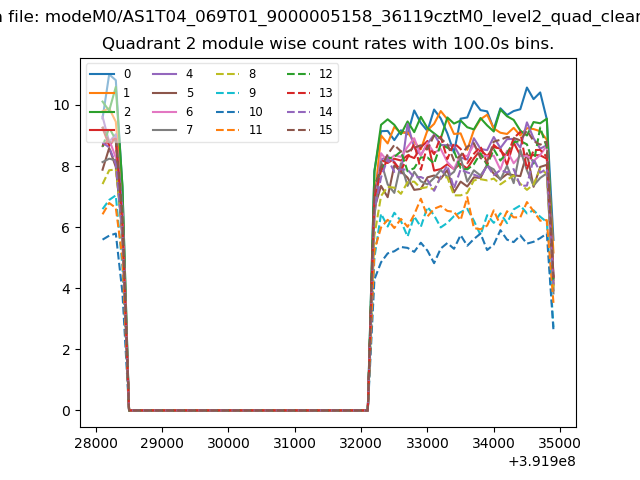
| Module-wise count rates for Quadrant B Data is divided into 100 sec bins |
 |
 |
| Module-wise count rates for Quadrant C Data is divided into 100 sec bins |
 |
 |
| Module-wise count rates for Quadrant D Data is divided into 100 sec bins |
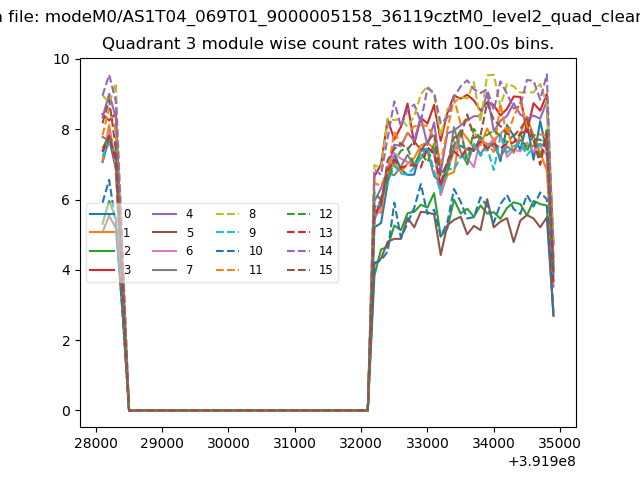 |
 |
| Parameter | Plot |
|---|---|
| CZT HV Monitor | 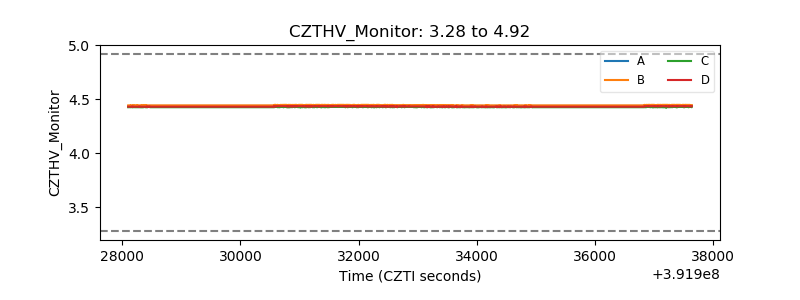 |
| D_VDD | 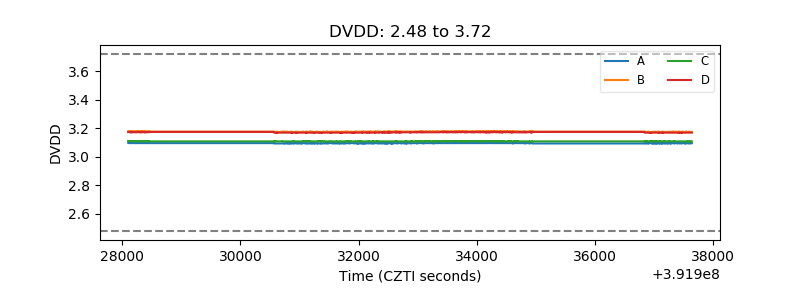 |
| Temperature 1 | 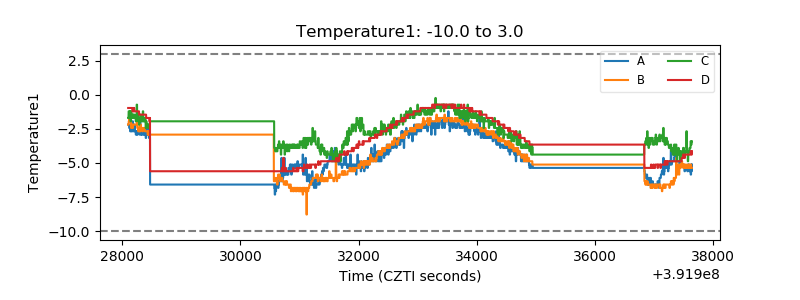 |
| Veto HV Monitor | 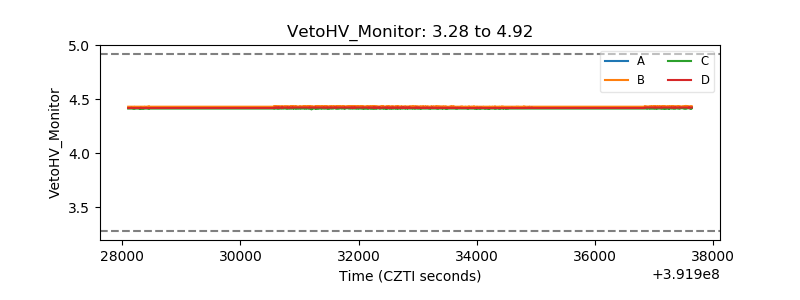 |
| Veto LLD | 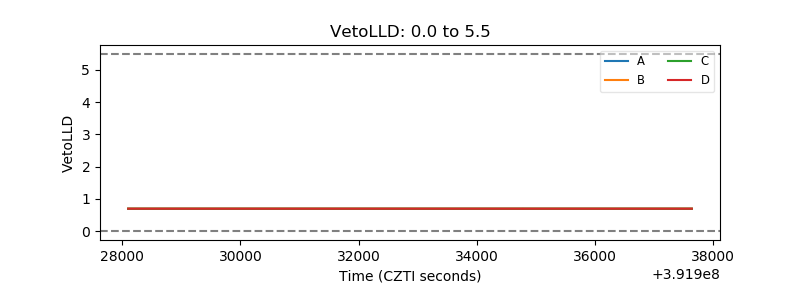 |
| Alpha Counter | 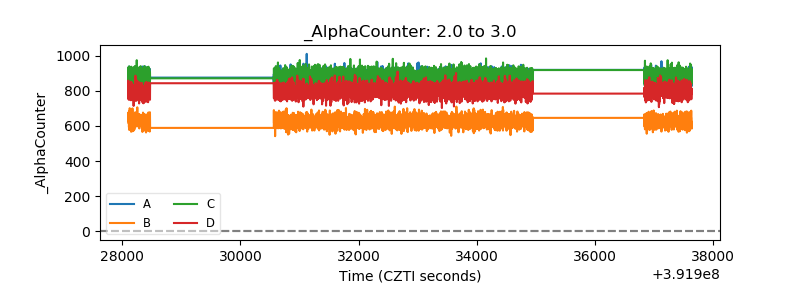 |
| _CPM_Rate | 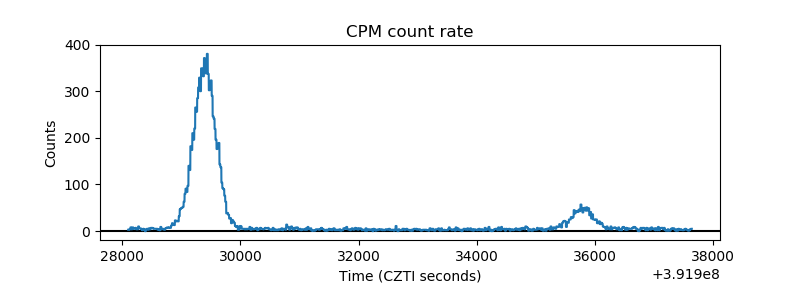 |
| CZT Counter | 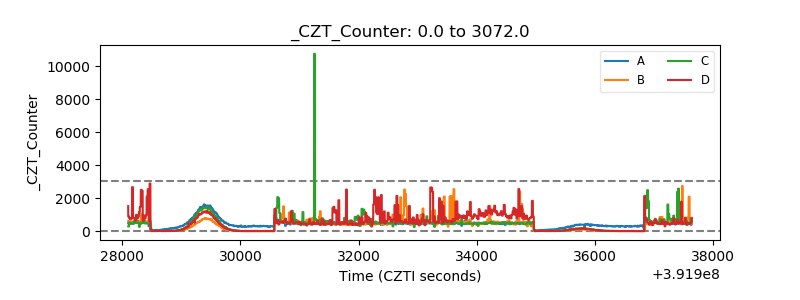 |
| +2.5 Volts monitor | 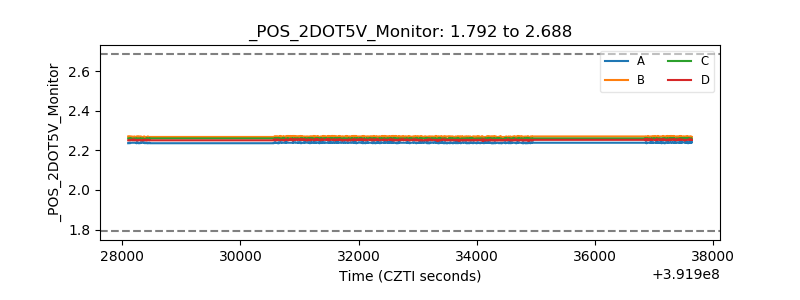 |
| +5 Volts monitor | 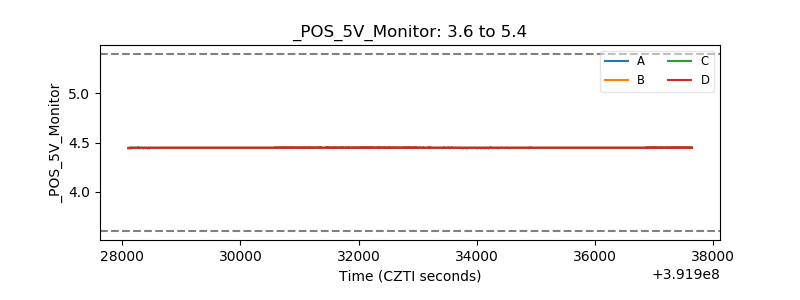 |
| _ROLL_ROT | 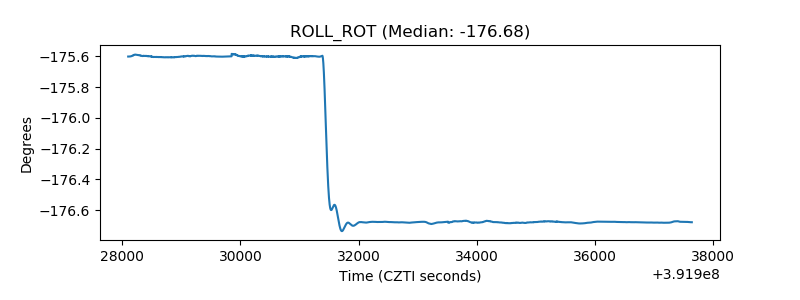 |
| _Roll_DEC | 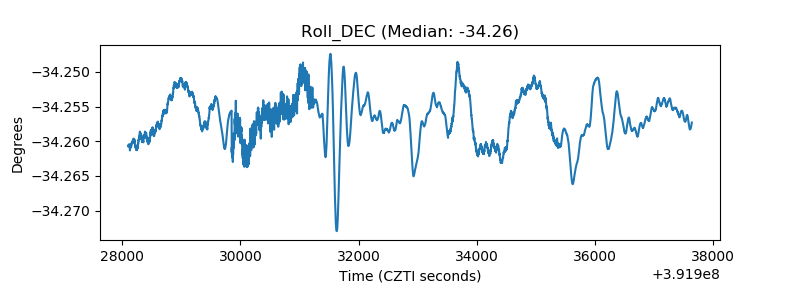 |
| _Roll_RA |  |
| Veto Counter | 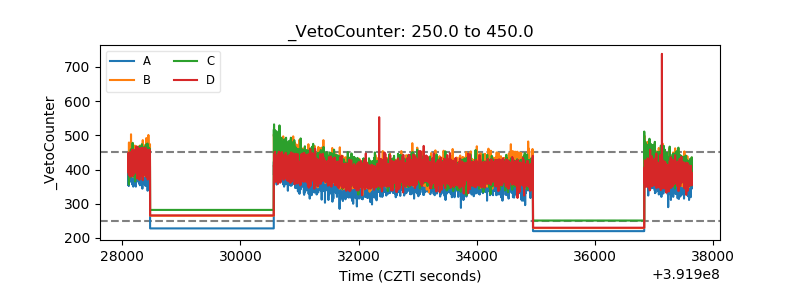 |