| Param | Original file | Final file |
|---|---|---|
| Filename | modeM0/AS1T04_069T01_9000005158_36117cztM0_level2.evt | modeM0/AS1T04_069T01_9000005158_36117cztM0_level2_quad_clean.evt |
| Size (bytes) | 508,970,880 | 45,014,400 |
| Size | 485.4 MB | 42.9 MB |
| Events in quadrant A | 2,568,214 | 265,615 |
| Events in quadrant B | 4,058,283 | 243,362 |
| Events in quadrant C | 2,918,097 | 260,219 |
| Events in quadrant D | 5,526,990 | 238,432 |
| Mode M0 | |||
|---|---|---|---|
| Quadrant | BADHDUFLAG | Total packets | Discarded packets |
| A | 0 | 10554 | 3 |
| B | 0 | 15308 | 2 |
| C | 0 | 11371 | 2 |
| D | 0 | 20012 | 2 |
| Mode M9 | |||
|---|---|---|---|
| Quadrant | BADHDUFLAG | Total packets | Discarded packets |
| A | 0 | 31 | 0 |
| B | 0 | 31 | 0 |
| C | 0 | 31 | 0 |
| D | 0 | 32 | 0 |
| Mode SS | |||
|---|---|---|---|
| Quadrant | BADHDUFLAG | Total packets | Discarded packets |
| A | 0 | 104 | 0 |
| B | 0 | 104 | 0 |
| C | 0 | 104 | 0 |
| D | 0 | 104 | 0 |
| Quadrant | Total seconds | Saturated seconds | Saturation percentage |
|---|---|---|---|
| A | 5055 | 11 | 0.217606% |
| B | 5055 | 554 | 10.959446% |
| C | 5055 | 116 | 2.294758% |
| D | 5055 | 317 | 6.271019% |
Noise dominated data is calculated using 1-second bins in cleaned event files. If a bin has >2000 counts, and if more than 50% of those come from <1% of pixels, then it is considered to be noise-dominated and hence unusable.
| Quadrant | # 1 sec bins | Bins with >0 counts | Bins with >2000 counts | High rate bins dominated by noise | Noise dominated (total time) | Noise dominated (detector-on time) | Marked lightcurve |
|---|---|---|---|---|---|---|---|
| A | 7209 | 5056 | 2 | 2 | 0.03% | 0.04% | 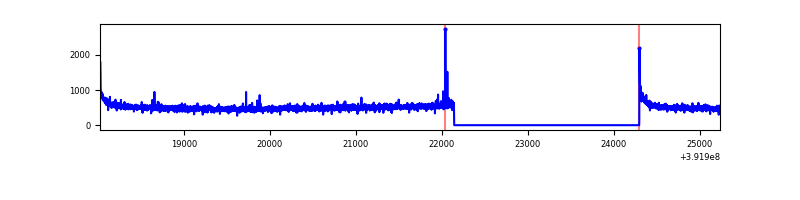 |
| B | 7209 | 5056 | 356 | 356 | 4.94% | 7.04% | 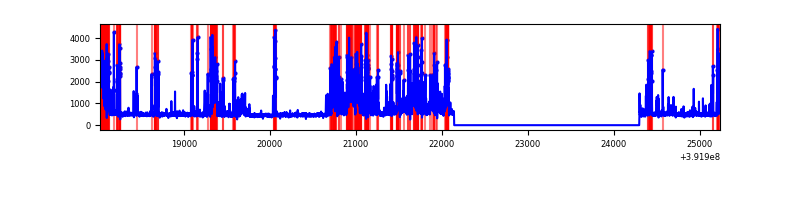 |
| C | 7209 | 5056 | 91 | 91 | 1.26% | 1.80% | 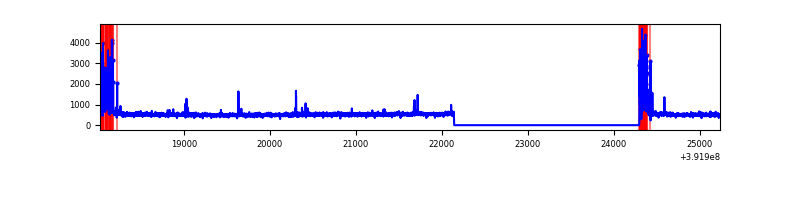 |
| D | 7209 | 5056 | 288 | 288 | 4.00% | 5.70% | 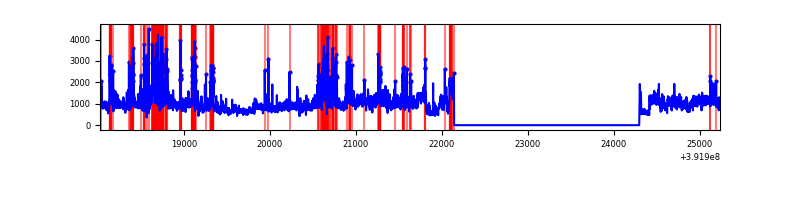 |
Top three noisy pixels from each quadrant. If the there are fewer than three noisy pixels in the level2.evt file, extra rows are filled as -1
| Pixel properties | Quadrant properties | ||||||
|---|---|---|---|---|---|---|---|
| Quadrant | DetID | PixID | Counts | Sigma | Mean | Median | Sigma |
| A | 10 | 83 | 167476 | 1343.11 | 615 | 604 | 124.2 |
| A | 9 | 143 | 10737 | 81.56 | 615 | 604 | 124.2 |
| A | 13 | 6 | 8660 | 64.84 | 615 | 604 | 124.2 |
| B | 5 | 172 | 1462401 | 13070.32 | 586 | 571 | 111.8 |
| B | 5 | 236 | 106840 | 950.16 | 586 | 571 | 111.8 |
| B | 0 | 213 | 61952 | 548.81 | 586 | 571 | 111.8 |
| C | 0 | 10 | 378835 | 2729.35 | 593 | 598 | 138.6 |
| C | 15 | 214 | 214226 | 1541.54 | 593 | 598 | 138.6 |
| C | 1 | 23 | 8754 | 58.85 | 593 | 598 | 138.6 |
| D | 10 | 203 | 2179569 | 15227.43 | 581 | 566 | 143.1 |
| D | 12 | 17 | 437771 | 3055.3 | 581 | 566 | 143.1 |
| D | 12 | 6 | 290817 | 2028.35 | 581 | 566 | 143.1 |
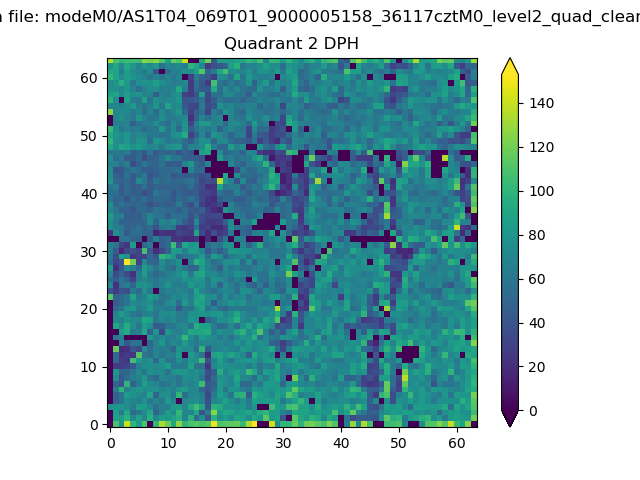
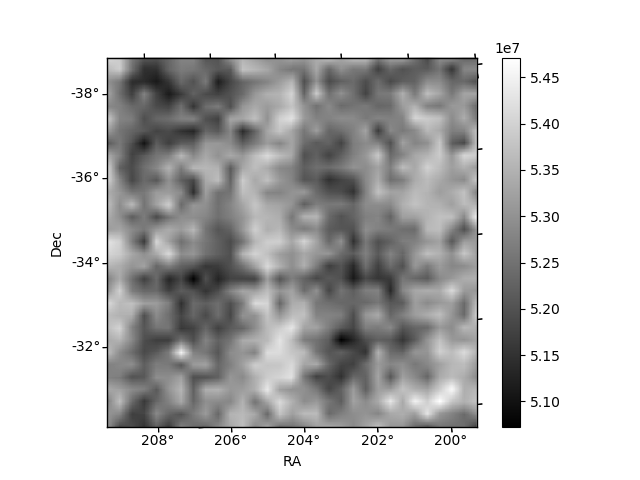
Histogram calculated using DETX and DETY for each event in the final _common_clean file
| Quadrant A | 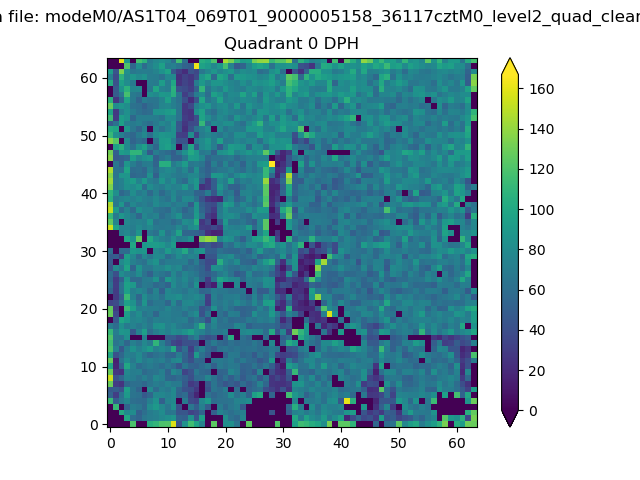 |
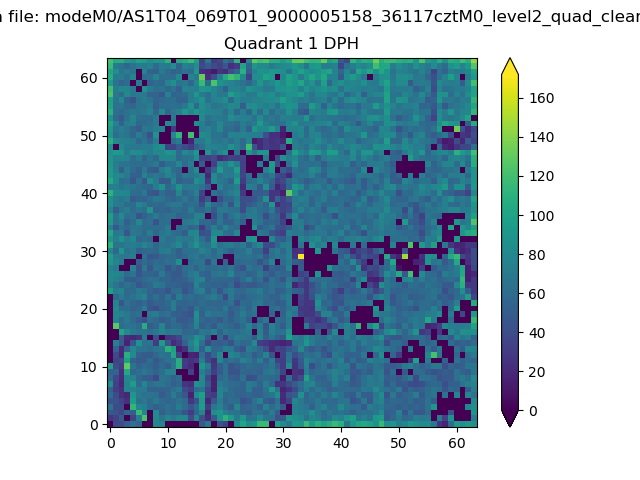 |
Quadrant B |
|---|---|---|---|
| Quadrant D | 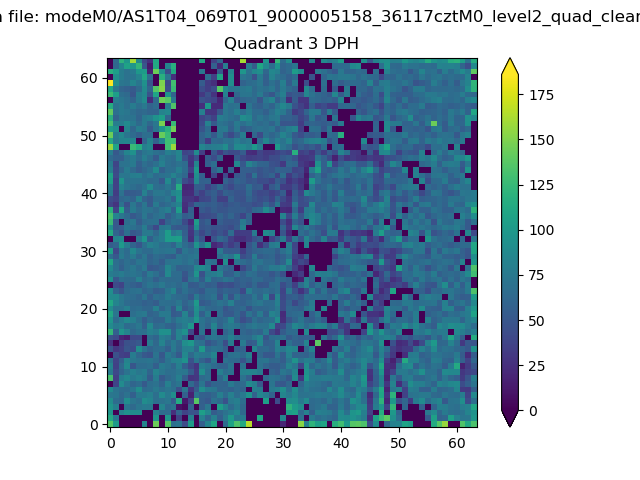 |
 |
Quadrant C |
| Plot type | Count rate plots | Images |
|---|---|---|
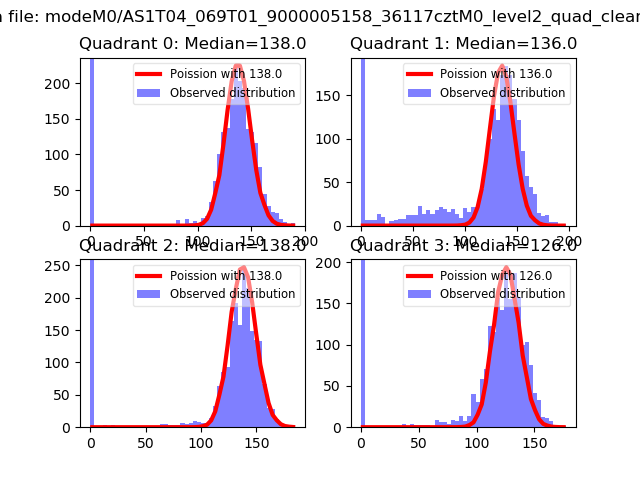
| Comparison with Poisson distribution Blue bars denote a histogram of data divided into 1 sec bins. Red curve is a Poisson curve with rate = median count rate of data. |
 |
 |
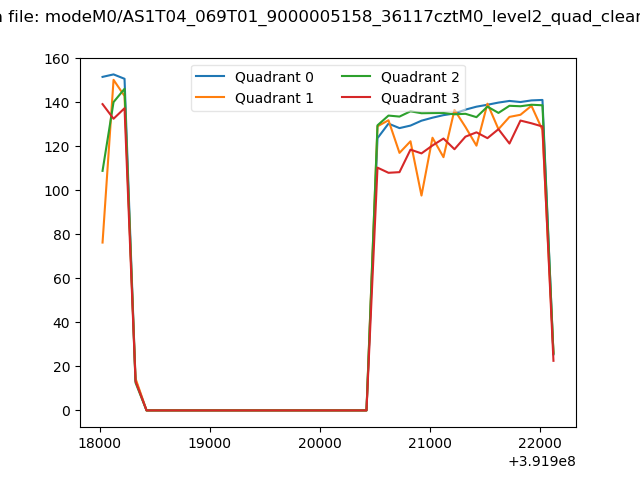
| Quadrant-wise count rates Data is divided into 100 sec bins |
 |
|
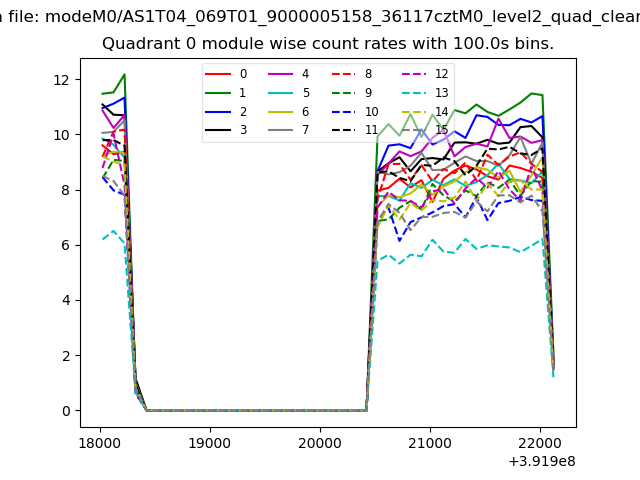
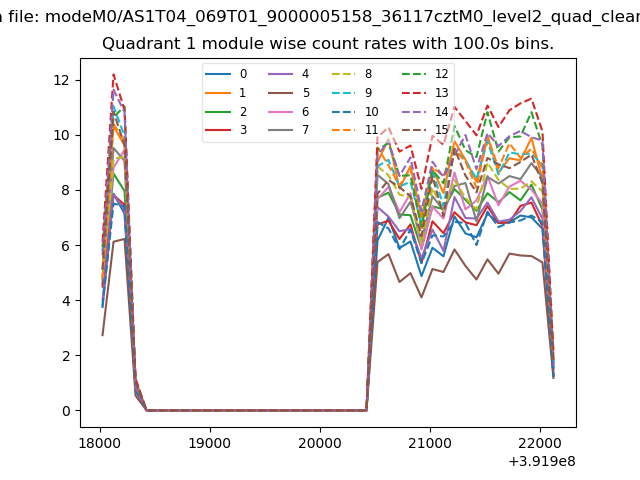
| Module-wise count rates for Quadrant A Data is divided into 100 sec bins |
 |
 |
| Module-wise count rates for Quadrant B Data is divided into 100 sec bins |
 |
 |
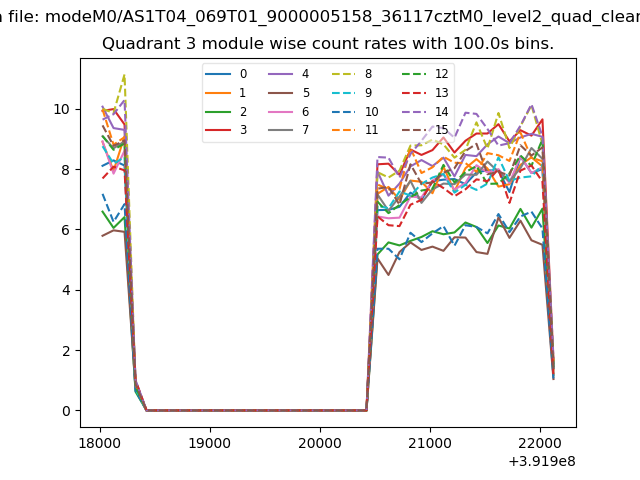
| Module-wise count rates for Quadrant C Data is divided into 100 sec bins |
 |
 |
| Module-wise count rates for Quadrant D Data is divided into 100 sec bins |
 |
 |
| Parameter | Plot |
|---|---|
| CZT HV Monitor |  |
| D_VDD | 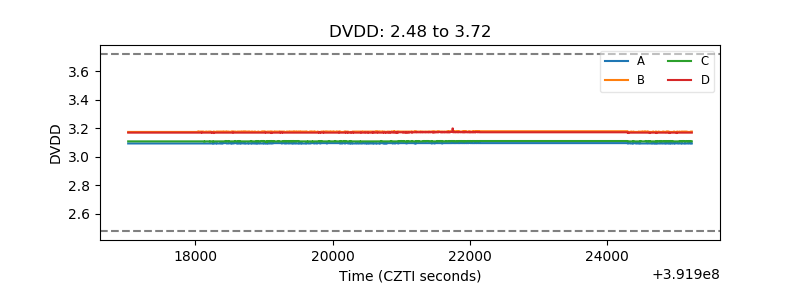 |
| Temperature 1 | 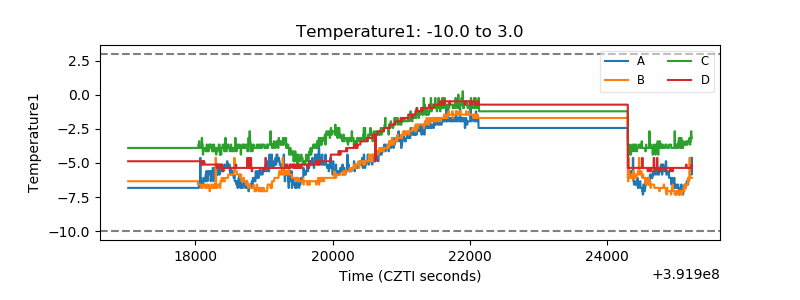 |
| Veto HV Monitor | 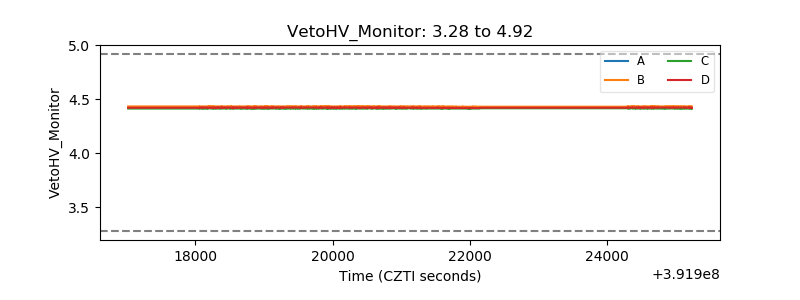 |
| Veto LLD | 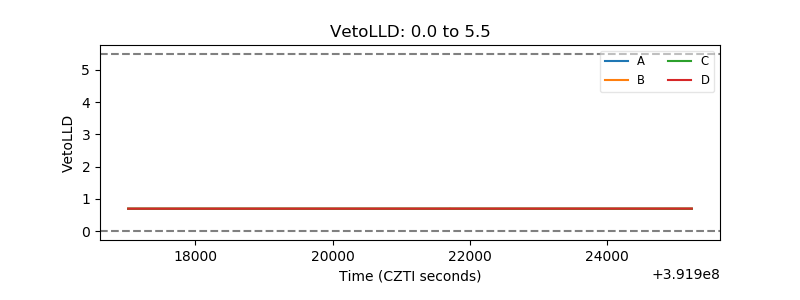 |
| Alpha Counter | 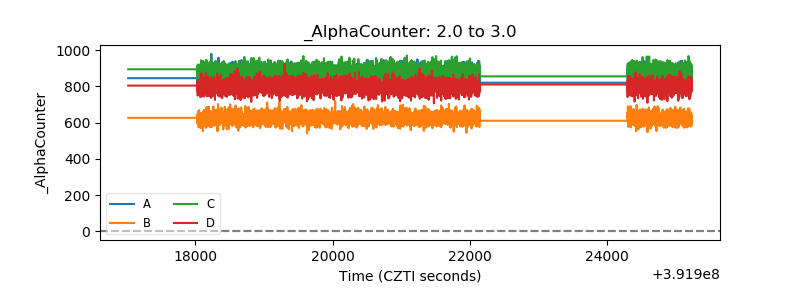 |
| _CPM_Rate | 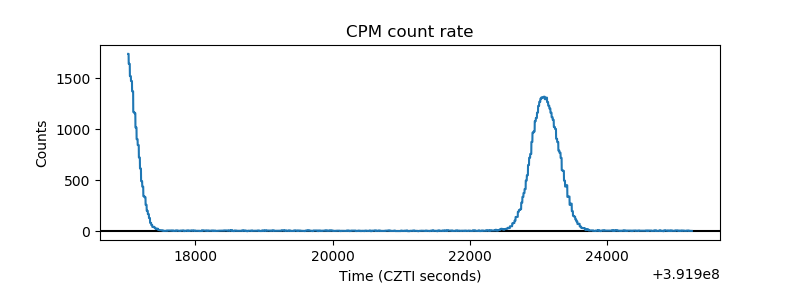 |
| CZT Counter | 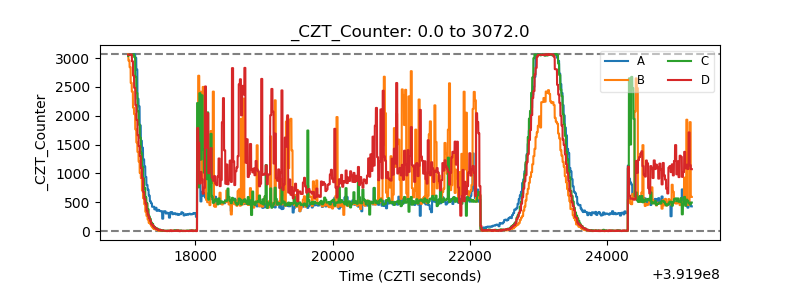 |
| +2.5 Volts monitor | 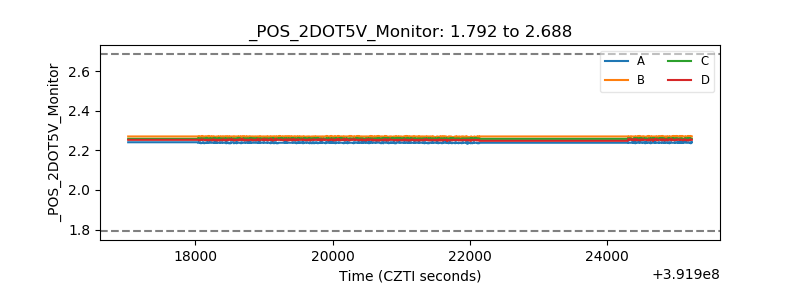 |
| +5 Volts monitor | 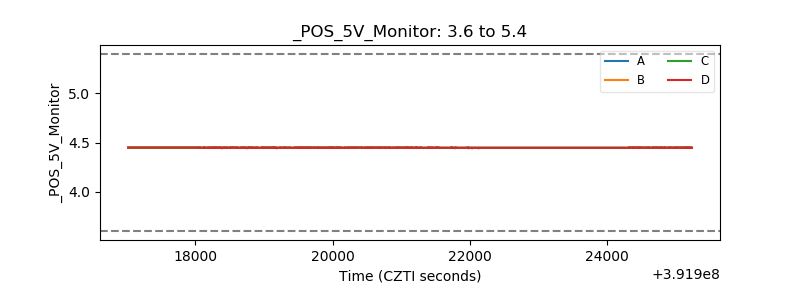 |
| _ROLL_ROT | 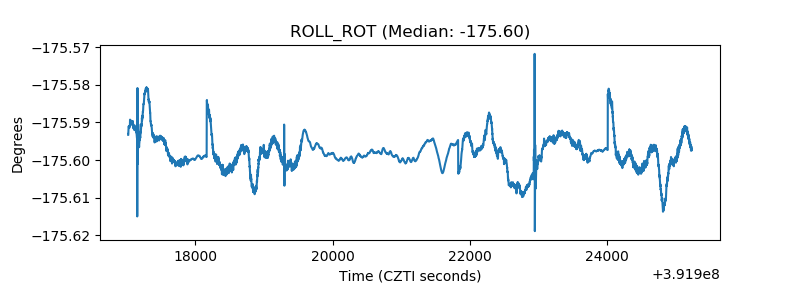 |
| _Roll_DEC | 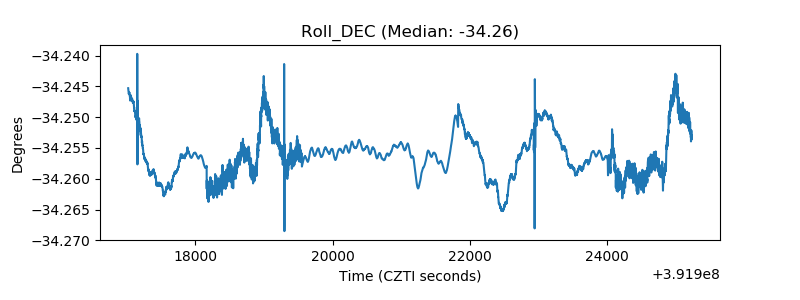 |
| _Roll_RA | 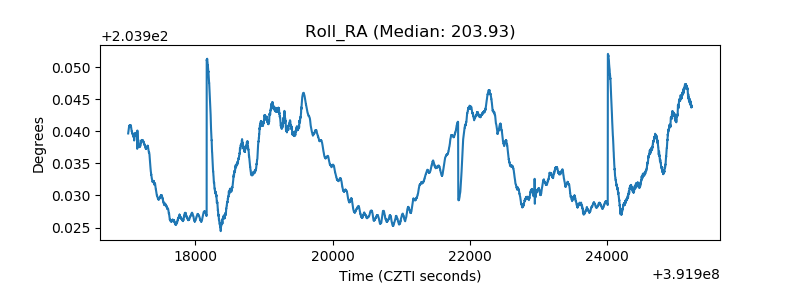 |
| Veto Counter | 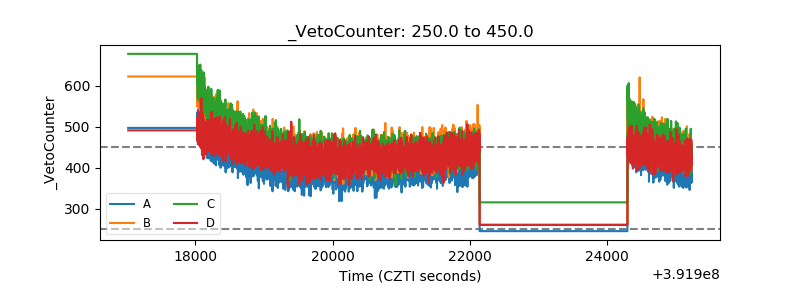 |