| Param | Original file | Final file |
|---|---|---|
| Filename | modeM0/AS1T04_069T01_9000005158_36115cztM0_level2.evt | modeM0/AS1T04_069T01_9000005158_36115cztM0_level2_quad_clean.evt |
| Size (bytes) | 457,588,800 | 62,729,280 |
| Size | 436.4 MB | 59.8 MB |
| Events in quadrant A | 2,525,252 | 404,075 |
| Events in quadrant B | 3,000,769 | 408,540 |
| Events in quadrant C | 2,764,717 | 393,243 |
| Events in quadrant D | 5,227,486 | 342,073 |
| Mode M0 | |||
|---|---|---|---|
| Quadrant | BADHDUFLAG | Total packets | Discarded packets |
| A | 0 | 10509 | 3 |
| B | 0 | 12027 | 2 |
| C | 0 | 10991 | 2 |
| D | 0 | 18865 | 2 |
| Mode M9 | |||
|---|---|---|---|
| Quadrant | BADHDUFLAG | Total packets | Discarded packets |
| A | 0 | 28 | 0 |
| B | 0 | 28 | 0 |
| C | 0 | 28 | 0 |
| D | 0 | 29 | 0 |
| Mode SS | |||
|---|---|---|---|
| Quadrant | BADHDUFLAG | Total packets | Discarded packets |
| A | 0 | 102 | 0 |
| B | 0 | 102 | 0 |
| C | 0 | 102 | 0 |
| D | 0 | 102 | 0 |
| Quadrant | Total seconds | Saturated seconds | Saturation percentage |
|---|---|---|---|
| A | 5006 | 9 | 0.179784% |
| B | 5006 | 89 | 1.777867% |
| C | 5006 | 55 | 1.098682% |
| D | 5006 | 808 | 16.140631% |
Noise dominated data is calculated using 1-second bins in cleaned event files. If a bin has >2000 counts, and if more than 50% of those come from <1% of pixels, then it is considered to be noise-dominated and hence unusable.
| Quadrant | # 1 sec bins | Bins with >0 counts | Bins with >2000 counts | High rate bins dominated by noise | Noise dominated (total time) | Noise dominated (detector-on time) | Marked lightcurve |
|---|---|---|---|---|---|---|---|
| A | 7009 | 5007 | 1 | 1 | 0.01% | 0.02% | 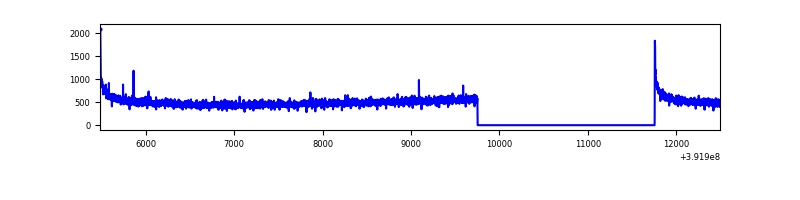 |
| B | 7009 | 5007 | 51 | 51 | 0.73% | 1.02% | 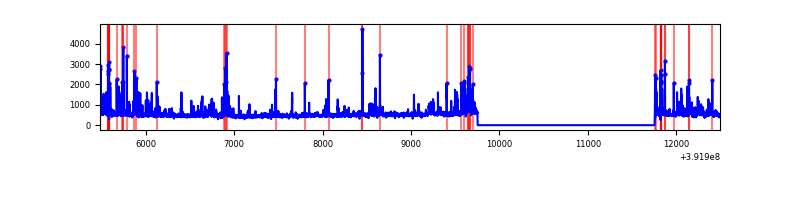 |
| C | 7009 | 5007 | 51 | 51 | 0.73% | 1.02% | 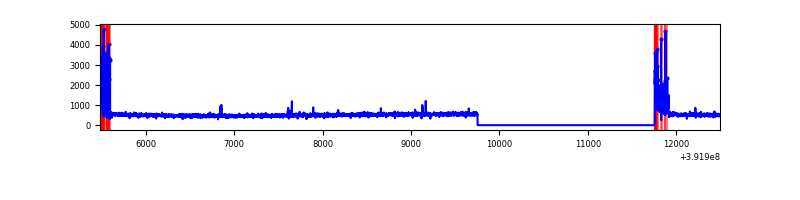 |
| D | 7009 | 5007 | 870 | 870 | 12.41% | 17.38% | 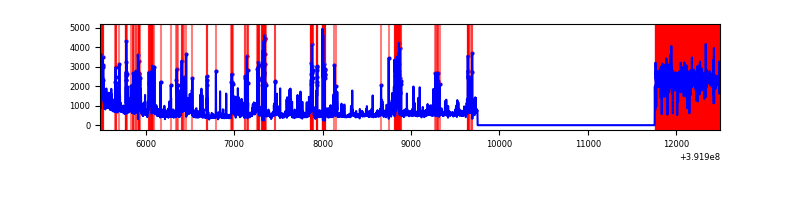 |
Top three noisy pixels from each quadrant. If the there are fewer than three noisy pixels in the level2.evt file, extra rows are filled as -1
| Pixel properties | Quadrant properties | ||||||
|---|---|---|---|---|---|---|---|
| Quadrant | DetID | PixID | Counts | Sigma | Mean | Median | Sigma |
| A | 10 | 83 | 164092 | 1333.14 | 607 | 598 | 122.6 |
| A | 13 | 6 | 11145 | 86.0 | 607 | 598 | 122.6 |
| A | 13 | 254 | 7587 | 56.99 | 607 | 598 | 122.6 |
| B | 5 | 172 | 301116 | 2595.25 | 604 | 588 | 115.8 |
| B | 5 | 236 | 165063 | 1420.35 | 604 | 588 | 115.8 |
| B | 0 | 213 | 118256 | 1016.14 | 604 | 588 | 115.8 |
| C | 0 | 10 | 241165 | 1759.44 | 587 | 591 | 136.7 |
| C | 15 | 214 | 222111 | 1620.09 | 587 | 591 | 136.7 |
| C | 1 | 23 | 6062 | 40.01 | 587 | 591 | 136.7 |
| D | 10 | 203 | 1428223 | 10444.48 | 556 | 540 | 136.7 |
| D | 1 | 52 | 881173 | 6442.44 | 556 | 540 | 136.7 |
| D | 12 | 17 | 174517 | 1272.76 | 556 | 540 | 136.7 |
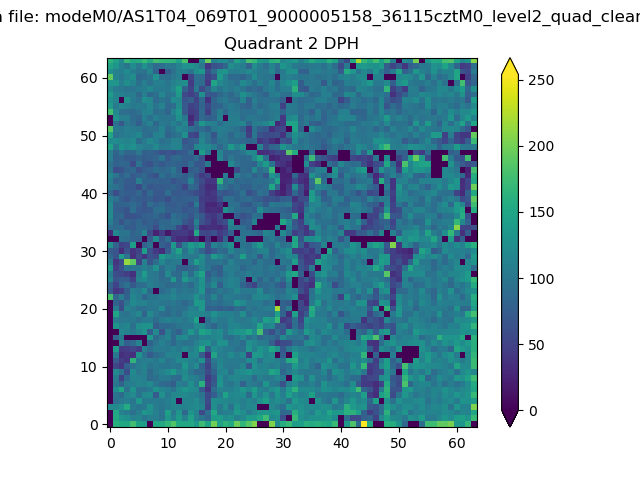
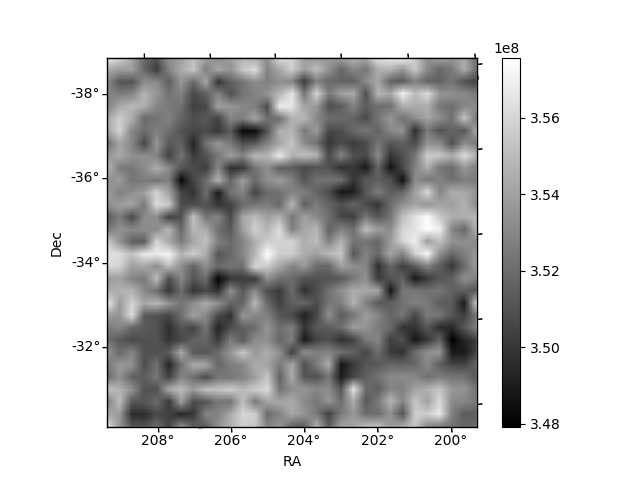
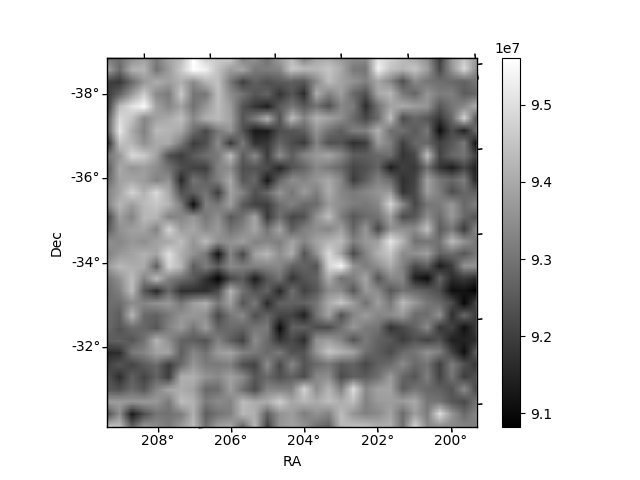
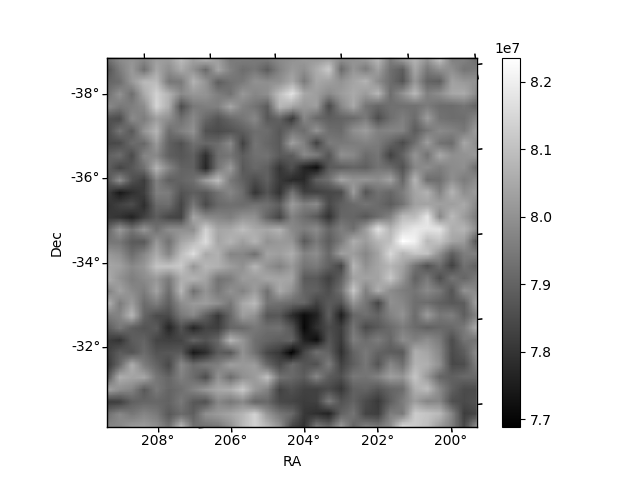
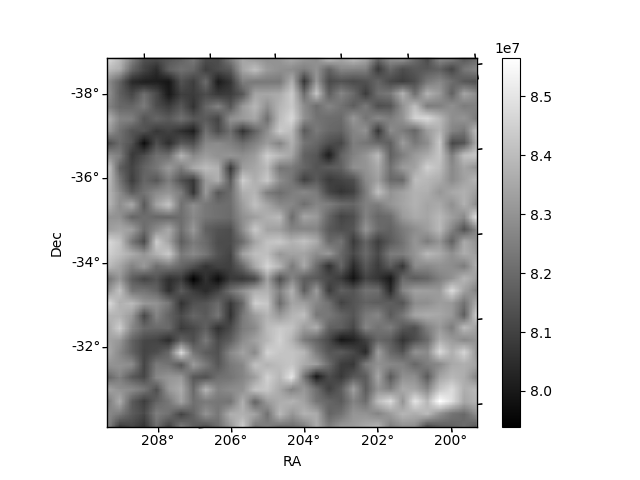
Histogram calculated using DETX and DETY for each event in the final _common_clean file
| Quadrant A | 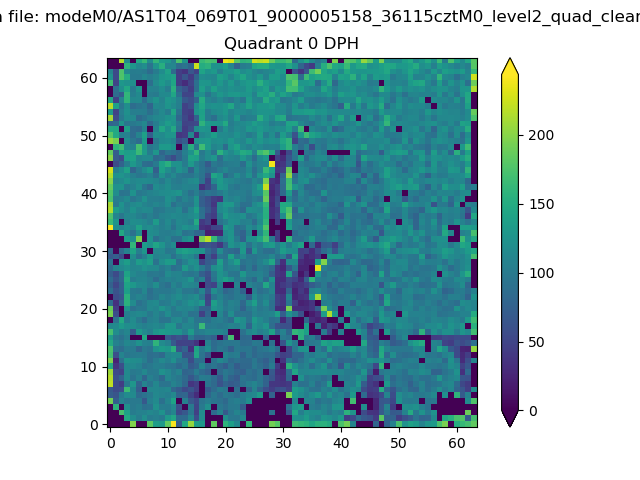 |
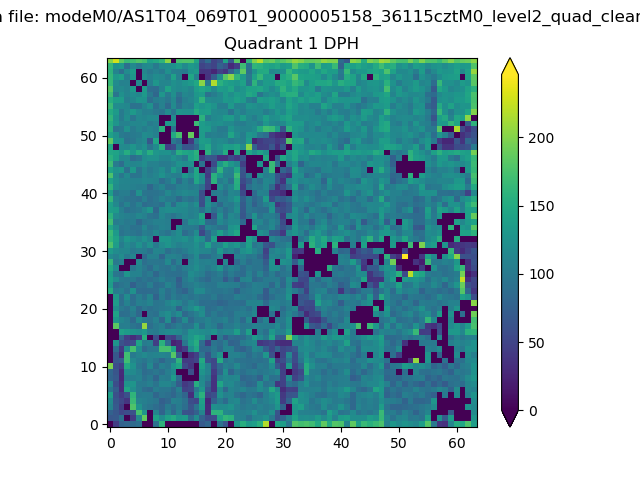 |
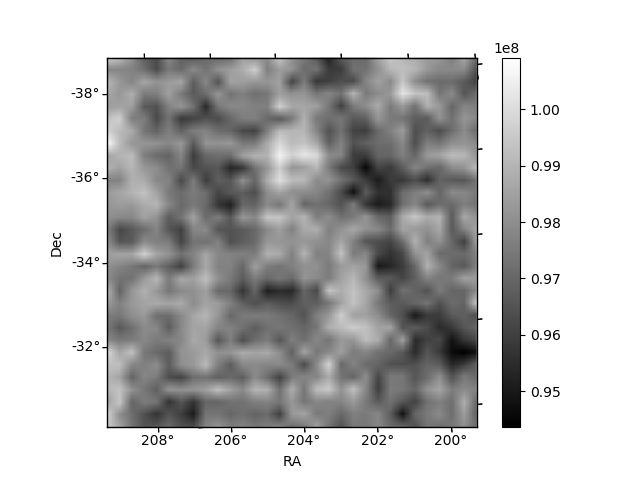
Quadrant B |
|---|---|---|---|
| Quadrant D | 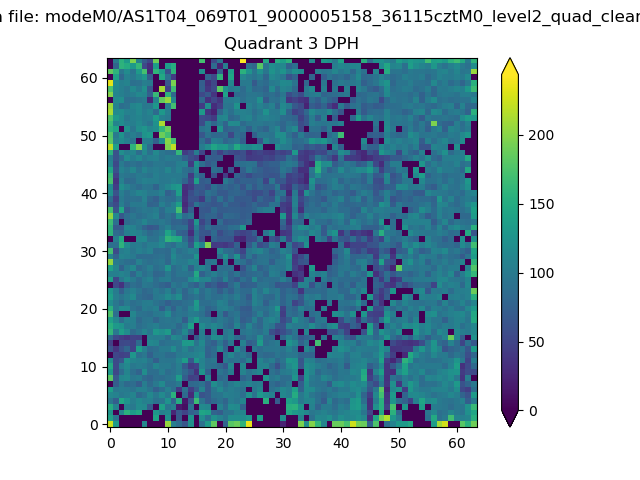 |
 |
Quadrant C |
| Plot type | Count rate plots | Images |
|---|---|---|
| Comparison with Poisson distribution Blue bars denote a histogram of data divided into 1 sec bins. Red curve is a Poisson curve with rate = median count rate of data. |
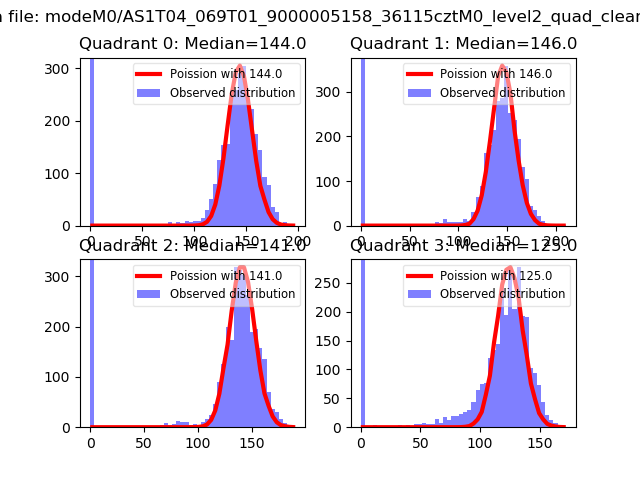 |
 |
| Quadrant-wise count rates Data is divided into 100 sec bins |
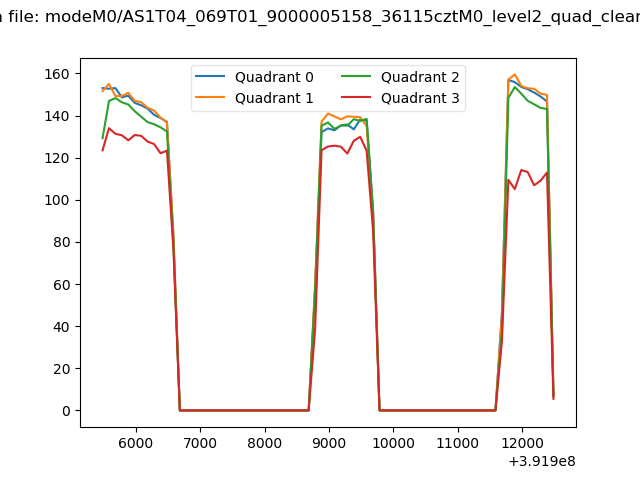 |
|
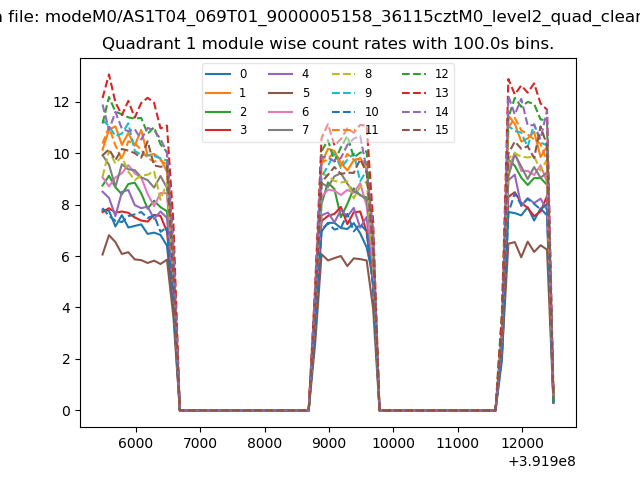
| Module-wise count rates for Quadrant A Data is divided into 100 sec bins |
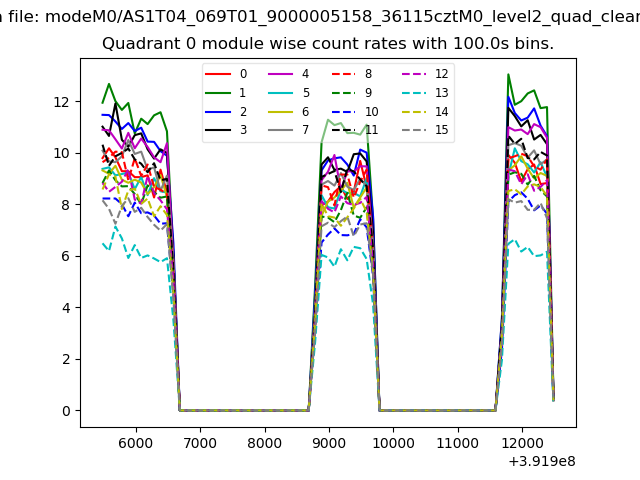 |
 |
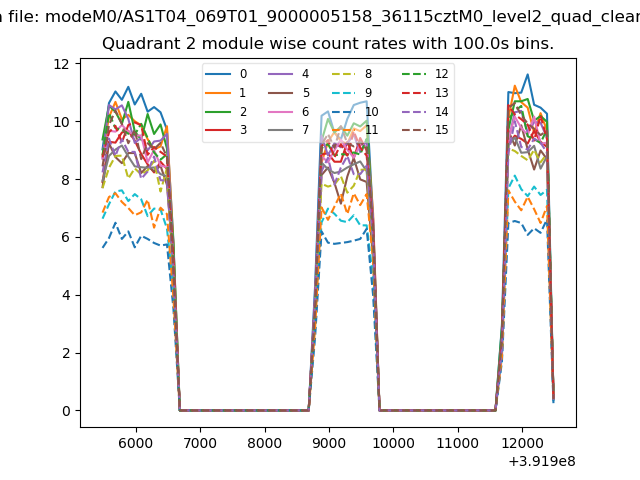
| Module-wise count rates for Quadrant B Data is divided into 100 sec bins |
 |
 |
| Module-wise count rates for Quadrant C Data is divided into 100 sec bins |
 |
 |
| Module-wise count rates for Quadrant D Data is divided into 100 sec bins |
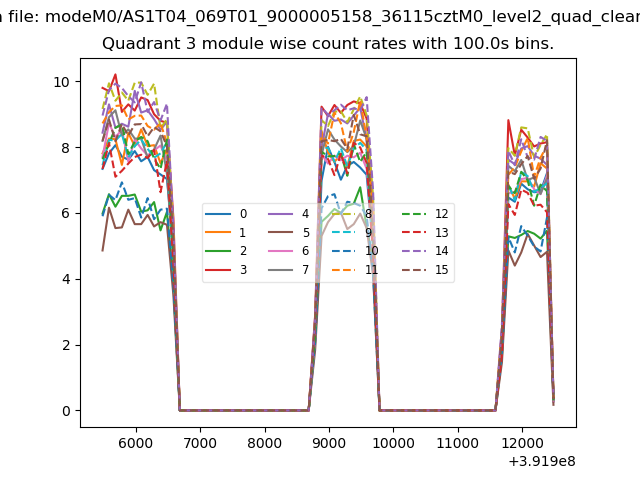 |
 |
| Parameter | Plot |
|---|---|
| CZT HV Monitor |  |
| D_VDD | 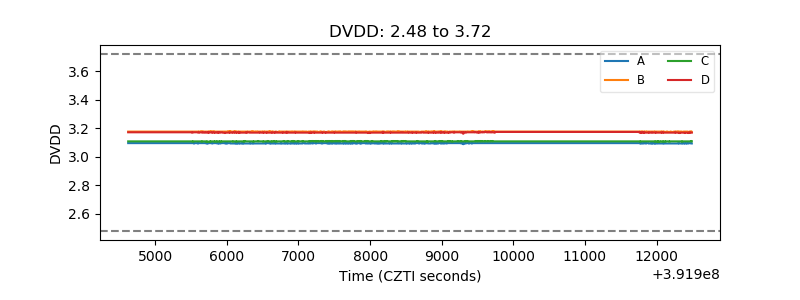 |
| Temperature 1 | 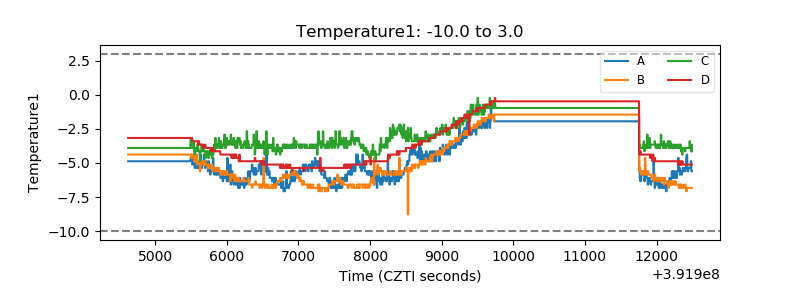 |
| Veto HV Monitor | 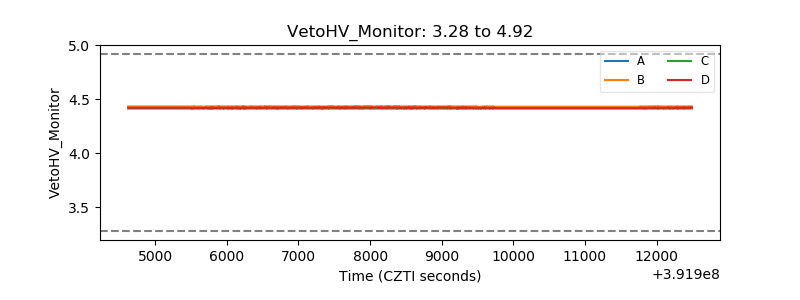 |
| Veto LLD | 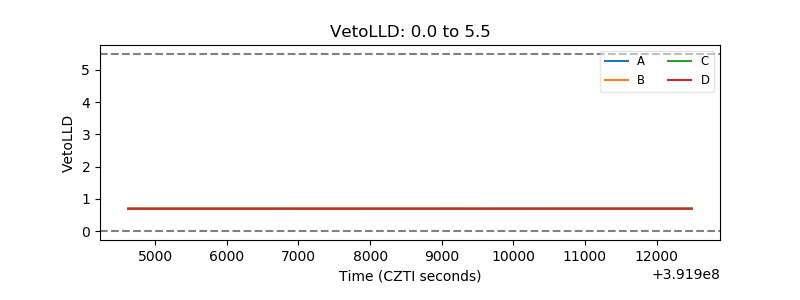 |
| Alpha Counter | 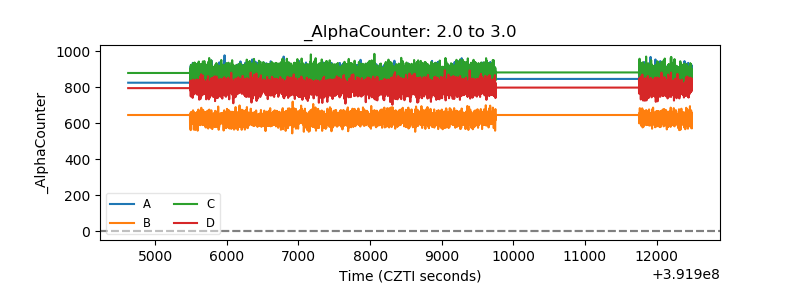 |
| _CPM_Rate | 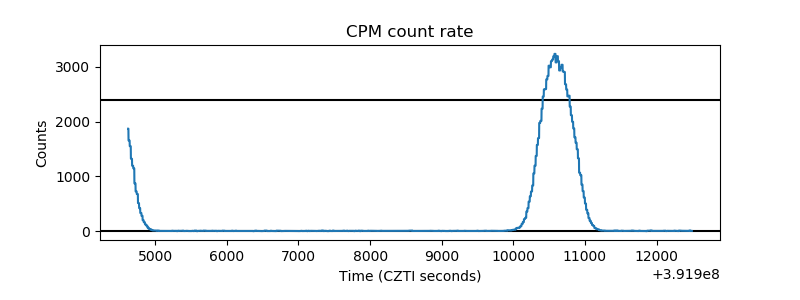 |
| CZT Counter | 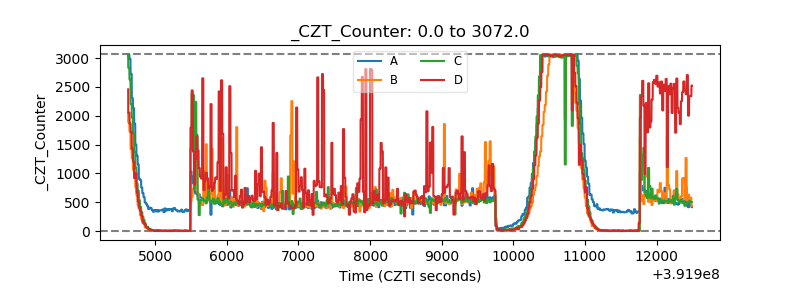 |
| +2.5 Volts monitor | 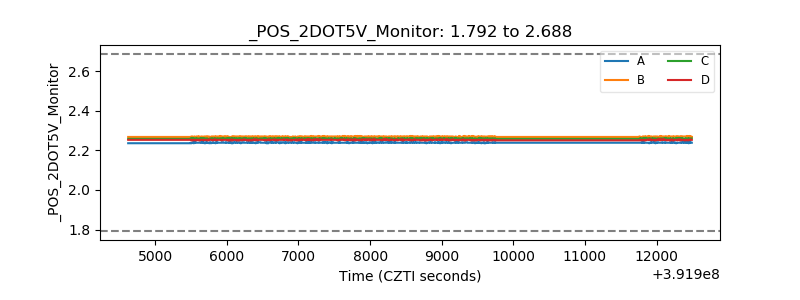 |
| +5 Volts monitor | 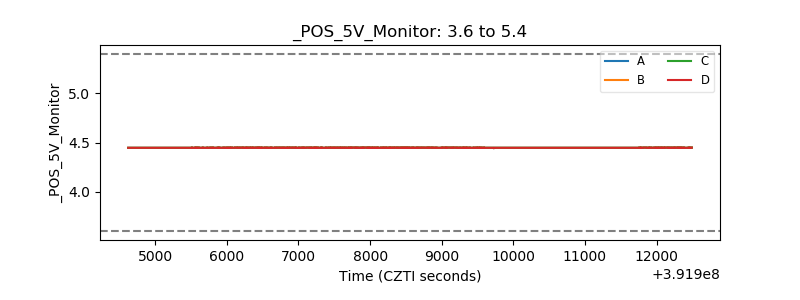 |
| _ROLL_ROT | 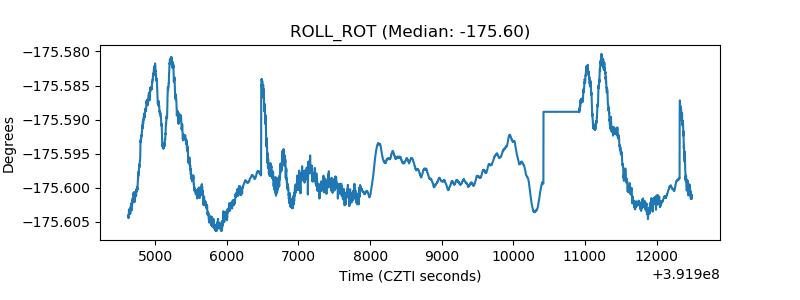 |
| _Roll_DEC | 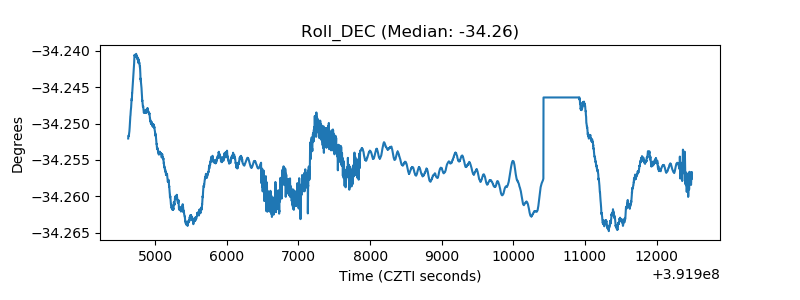 |
| _Roll_RA | 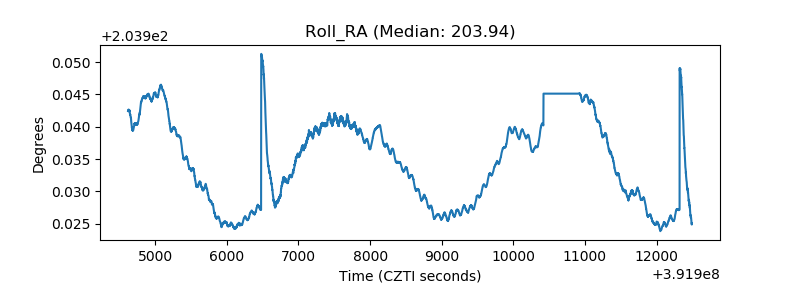 |
| Veto Counter | 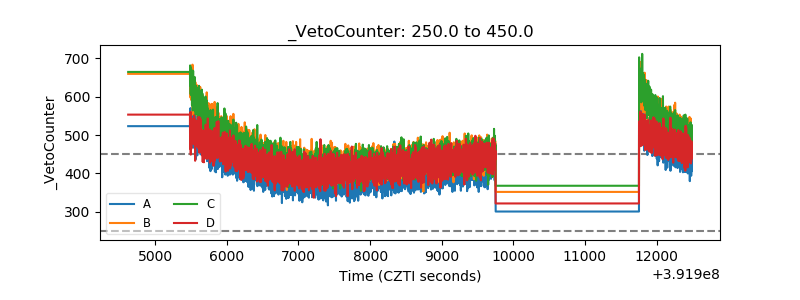 |