| Param | Original file | Final file |
|---|---|---|
| Filename | modeM0/AS1T04_069T01_9000005158_36114cztM0_level2.evt | modeM0/AS1T04_069T01_9000005158_36114cztM0_level2_quad_clean.evt |
| Size (bytes) | 454,475,520 | 61,992,000 |
| Size | 433.4 MB | 59.1 MB |
| Events in quadrant A | 2,522,760 | 401,119 |
| Events in quadrant B | 4,021,960 | 370,144 |
| Events in quadrant C | 2,987,995 | 384,812 |
| Events in quadrant D | 3,884,833 | 362,968 |
| Mode M0 | |||
|---|---|---|---|
| Quadrant | BADHDUFLAG | Total packets | Discarded packets |
| A | 0 | 10677 | 3 |
| B | 0 | 15242 | 2 |
| C | 0 | 11913 | 2 |
| D | 0 | 14907 | 2 |
| Mode M9 | |||
|---|---|---|---|
| Quadrant | BADHDUFLAG | Total packets | Discarded packets |
| A | 0 | 27 | 0 |
| B | 0 | 27 | 0 |
| C | 0 | 27 | 0 |
| D | 0 | 28 | 0 |
| Mode SS | |||
|---|---|---|---|
| Quadrant | BADHDUFLAG | Total packets | Discarded packets |
| A | 0 | 104 | 0 |
| B | 0 | 104 | 0 |
| C | 0 | 104 | 0 |
| D | 0 | 104 | 0 |
| Quadrant | Total seconds | Saturated seconds | Saturation percentage |
|---|---|---|---|
| A | 5102 | 9 | 0.176401% |
| B | 5102 | 558 | 10.936887% |
| C | 5102 | 72 | 1.411211% |
| D | 5102 | 181 | 3.547628% |
Noise dominated data is calculated using 1-second bins in cleaned event files. If a bin has >2000 counts, and if more than 50% of those come from <1% of pixels, then it is considered to be noise-dominated and hence unusable.
| Quadrant | # 1 sec bins | Bins with >0 counts | Bins with >2000 counts | High rate bins dominated by noise | Noise dominated (total time) | Noise dominated (detector-on time) | Marked lightcurve |
|---|---|---|---|---|---|---|---|
| A | 6984 | 5103 | 2 | 2 | 0.03% | 0.04% | 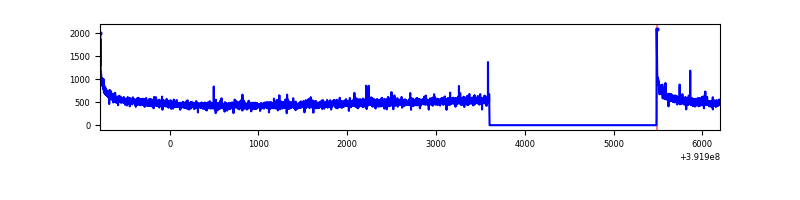 |
| B | 6984 | 5103 | 447 | 447 | 6.40% | 8.76% | 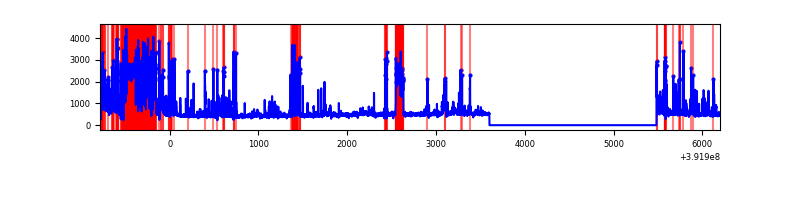 |
| C | 6984 | 5103 | 64 | 64 | 0.92% | 1.25% | 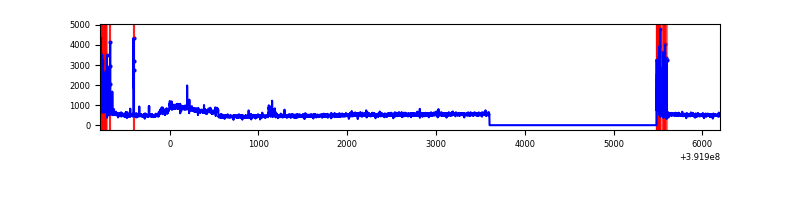 |
| D | 6984 | 5103 | 165 | 165 | 2.36% | 3.23% | 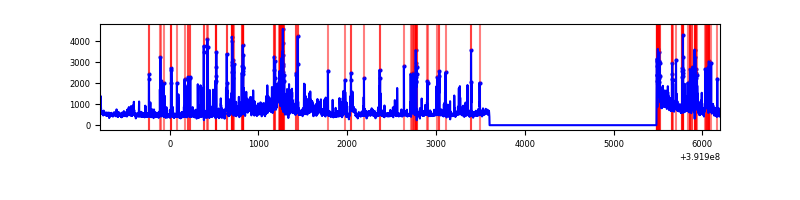 |
Top three noisy pixels from each quadrant. If the there are fewer than three noisy pixels in the level2.evt file, extra rows are filled as -1
| Pixel properties | Quadrant properties | ||||||
|---|---|---|---|---|---|---|---|
| Quadrant | DetID | PixID | Counts | Sigma | Mean | Median | Sigma |
| A | 10 | 83 | 168226 | 1374.6 | 603 | 594 | 121.9 |
| A | 13 | 6 | 12101 | 94.36 | 603 | 594 | 121.9 |
| A | 13 | 254 | 8020 | 60.89 | 603 | 594 | 121.9 |
| B | 5 | 172 | 1275626 | 11574.75 | 571 | 556 | 110.2 |
| B | 5 | 236 | 426108 | 3863.05 | 571 | 556 | 110.2 |
| B | 0 | 213 | 29694 | 264.51 | 571 | 556 | 110.2 |
| C | 0 | 10 | 246723 | 1814.96 | 579 | 583 | 135.6 |
| C | 1 | 23 | 234288 | 1723.26 | 579 | 583 | 135.6 |
| C | 15 | 214 | 230084 | 1692.27 | 579 | 583 | 135.6 |
| D | 1 | 52 | 678731 | 4807.09 | 572 | 557 | 141.1 |
| D | 12 | 17 | 360102 | 2548.56 | 572 | 557 | 141.1 |
| D | 12 | 6 | 191074 | 1350.44 | 572 | 557 | 141.1 |
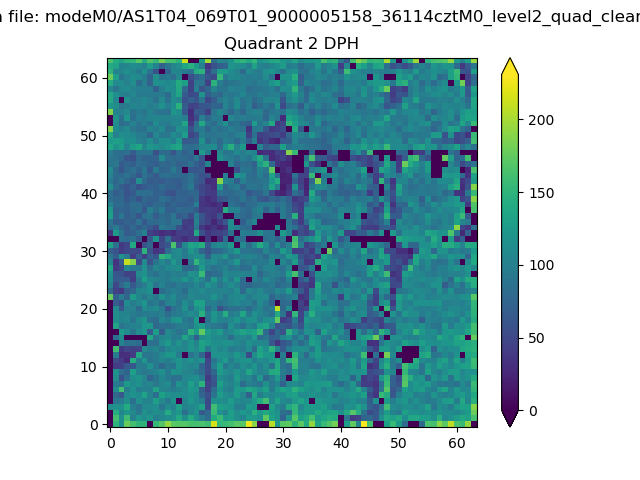
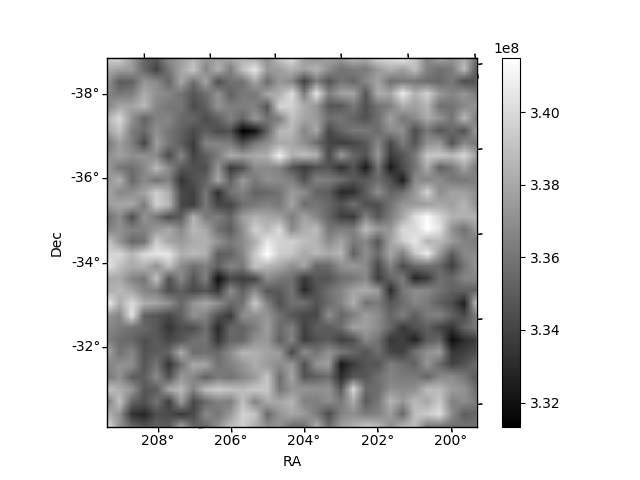
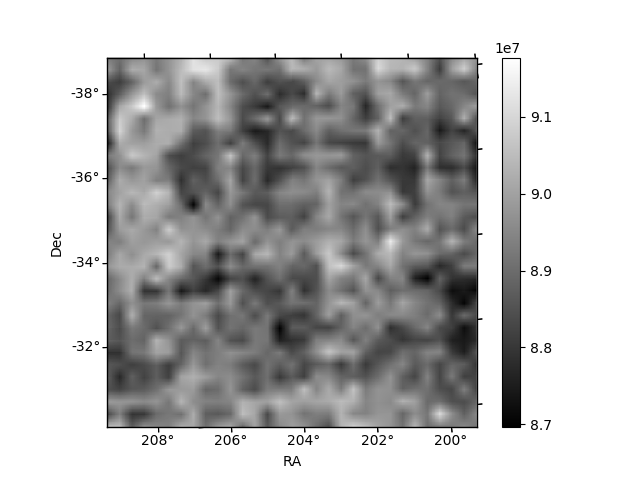
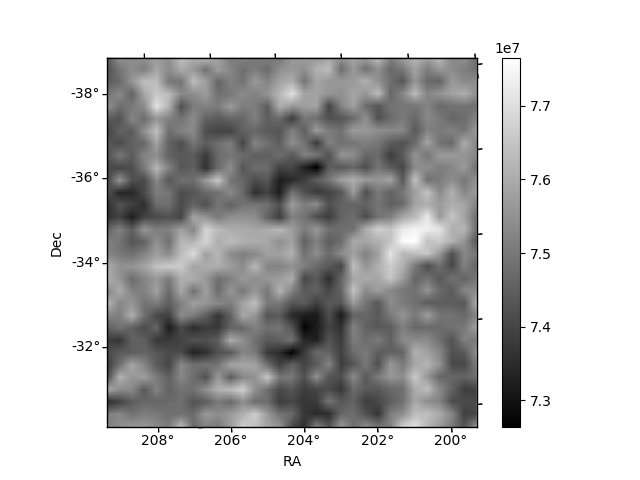
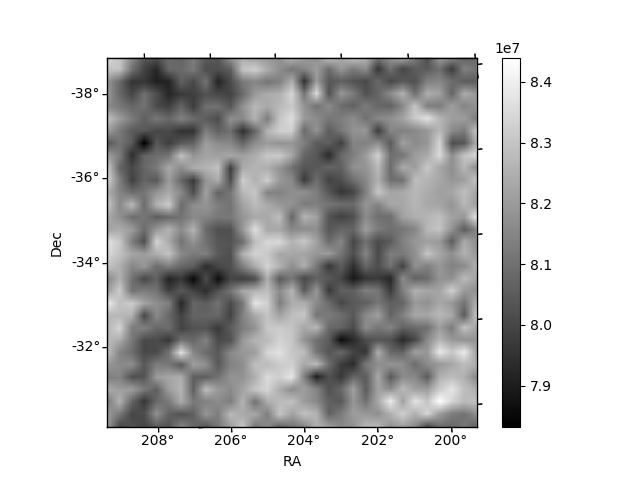
Histogram calculated using DETX and DETY for each event in the final _common_clean file
| Quadrant A | 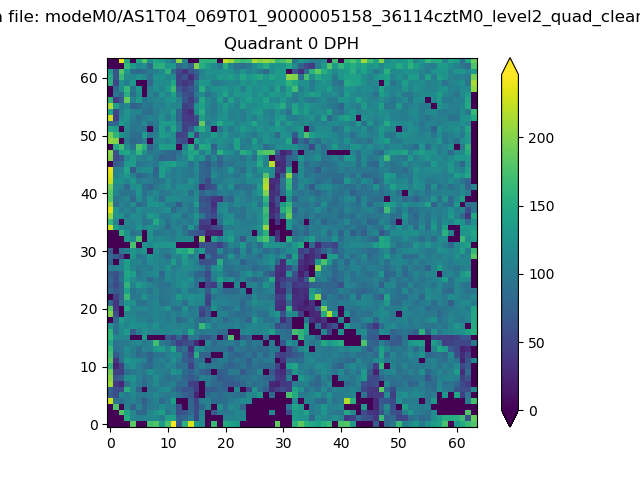 |
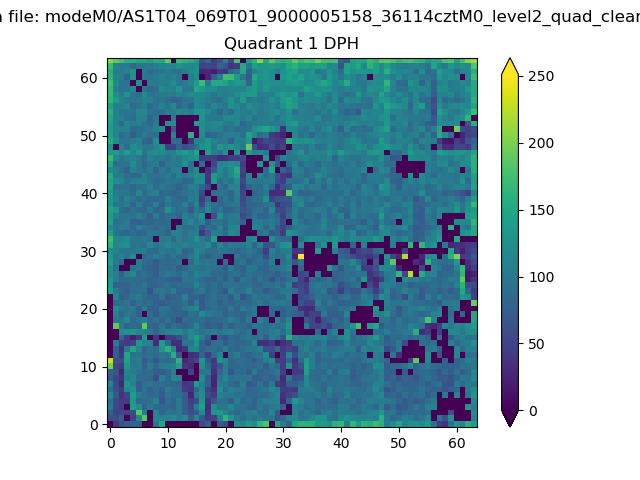 |
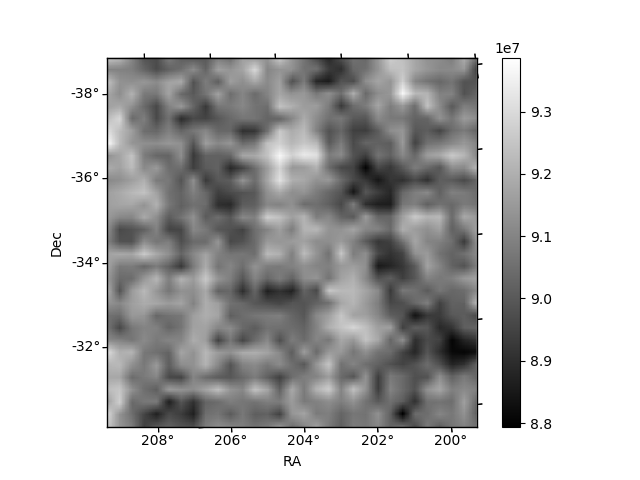
Quadrant B |
|---|---|---|---|
| Quadrant D | 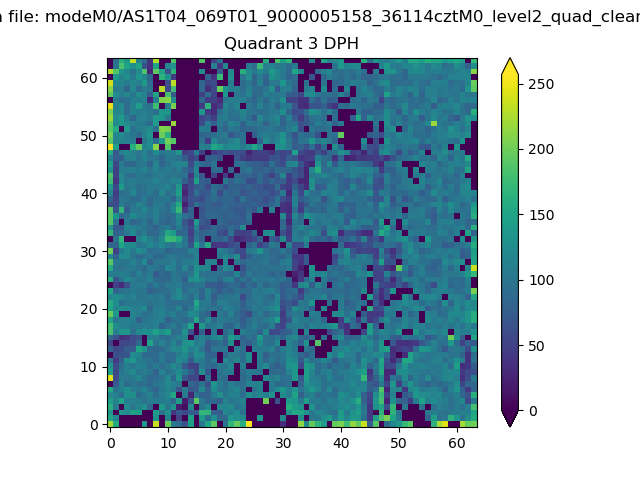 |
 |
Quadrant C |
| Plot type | Count rate plots | Images |
|---|---|---|
| Comparison with Poisson distribution Blue bars denote a histogram of data divided into 1 sec bins. Red curve is a Poisson curve with rate = median count rate of data. |
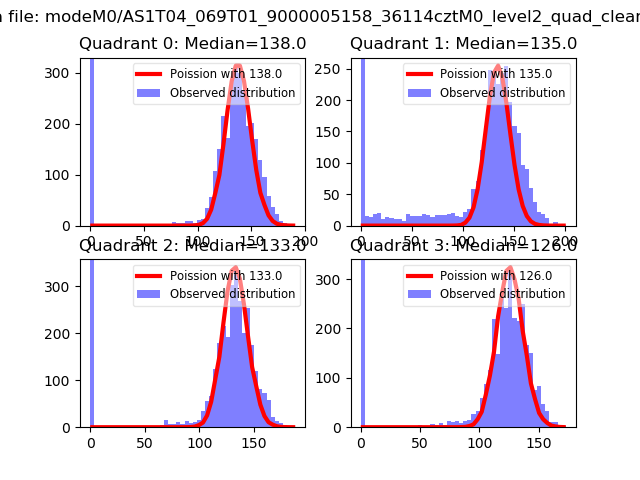 |
 |
| Quadrant-wise count rates Data is divided into 100 sec bins |
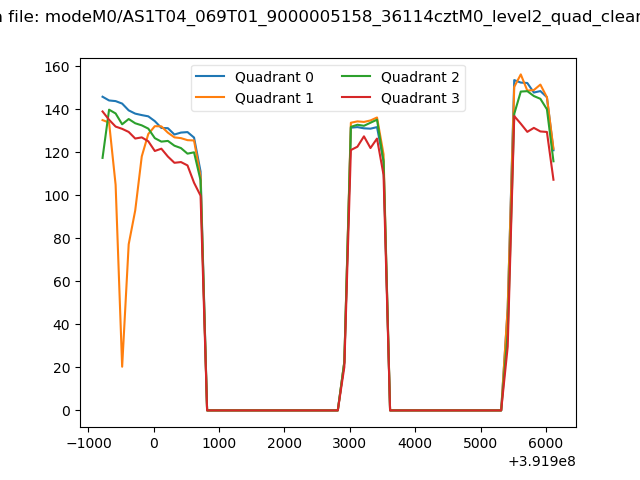 |
|
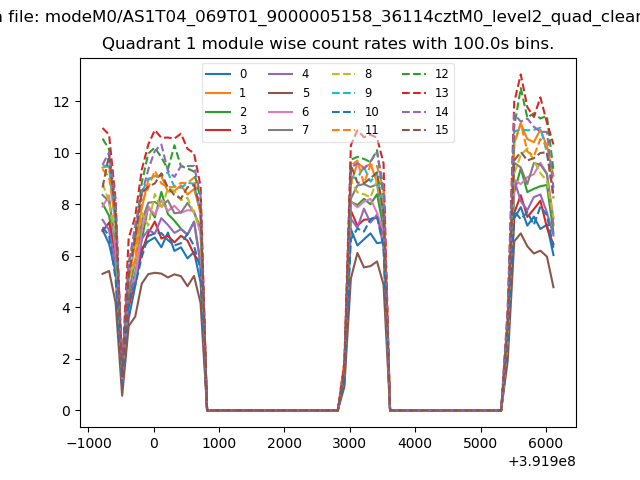
| Module-wise count rates for Quadrant A Data is divided into 100 sec bins |
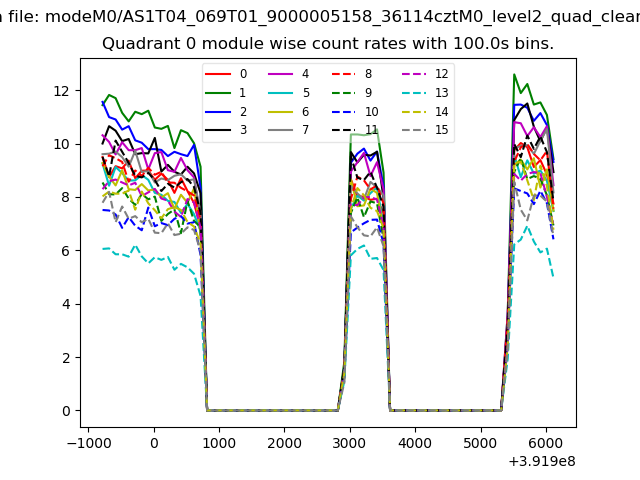 |
 |
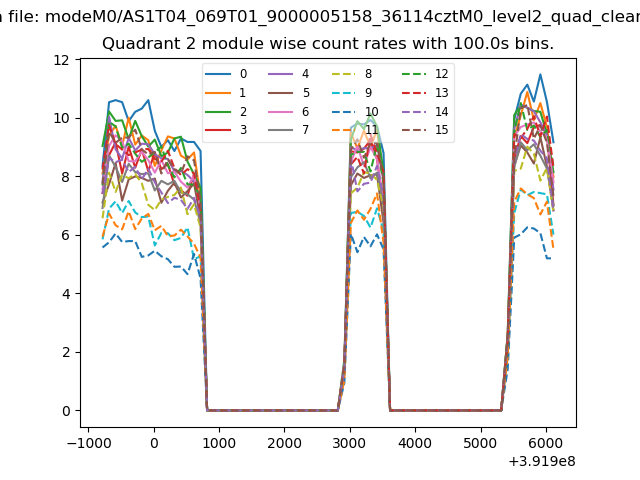
| Module-wise count rates for Quadrant B Data is divided into 100 sec bins |
 |
 |
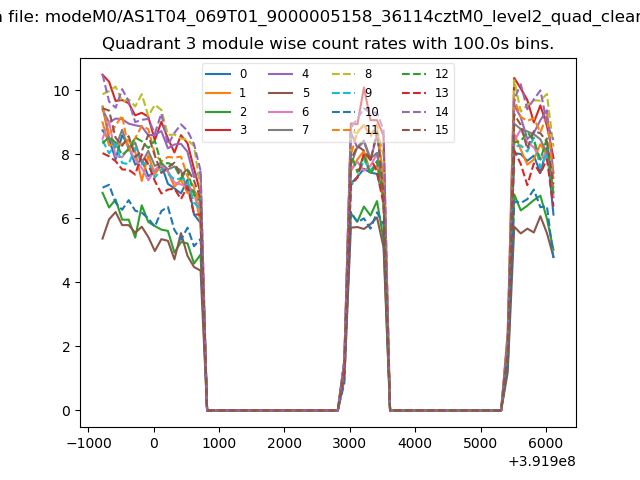
| Module-wise count rates for Quadrant C Data is divided into 100 sec bins |
 |
 |
| Module-wise count rates for Quadrant D Data is divided into 100 sec bins |
 |
 |
| Parameter | Plot |
|---|---|
| CZT HV Monitor |  |
| D_VDD | 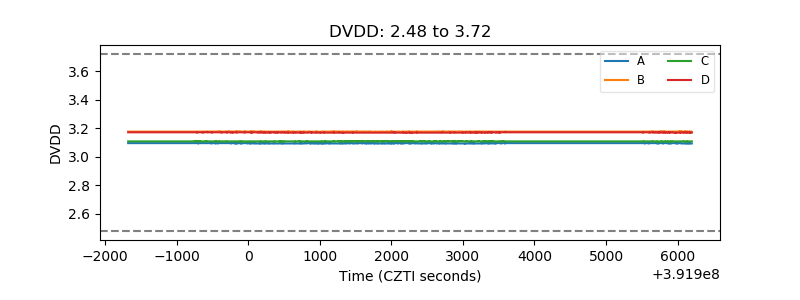 |
| Temperature 1 | 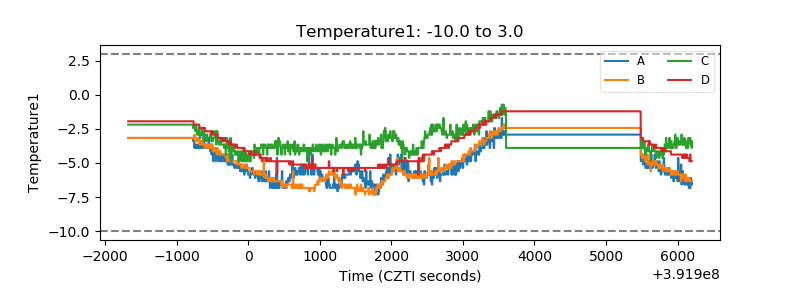 |
| Veto HV Monitor | 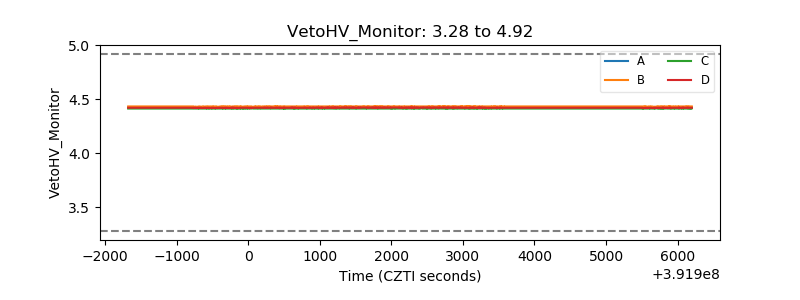 |
| Veto LLD | 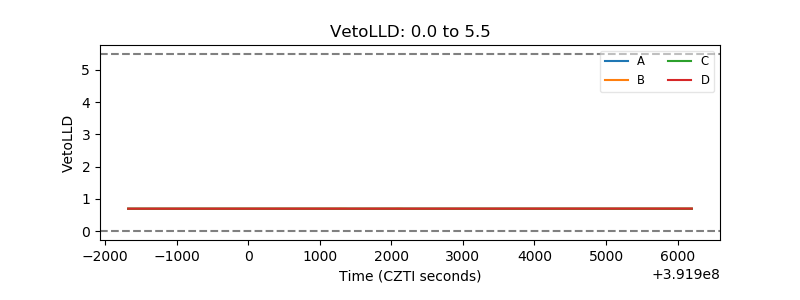 |
| Alpha Counter | 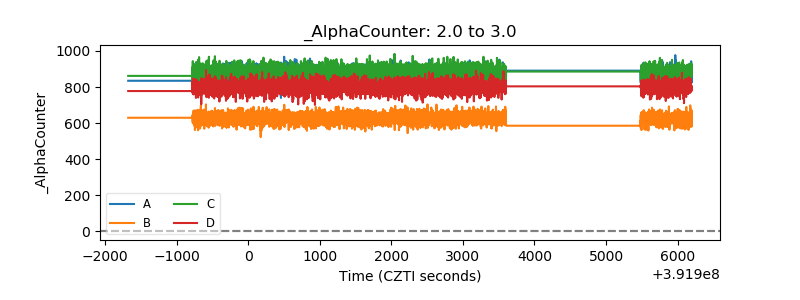 |
| _CPM_Rate | 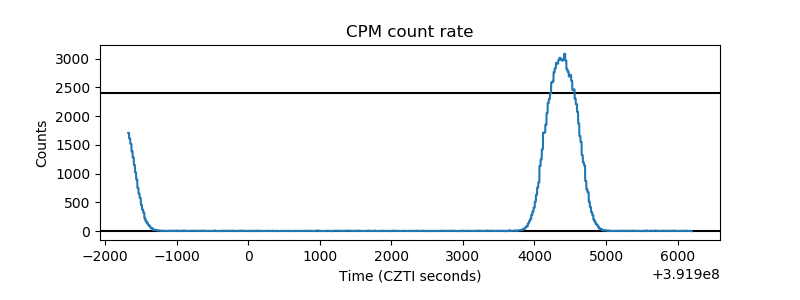 |
| CZT Counter | 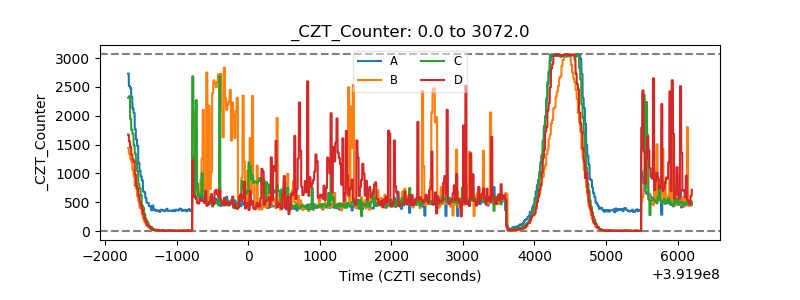 |
| +2.5 Volts monitor | 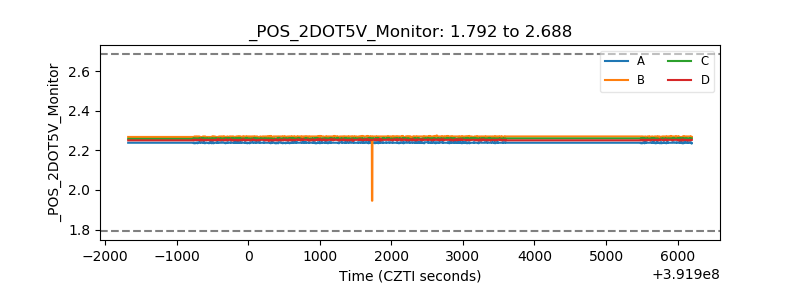 |
| +5 Volts monitor | 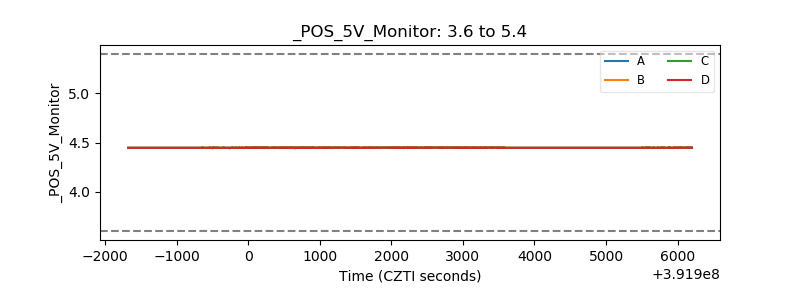 |
| _ROLL_ROT | 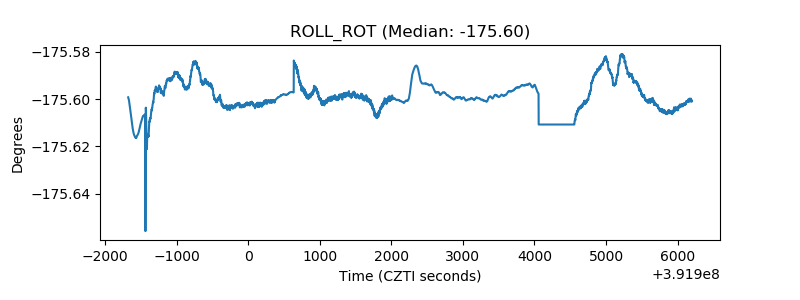 |
| _Roll_DEC | 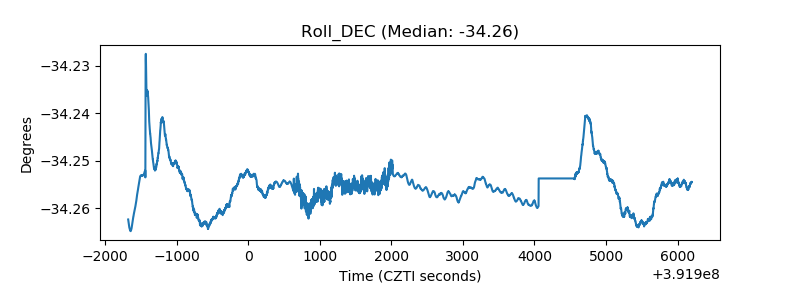 |
| _Roll_RA | 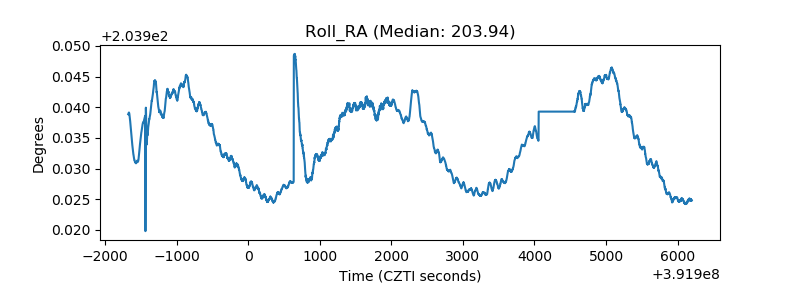 |
| Veto Counter | 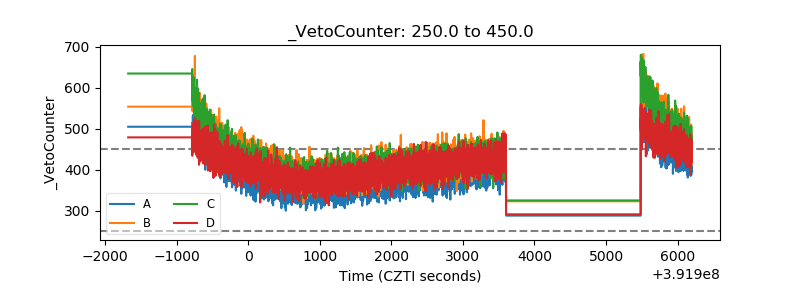 |