| Param | Original file | Final file |
|---|---|---|
| Filename | modeM0/AS1T04_069T01_9000005158_36113cztM0_level2.evt | modeM0/AS1T04_069T01_9000005158_36113cztM0_level2_quad_clean.evt |
| Size (bytes) | 511,485,120 | 61,525,440 |
| Size | 487.8 MB | 58.7 MB |
| Events in quadrant A | 2,589,948 | 409,009 |
| Events in quadrant B | 3,966,492 | 370,868 |
| Events in quadrant C | 3,333,713 | 386,171 |
| Events in quadrant D | 5,240,135 | 324,708 |
| Mode M0 | |||
|---|---|---|---|
| Quadrant | BADHDUFLAG | Total packets | Discarded packets |
| A | 0 | 11111 | 3 |
| B | 0 | 15243 | 2 |
| C | 0 | 13346 | 2 |
| D | 0 | 19208 | 2 |
| Mode M9 | |||
|---|---|---|---|
| Quadrant | BADHDUFLAG | Total packets | Discarded packets |
| A | 0 | 27 | 0 |
| B | 0 | 27 | 0 |
| C | 0 | 27 | 0 |
| D | 0 | 28 | 0 |
| Mode SS | |||
|---|---|---|---|
| Quadrant | BADHDUFLAG | Total packets | Discarded packets |
| A | 0 | 108 | 0 |
| B | 0 | 108 | 0 |
| C | 0 | 108 | 0 |
| D | 0 | 108 | 0 |
| Quadrant | Total seconds | Saturated seconds | Saturation percentage |
|---|---|---|---|
| A | 5308 | 16 | 0.301432% |
| B | 5308 | 511 | 9.626978% |
| C | 5308 | 78 | 1.469480% |
| D | 5308 | 871 | 16.409194% |
Noise dominated data is calculated using 1-second bins in cleaned event files. If a bin has >2000 counts, and if more than 50% of those come from <1% of pixels, then it is considered to be noise-dominated and hence unusable.
| Quadrant | # 1 sec bins | Bins with >0 counts | Bins with >2000 counts | High rate bins dominated by noise | Noise dominated (total time) | Noise dominated (detector-on time) | Marked lightcurve |
|---|---|---|---|---|---|---|---|
| A | 7072 | 5309 | 3 | 3 | 0.04% | 0.06% | 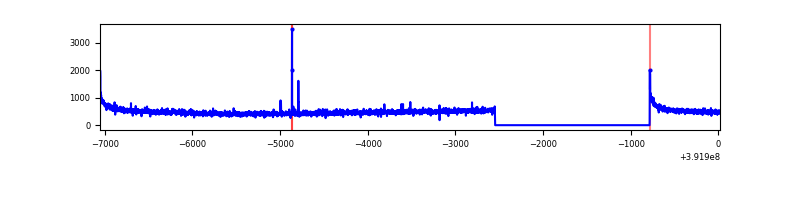 |
| B | 7072 | 5309 | 410 | 410 | 5.80% | 7.72% | 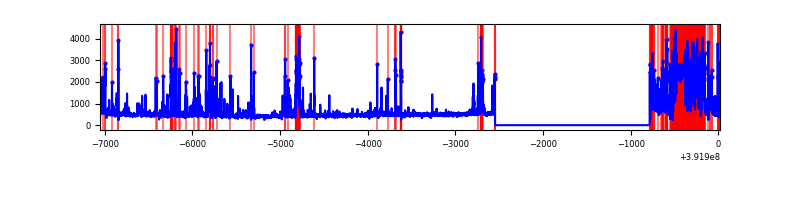 |
| C | 7072 | 5309 | 54 | 54 | 0.76% | 1.02% | 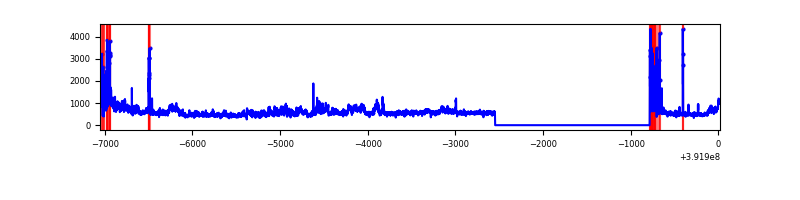 |
| D | 7072 | 5309 | 821 | 821 | 11.61% | 15.46% | 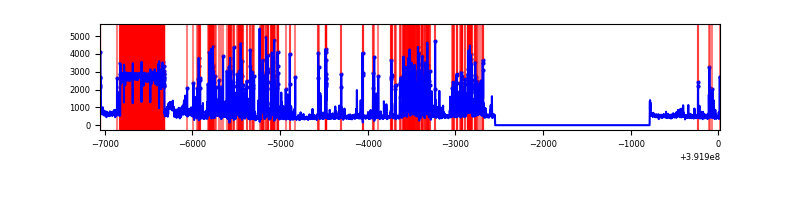 |
Top three noisy pixels from each quadrant. If the there are fewer than three noisy pixels in the level2.evt file, extra rows are filled as -1
| Pixel properties | Quadrant properties | ||||||
|---|---|---|---|---|---|---|---|
| Quadrant | DetID | PixID | Counts | Sigma | Mean | Median | Sigma |
| A | 10 | 83 | 176819 | 1421.32 | 614 | 603 | 124.0 |
| A | 9 | 143 | 13696 | 105.61 | 614 | 603 | 124.0 |
| A | 13 | 6 | 10962 | 83.55 | 614 | 603 | 124.0 |
| B | 5 | 172 | 1210751 | 10780.51 | 581 | 567 | 112.3 |
| B | 5 | 236 | 357375 | 3178.5 | 581 | 567 | 112.3 |
| B | 0 | 213 | 34929 | 306.1 | 581 | 567 | 112.3 |
| C | 0 | 207 | 433772 | 3135.29 | 585 | 590 | 138.2 |
| C | 15 | 214 | 238265 | 1720.25 | 585 | 590 | 138.2 |
| C | 0 | 10 | 219642 | 1585.46 | 585 | 590 | 138.2 |
| D | 10 | 203 | 1177504 | 8901.49 | 536 | 520 | 132.2 |
| D | 12 | 17 | 914710 | 6913.99 | 536 | 520 | 132.2 |
| D | 12 | 6 | 290062 | 2189.8 | 536 | 520 | 132.2 |
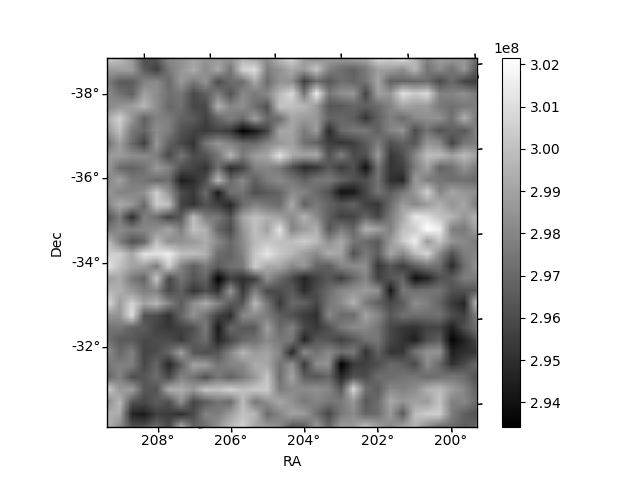
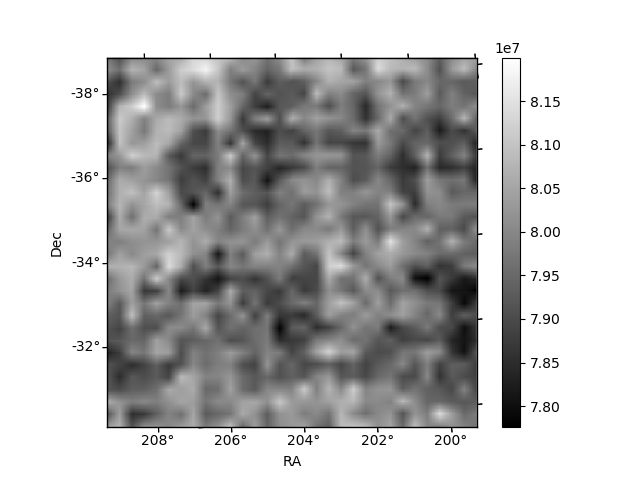
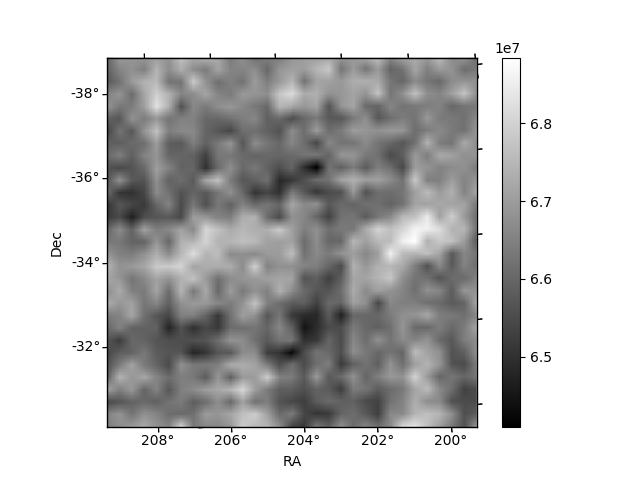
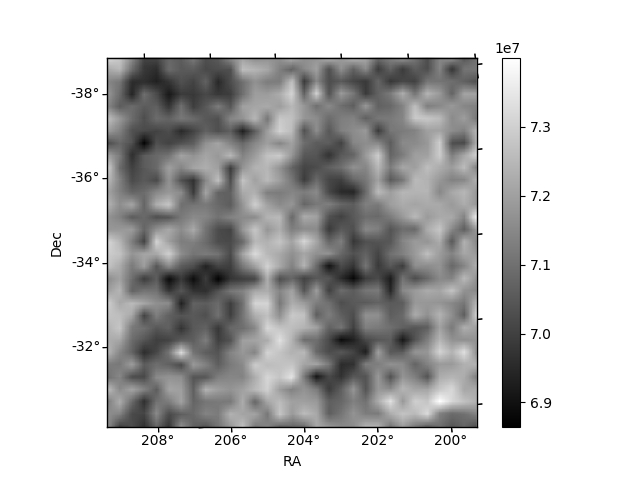
Histogram calculated using DETX and DETY for each event in the final _common_clean file
| Quadrant A | 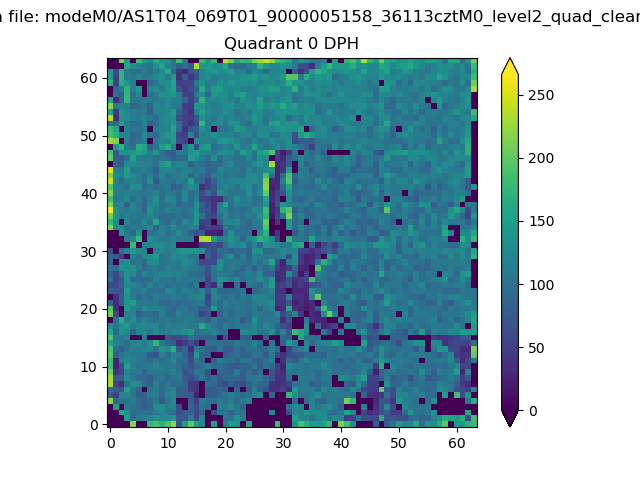 |
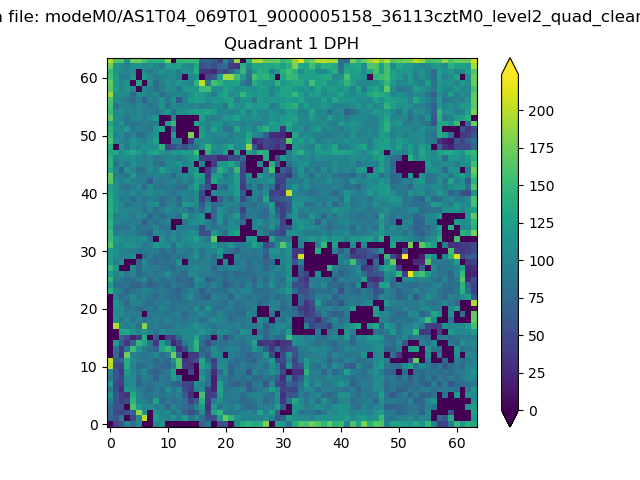 |
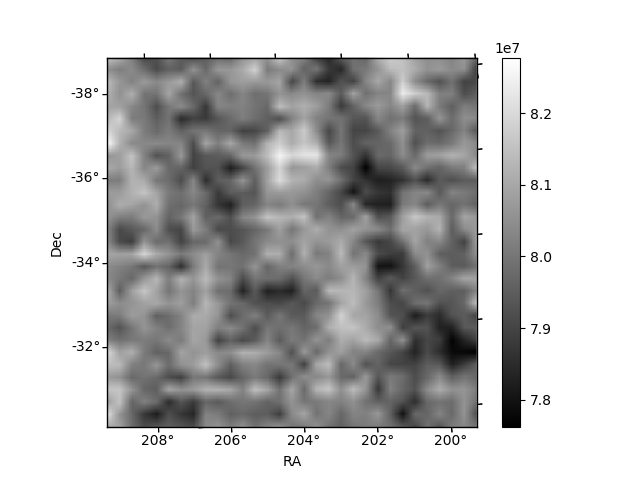
Quadrant B |
|---|---|---|---|
| Quadrant D | 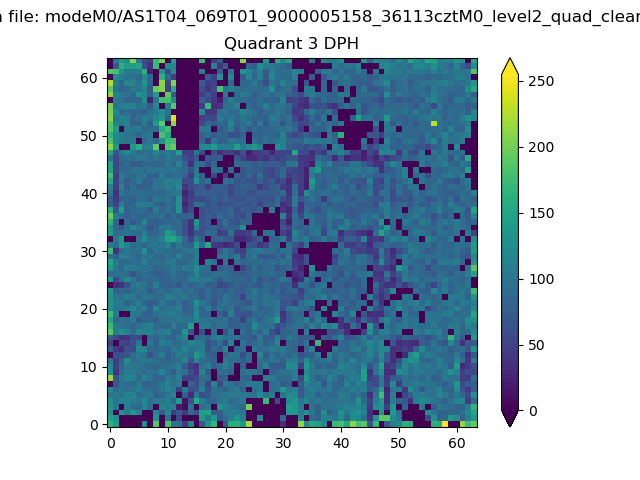 |
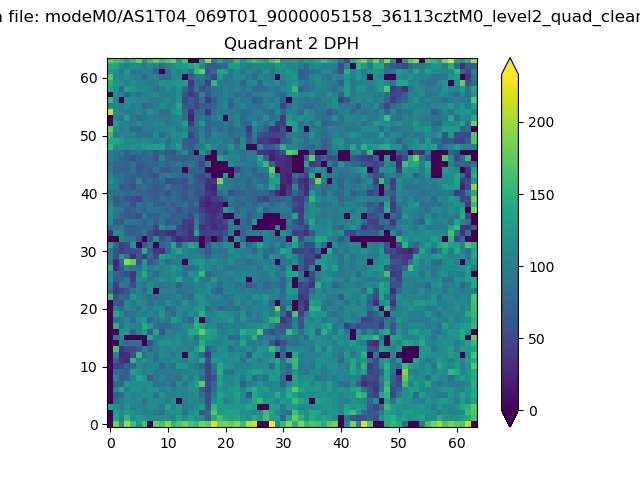 |
Quadrant C |
| Plot type | Count rate plots | Images |
|---|---|---|
| Comparison with Poisson distribution Blue bars denote a histogram of data divided into 1 sec bins. Red curve is a Poisson curve with rate = median count rate of data. |
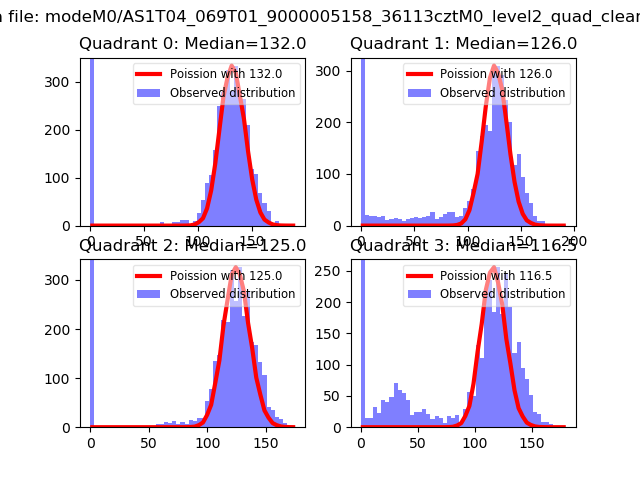 |
 |
| Quadrant-wise count rates Data is divided into 100 sec bins |
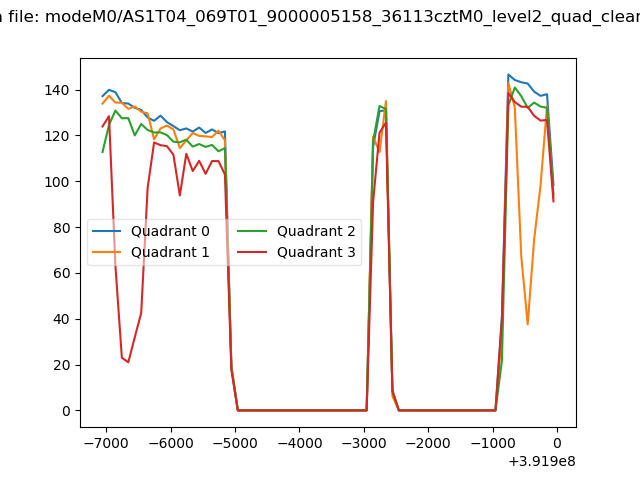 |
|
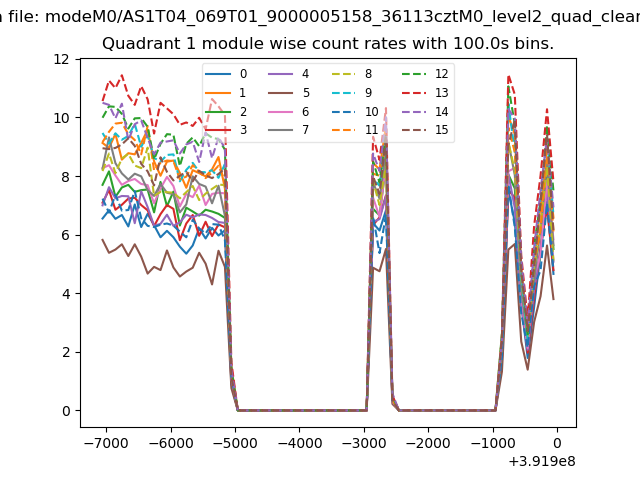
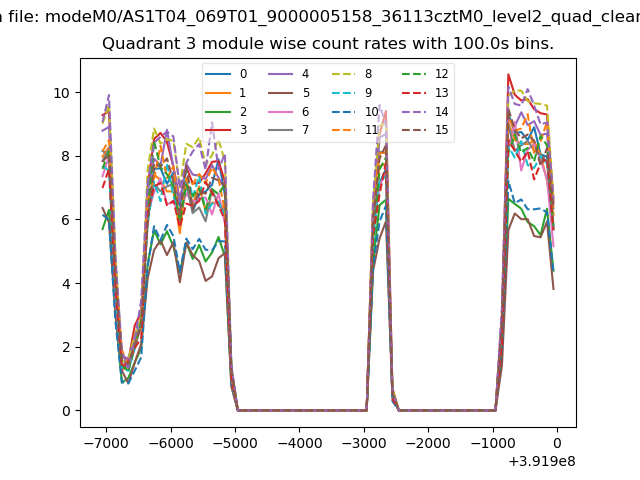
| Module-wise count rates for Quadrant A Data is divided into 100 sec bins |
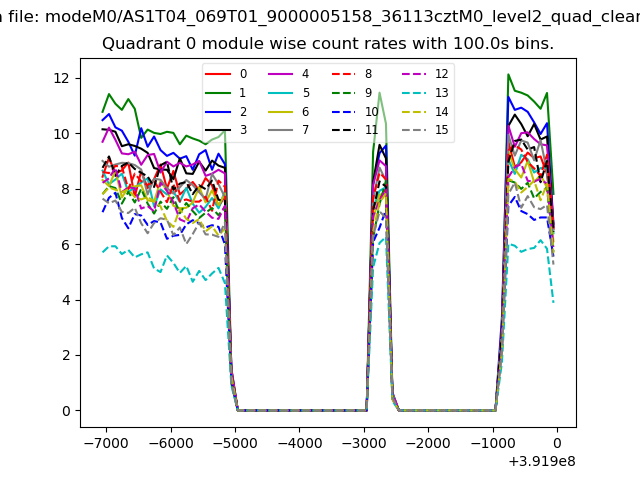 |
 |
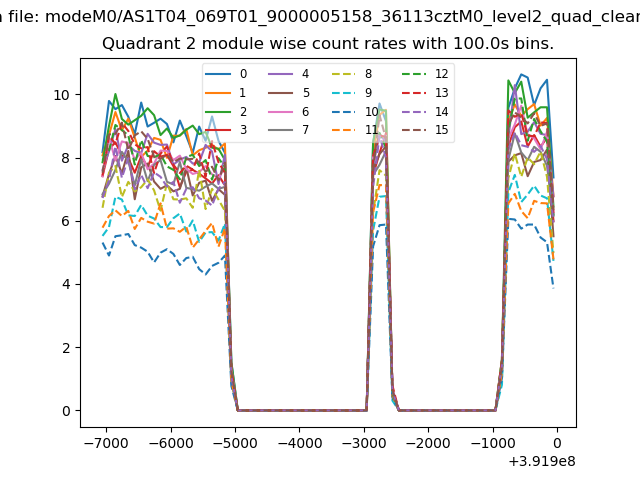
| Module-wise count rates for Quadrant B Data is divided into 100 sec bins |
 |
 |
| Module-wise count rates for Quadrant C Data is divided into 100 sec bins |
 |
 |
| Module-wise count rates for Quadrant D Data is divided into 100 sec bins |
 |
 |
| Parameter | Plot |
|---|---|
| CZT HV Monitor | 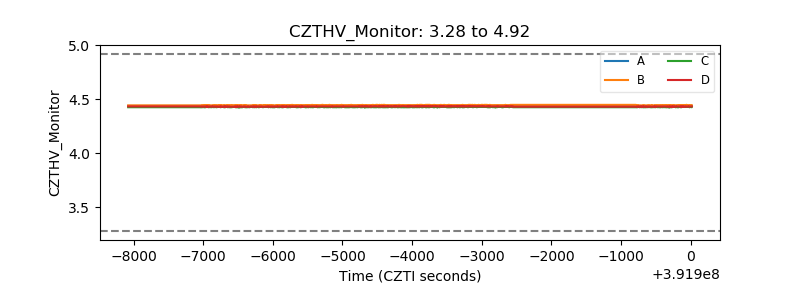 |
| D_VDD | 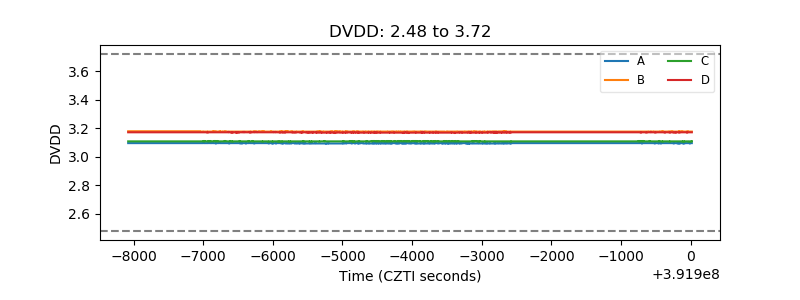 |
| Temperature 1 | 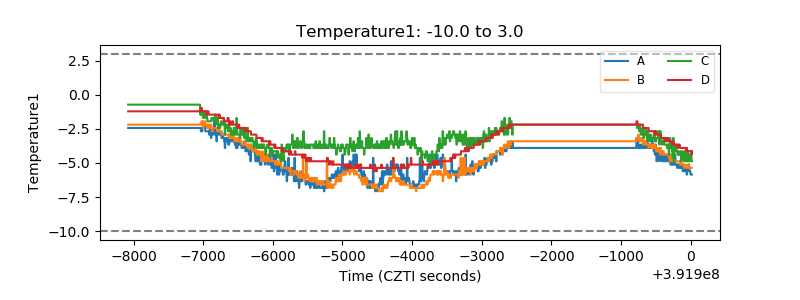 |
| Veto HV Monitor | 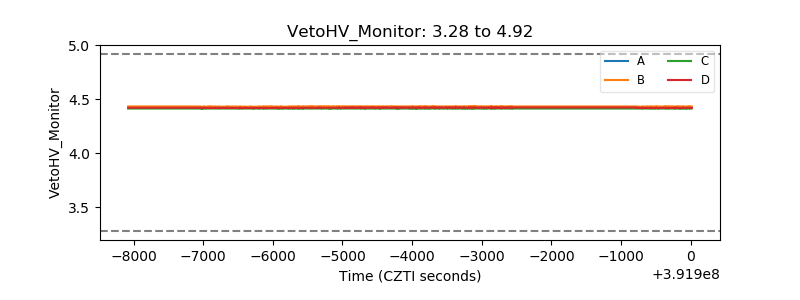 |
| Veto LLD | 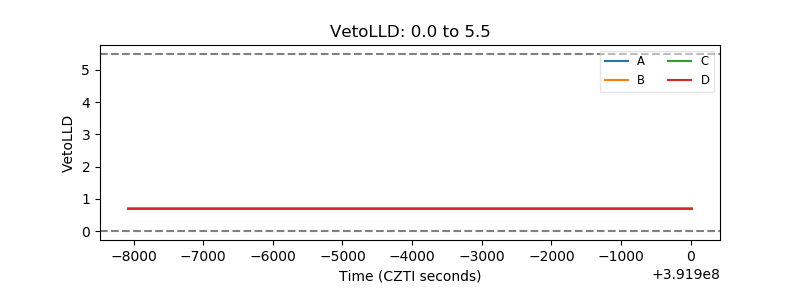 |
| Alpha Counter | 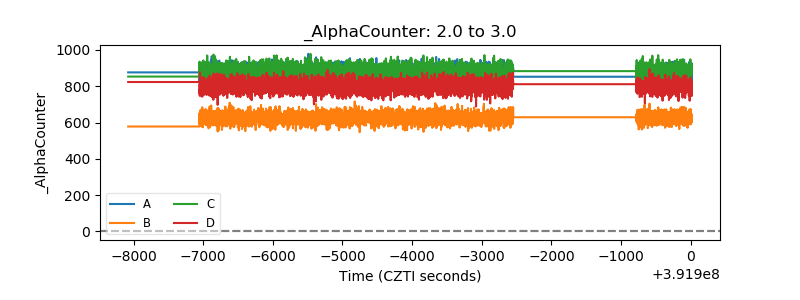 |
| _CPM_Rate | 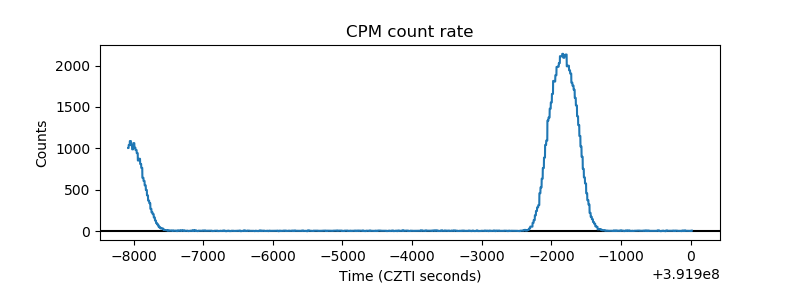 |
| CZT Counter | 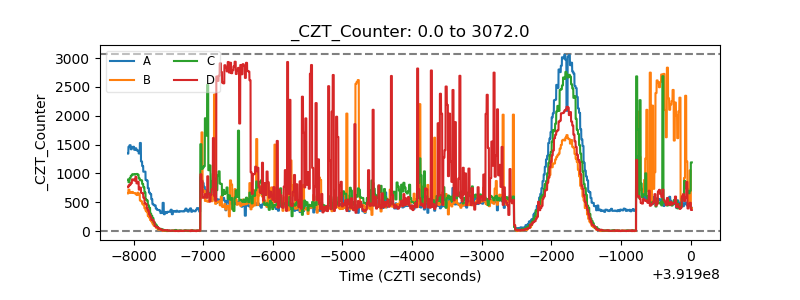 |
| +2.5 Volts monitor | 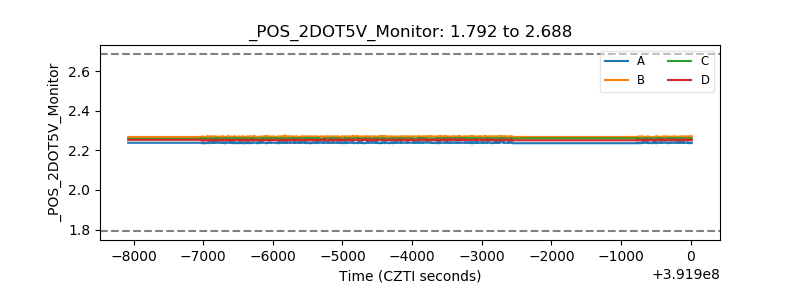 |
| +5 Volts monitor | 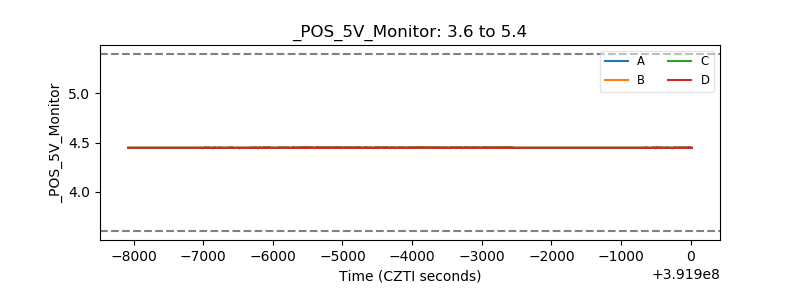 |
| _ROLL_ROT |  |
| _Roll_DEC | 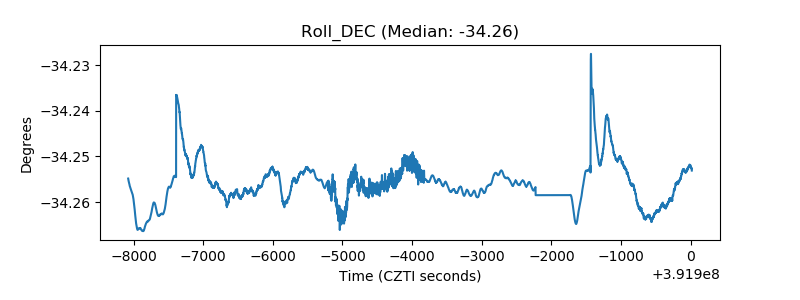 |
| _Roll_RA | 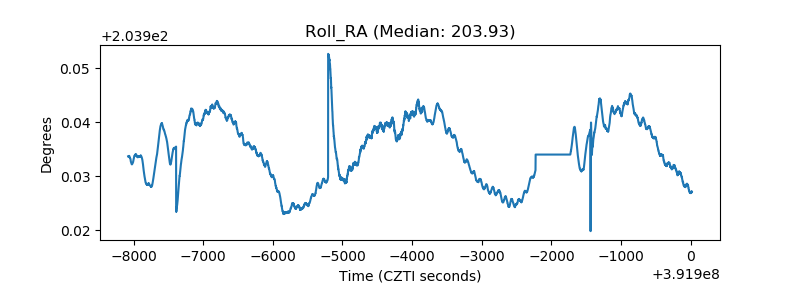 |
| Veto Counter | 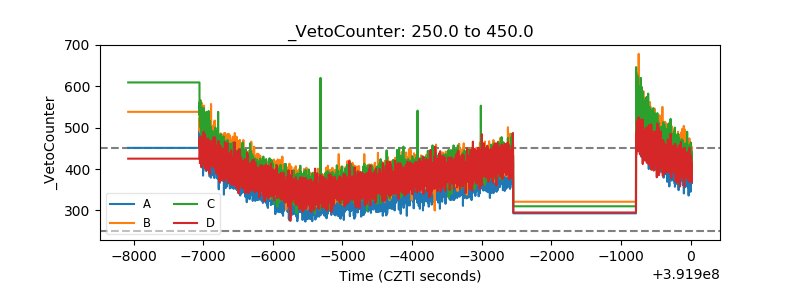 |