| Param | Original file | Final file |
|---|---|---|
| Filename | modeM0/AS1T04_069T01_9000005158_36111cztM0_level2.evt | modeM0/AS1T04_069T01_9000005158_36111cztM0_level2_quad_clean.evt |
| Size (bytes) | 2,371,533,120 | 316,143,360 |
| Size | 2.2 GB | 301.5 MB |
| Events in quadrant A | 11,987,833 | 2,086,464 |
| Events in quadrant B | 18,600,043 | 1,930,066 |
| Events in quadrant C | 17,384,887 | 1,986,617 |
| Events in quadrant D | 22,146,885 | 1,829,756 |
| Mode M0 | |||
|---|---|---|---|
| Quadrant | BADHDUFLAG | Total packets | Discarded packets |
| A | 0 | 51969 | 7 |
| B | 0 | 71655 | 6 |
| C | 0 | 68446 | 9 |
| D | 0 | 82752 | 6 |
| Mode M9 | |||
|---|---|---|---|
| Quadrant | BADHDUFLAG | Total packets | Discarded packets |
| A | 0 | 75 | 0 |
| B | 0 | 75 | 0 |
| C | 0 | 75 | 0 |
| D | 0 | 76 | 0 |
| Mode SS | |||
|---|---|---|---|
| Quadrant | BADHDUFLAG | Total packets | Discarded packets |
| A | 0 | 518 | 0 |
| B | 0 | 518 | 0 |
| C | 0 | 518 | 0 |
| D | 0 | 518 | 0 |
| Quadrant | Total seconds | Saturated seconds | Saturation percentage |
|---|---|---|---|
| A | 25301 | 30 | 0.118572% |
| B | 25301 | 2273 | 8.983835% |
| C | 25300 | 1000 | 3.952569% |
| D | 25301 | 2187 | 8.643927% |
Noise dominated data is calculated using 1-second bins in cleaned event files. If a bin has >2000 counts, and if more than 50% of those come from <1% of pixels, then it is considered to be noise-dominated and hence unusable.
| Quadrant | # 1 sec bins | Bins with >0 counts | Bins with >2000 counts | High rate bins dominated by noise | Noise dominated (total time) | Noise dominated (detector-on time) | Marked lightcurve |
|---|---|---|---|---|---|---|---|
| A | 32377 | 25306 | 3 | 3 | 0.01% | 0.01% | 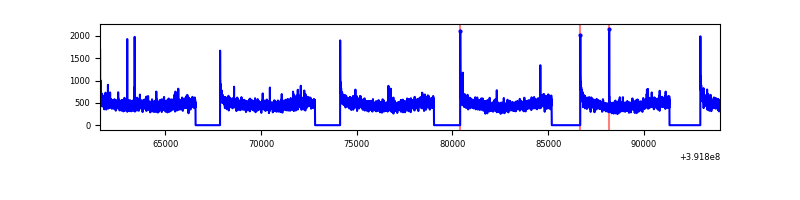 |
| B | 32377 | 25304 | 1691 | 1691 | 5.22% | 6.68% | 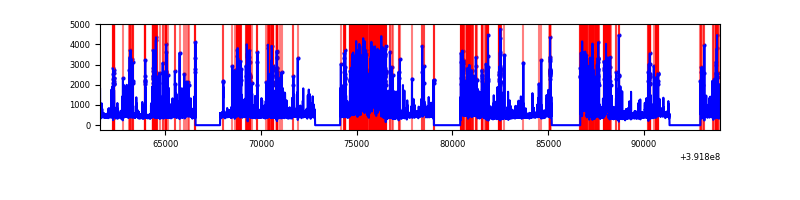 |
| C | 32377 | 25306 | 825 | 825 | 2.55% | 3.26% | 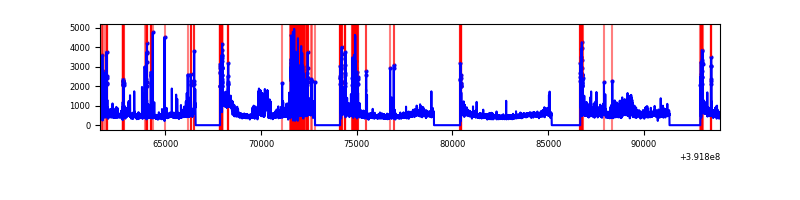 |
| D | 32377 | 25306 | 2101 | 2101 | 6.49% | 8.30% | 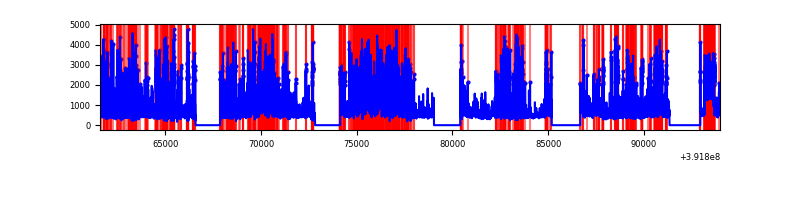 |
Top three noisy pixels from each quadrant. If the there are fewer than three noisy pixels in the level2.evt file, extra rows are filled as -1
| Pixel properties | Quadrant properties | ||||||
|---|---|---|---|---|---|---|---|
| Quadrant | DetID | PixID | Counts | Sigma | Mean | Median | Sigma |
| A | 10 | 83 | 696742 | 1191.05 | 2895 | 2840 | 582.6 |
| A | 13 | 6 | 42246 | 67.64 | 2895 | 2840 | 582.6 |
| A | 8 | 144 | 39455 | 62.85 | 2895 | 2840 | 582.6 |
| B | 5 | 172 | 5523711 | 10528.15 | 2754 | 2687 | 524.4 |
| B | 5 | 236 | 1459981 | 2778.94 | 2754 | 2687 | 524.4 |
| B | 0 | 190 | 307612 | 581.47 | 2754 | 2687 | 524.4 |
| C | 1 | 23 | 2581514 | 4071.1 | 2721 | 2738 | 633.4 |
| C | 0 | 207 | 2421953 | 3819.21 | 2721 | 2738 | 633.4 |
| C | 15 | 214 | 1106841 | 1743.04 | 2721 | 2738 | 633.4 |
| D | 1 | 52 | 5819781 | 8803.95 | 2687 | 2616 | 660.7 |
| D | 12 | 6 | 1492016 | 2254.12 | 2687 | 2616 | 660.7 |
| D | 10 | 203 | 1160074 | 1751.75 | 2687 | 2616 | 660.7 |
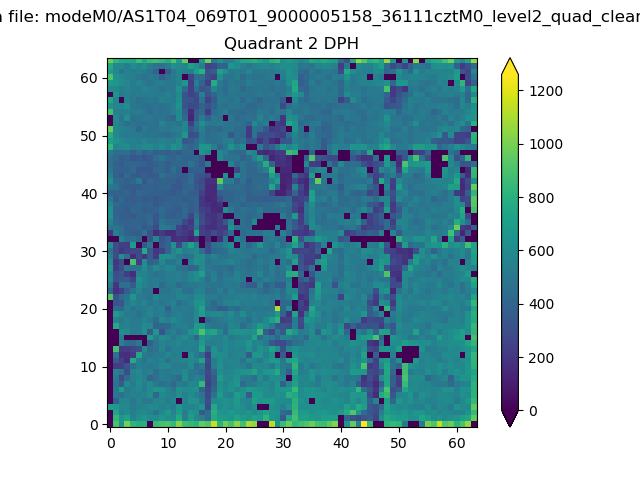
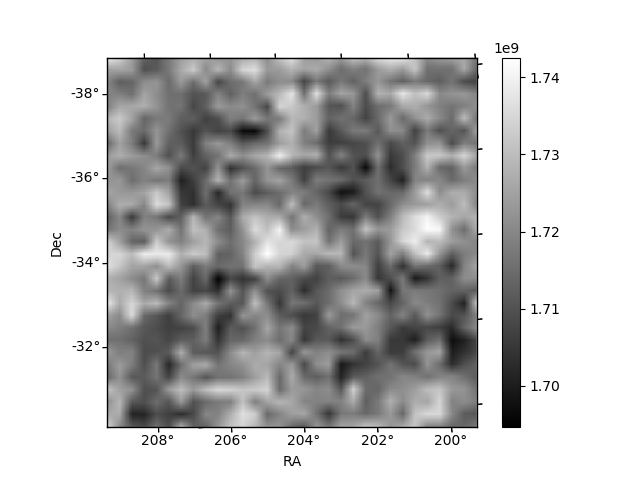
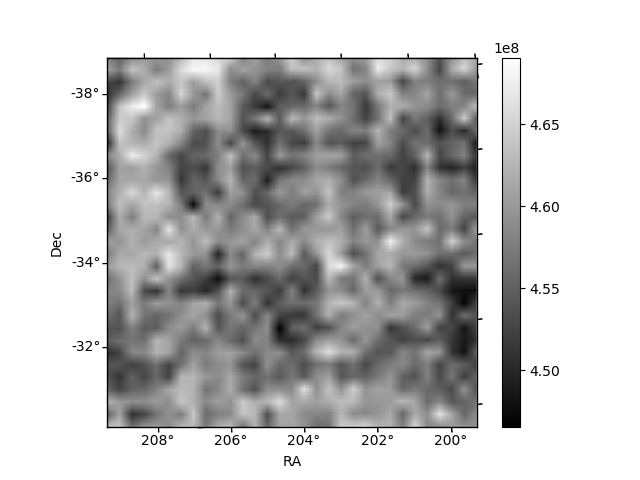
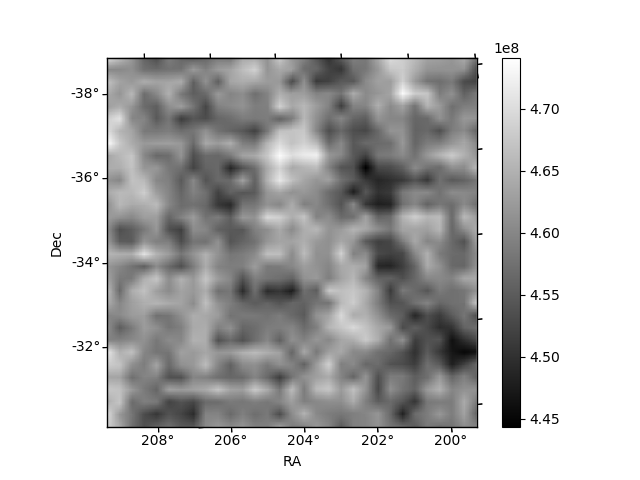
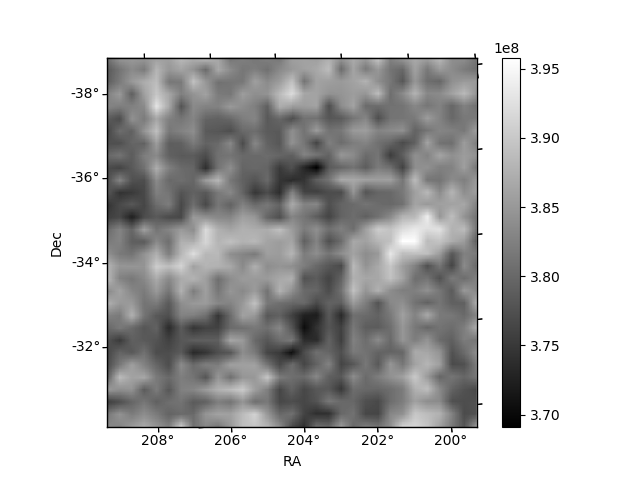
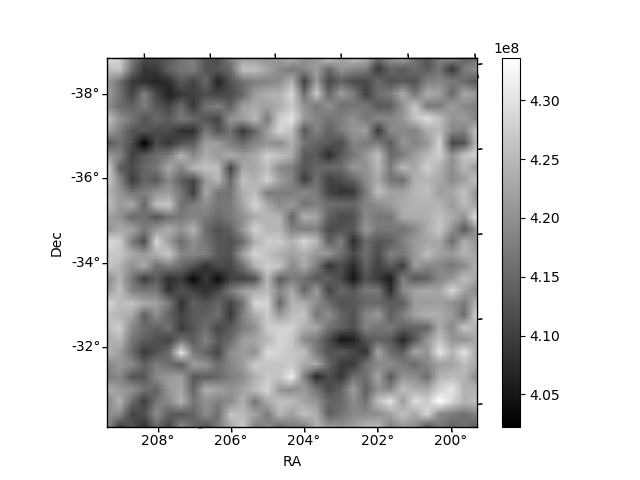
Histogram calculated using DETX and DETY for each event in the final _common_clean file
| Quadrant A | 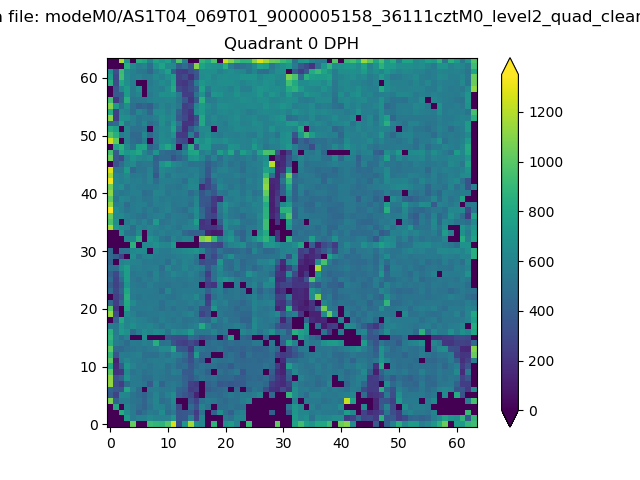 |
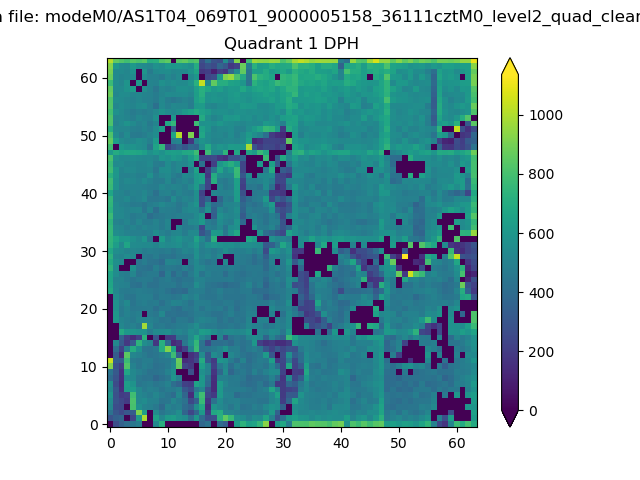 |
Quadrant B |
|---|---|---|---|
| Quadrant D | 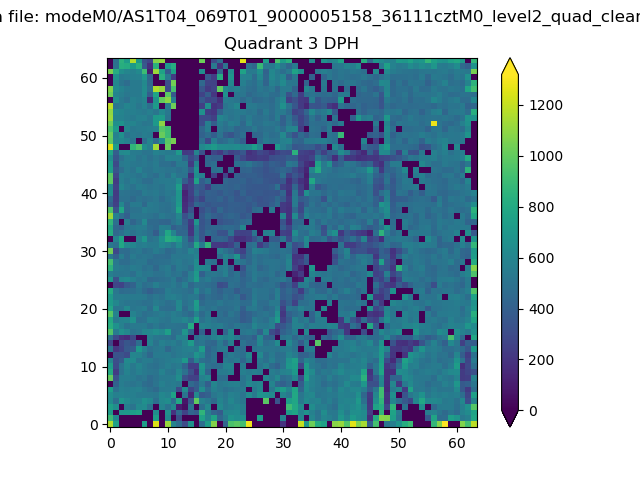 |
 |
Quadrant C |
| Plot type | Count rate plots | Images |
|---|---|---|
| Comparison with Poisson distribution Blue bars denote a histogram of data divided into 1 sec bins. Red curve is a Poisson curve with rate = median count rate of data. |
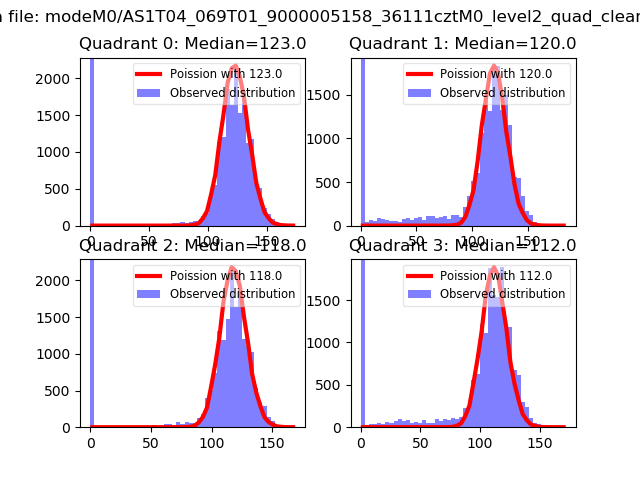 |
 |
| Quadrant-wise count rates Data is divided into 100 sec bins |
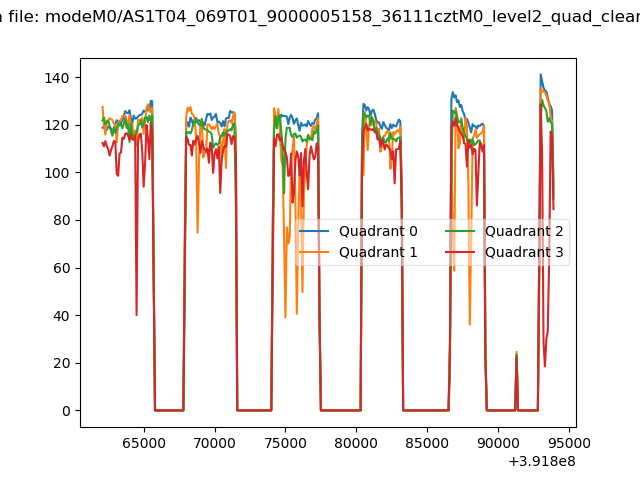 |
|
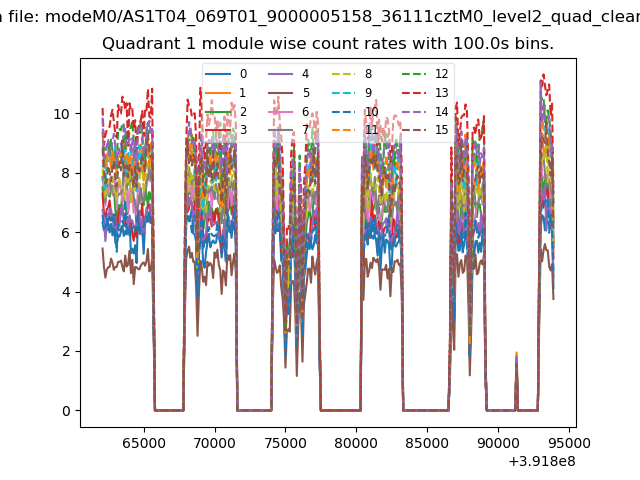
| Module-wise count rates for Quadrant A Data is divided into 100 sec bins |
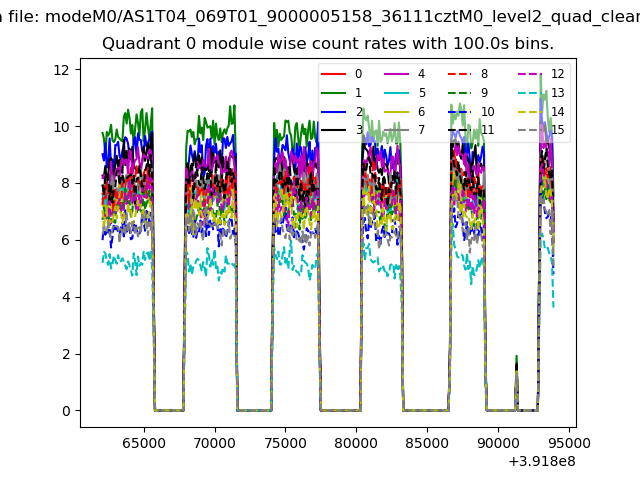 |
 |
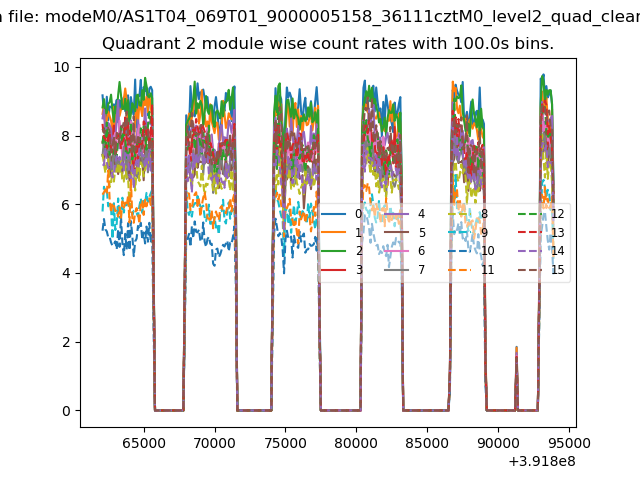
| Module-wise count rates for Quadrant B Data is divided into 100 sec bins |
 |
 |
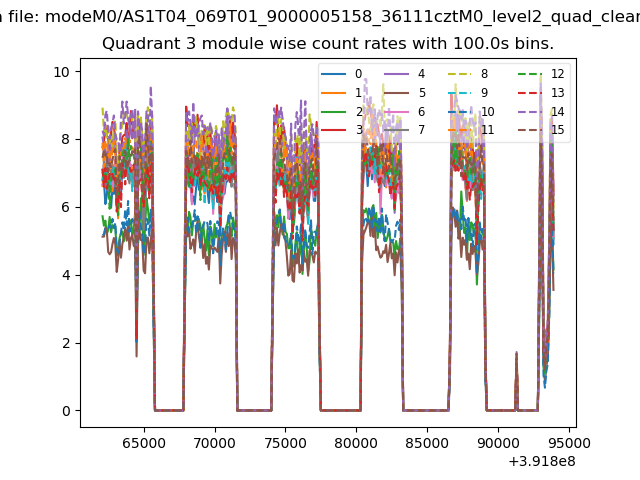
| Module-wise count rates for Quadrant C Data is divided into 100 sec bins |
 |
 |
| Module-wise count rates for Quadrant D Data is divided into 100 sec bins |
 |
 |
| Parameter | Plot |
|---|---|
| CZT HV Monitor | 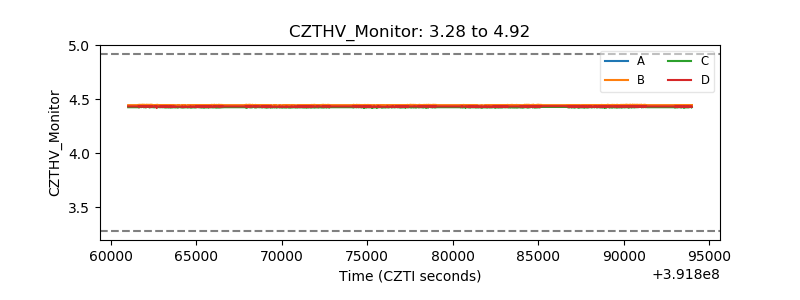 |
| D_VDD | 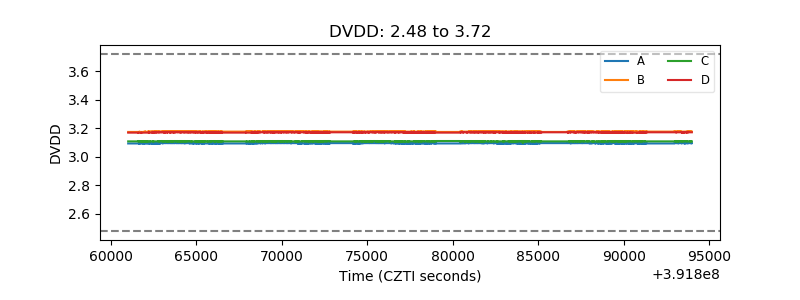 |
| Temperature 1 | 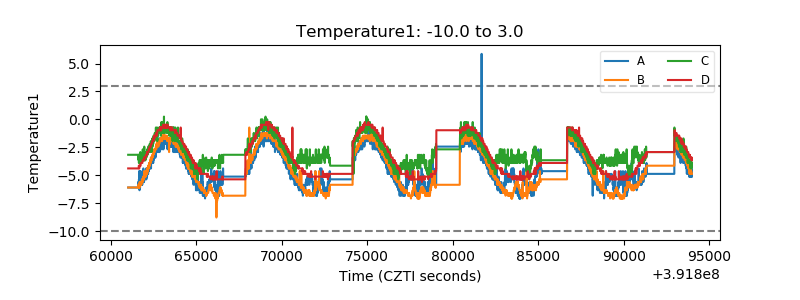 |
| Veto HV Monitor | 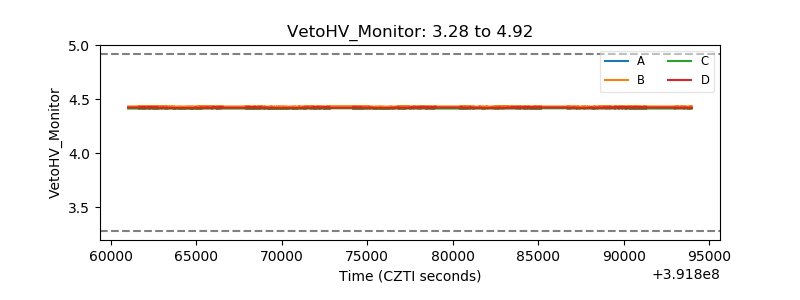 |
| Veto LLD | 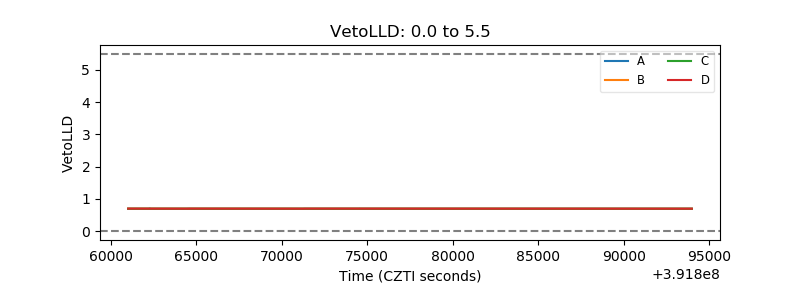 |
| Alpha Counter | 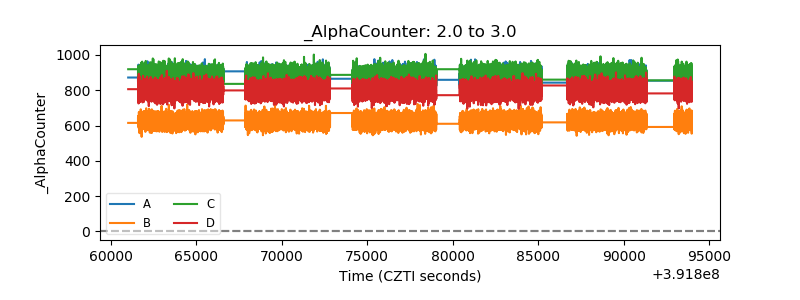 |
| _CPM_Rate | 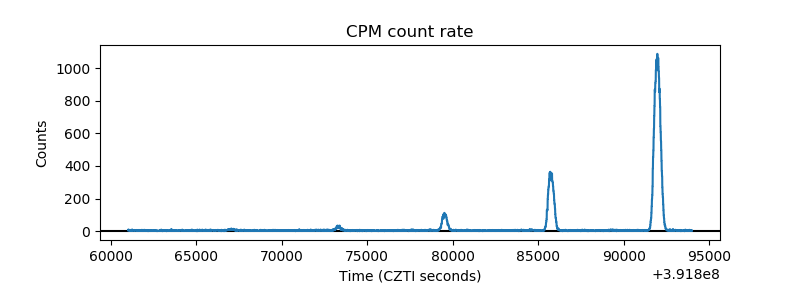 |
| CZT Counter | 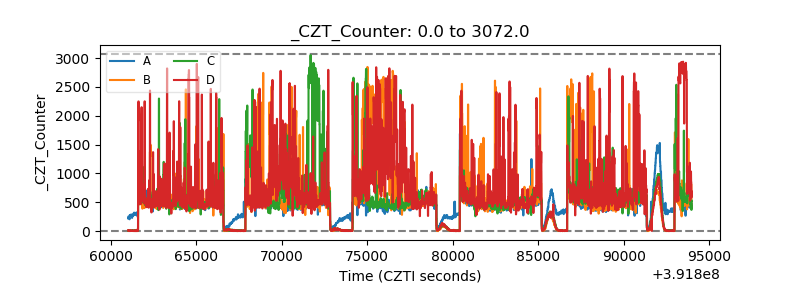 |
| +2.5 Volts monitor | 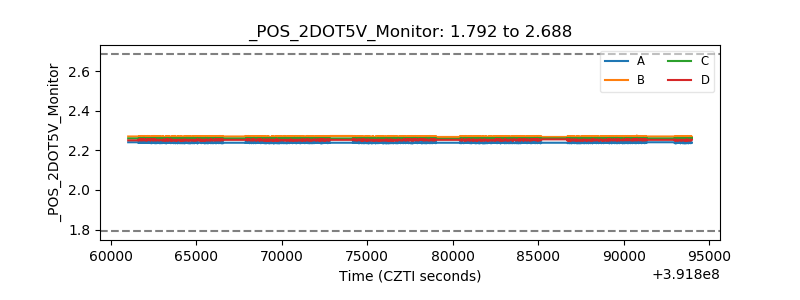 |
| +5 Volts monitor | 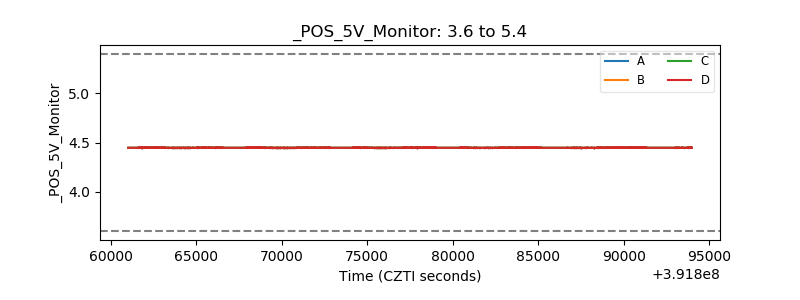 |
| _ROLL_ROT | 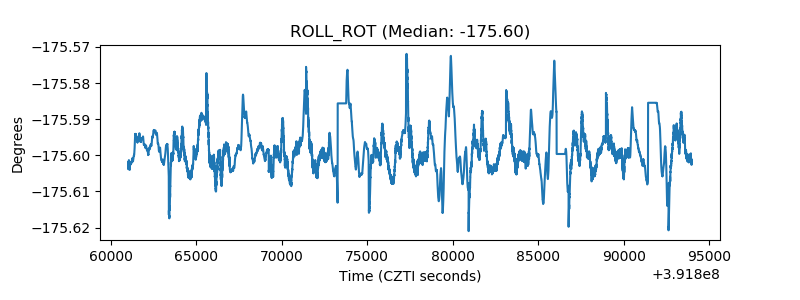 |
| _Roll_DEC | 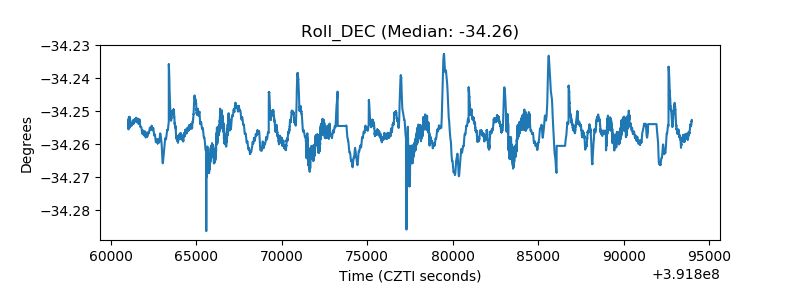 |
| _Roll_RA | 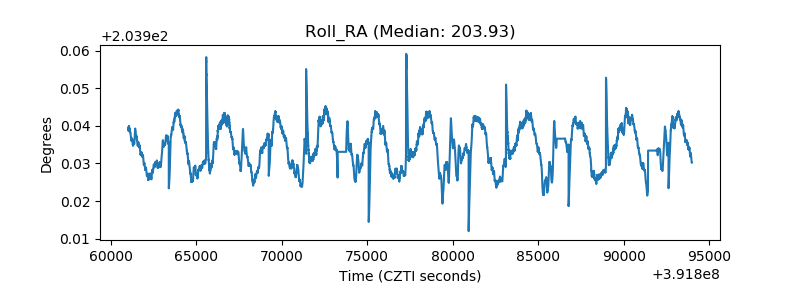 |
| Veto Counter | 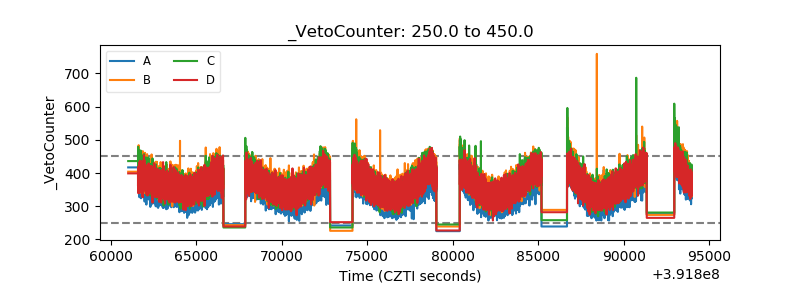 |