| Param | Original file | Final file |
|---|---|---|
| Filename | modeM0/AS1T04_069T01_9000005158_36110cztM0_level2.evt | modeM0/AS1T04_069T01_9000005158_36110cztM0_level2_quad_clean.evt |
| Size (bytes) | 1,501,352,640 | 197,478,720 |
| Size | 1.4 GB | 188.3 MB |
| Events in quadrant A | 7,286,234 | 1,311,644 |
| Events in quadrant B | 12,653,814 | 1,181,433 |
| Events in quadrant C | 11,021,752 | 1,244,391 |
| Events in quadrant D | 13,468,565 | 1,178,354 |
Noise dominated data is calculated using 1-second bins in cleaned event files. If a bin has >2000 counts, and if more than 50% of those come from <1% of pixels, then it is considered to be noise-dominated and hence unusable.
| Quadrant | # 1 sec bins | Bins with >0 counts | Bins with >2000 counts | High rate bins dominated by noise | Noise dominated (total time) | Noise dominated (detector-on time) | Marked lightcurve |
|---|---|---|---|---|---|---|---|
| A | 19595 | 15419 | 2 | 2 | 0.01% | 0.01% | 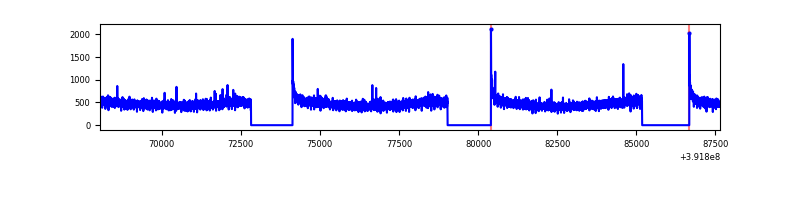 |
| B | 19595 | 15418 | 1402 | 1402 | 7.15% | 9.09% | 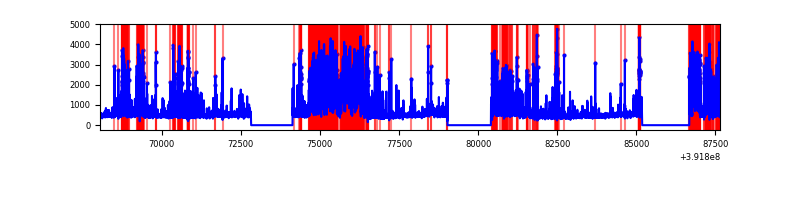 |
| C | 19595 | 15419 | 716 | 716 | 3.65% | 4.64% | 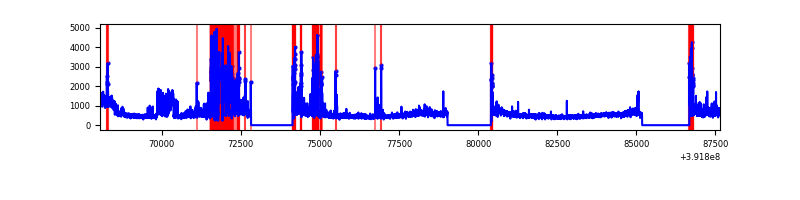 |
| D | 19595 | 15419 | 1001 | 1001 | 5.11% | 6.49% | 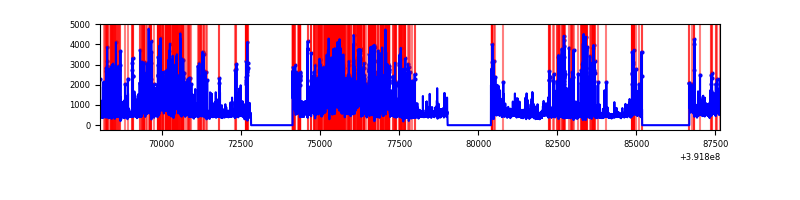 |
Top three noisy pixels from each quadrant. If the there are fewer than three noisy pixels in the level2.evt file, extra rows are filled as -1
| Pixel properties | Quadrant properties | ||||||
|---|---|---|---|---|---|---|---|
| Quadrant | DetID | PixID | Counts | Sigma | Mean | Median | Sigma |
| A | 10 | 83 | 410863 | 1142.92 | 1768 | 1733 | 358.0 |
| A | 13 | 6 | 29296 | 77.0 | 1768 | 1733 | 358.0 |
| A | 13 | 254 | 23230 | 60.05 | 1768 | 1733 | 358.0 |
| B | 5 | 172 | 4577168 | 14485.13 | 1653 | 1611 | 315.9 |
| B | 5 | 236 | 998346 | 3155.43 | 1653 | 1611 | 315.9 |
| B | 0 | 190 | 244797 | 769.87 | 1653 | 1611 | 315.9 |
| C | 1 | 23 | 2432657 | 6353.71 | 1644 | 1655 | 382.6 |
| C | 0 | 207 | 1196913 | 3123.95 | 1644 | 1655 | 382.6 |
| C | 15 | 214 | 669598 | 1745.75 | 1644 | 1655 | 382.6 |
| D | 1 | 52 | 4615086 | 11350.38 | 1668 | 1624 | 406.5 |
| D | 12 | 6 | 716590 | 1759.01 | 1668 | 1624 | 406.5 |
| D | 12 | 233 | 330276 | 808.57 | 1668 | 1624 | 406.5 |
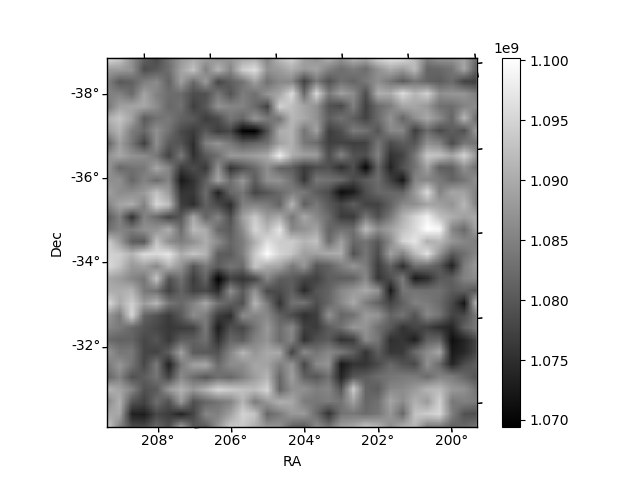
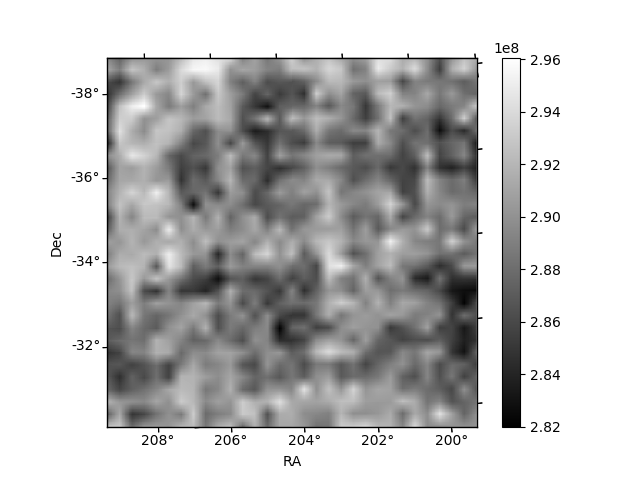
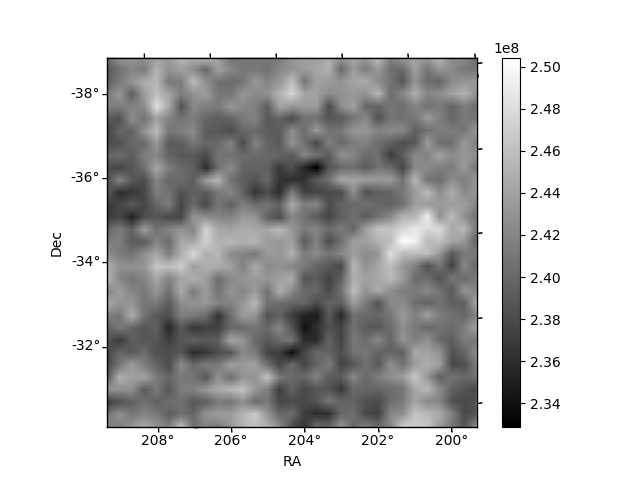
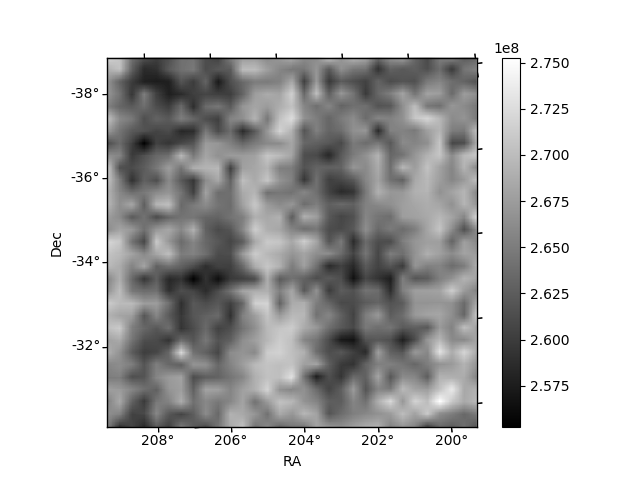
Histogram calculated using DETX and DETY for each event in the final _common_clean file
| Quadrant A | 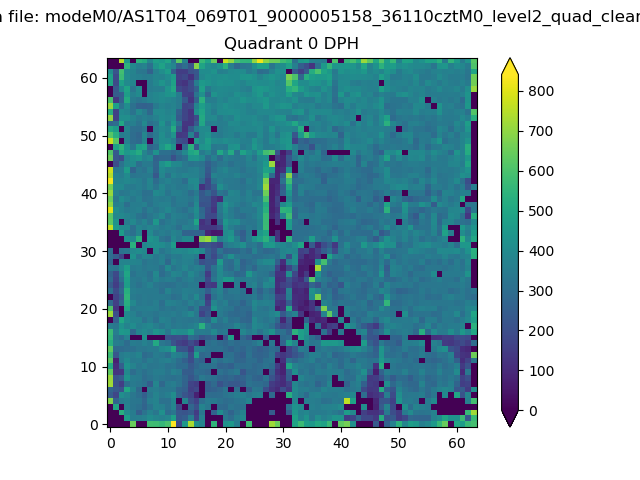 |
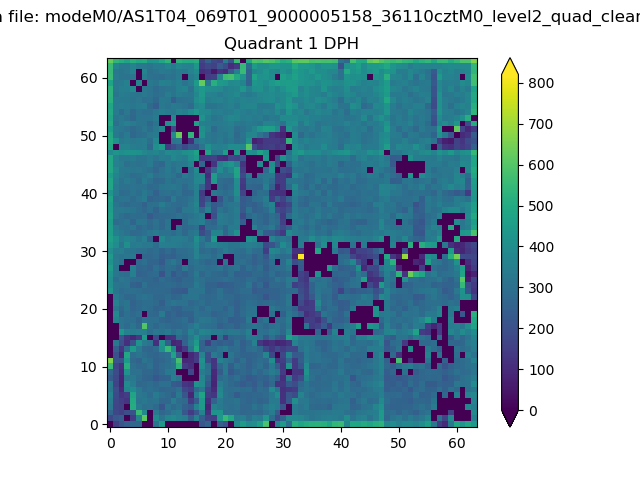 |
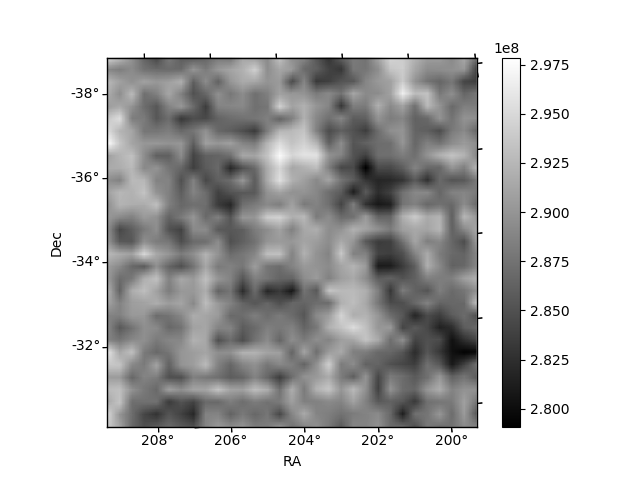
Quadrant B |
|---|---|---|---|
| Quadrant D | 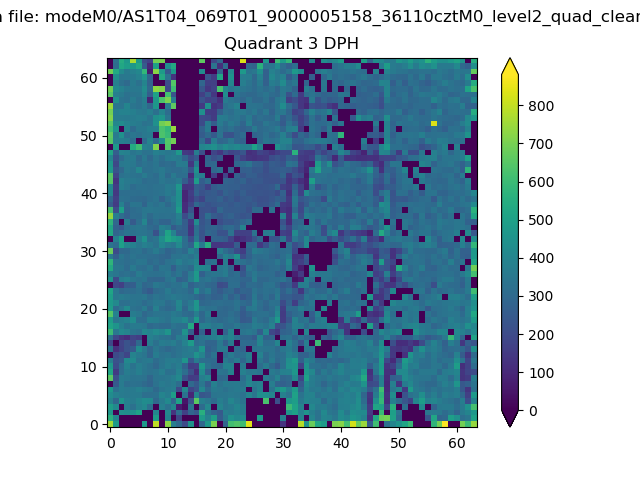 |
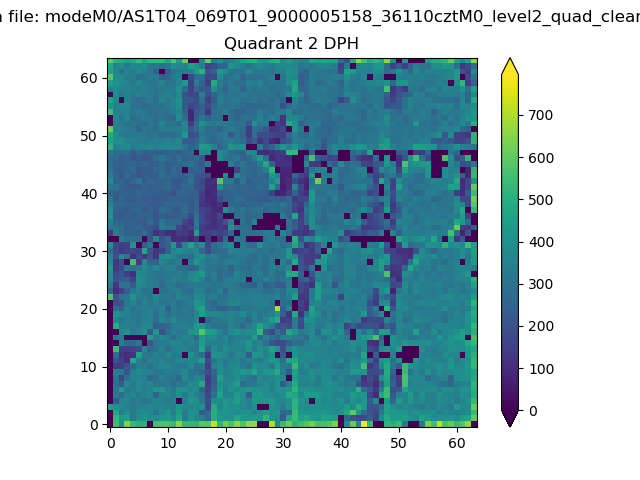 |
Quadrant C |
| Plot type | Count rate plots | Images |
|---|---|---|
| Comparison with Poisson distribution Blue bars denote a histogram of data divided into 1 sec bins. Red curve is a Poisson curve with rate = median count rate of data. |
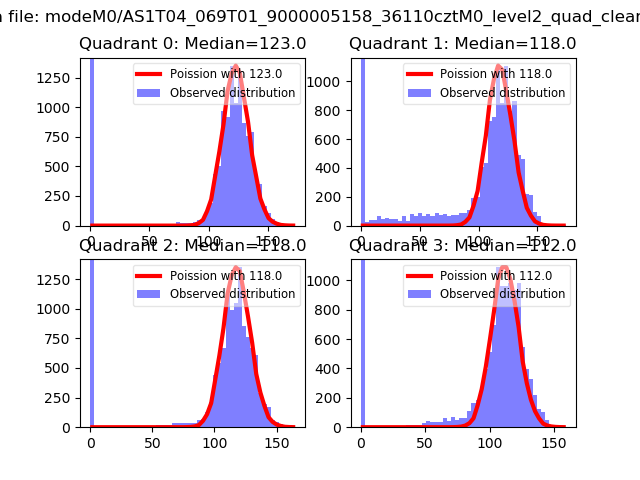 |
 |
| Quadrant-wise count rates Data is divided into 100 sec bins |
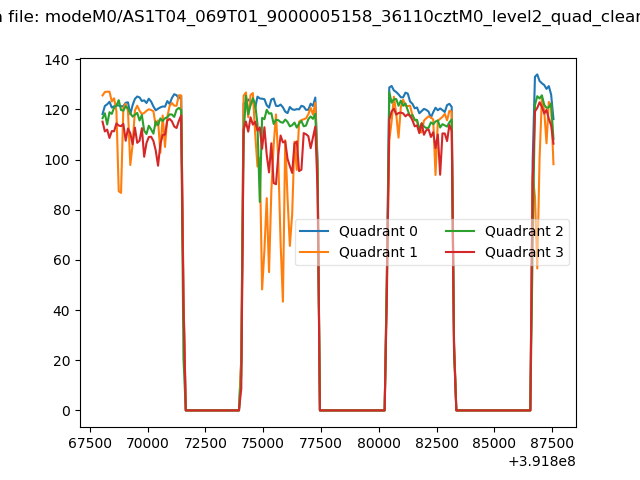 |
|
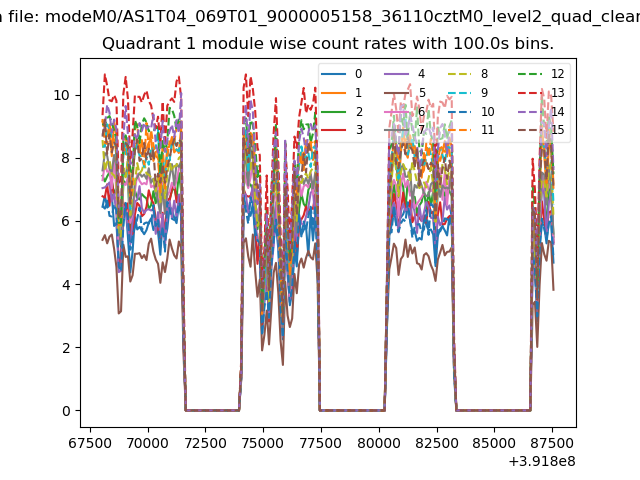
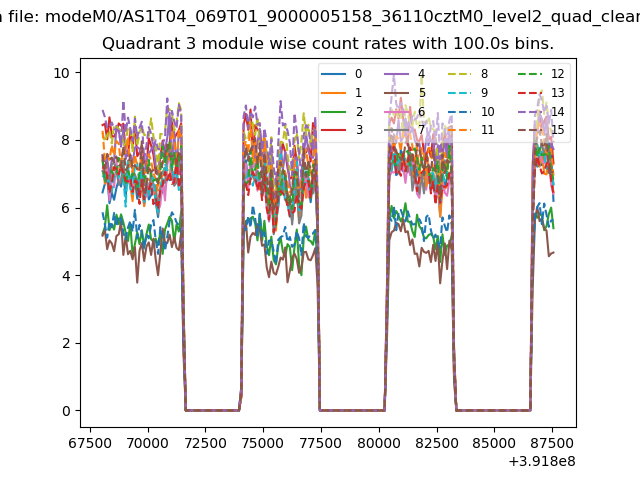
| Module-wise count rates for Quadrant A Data is divided into 100 sec bins |
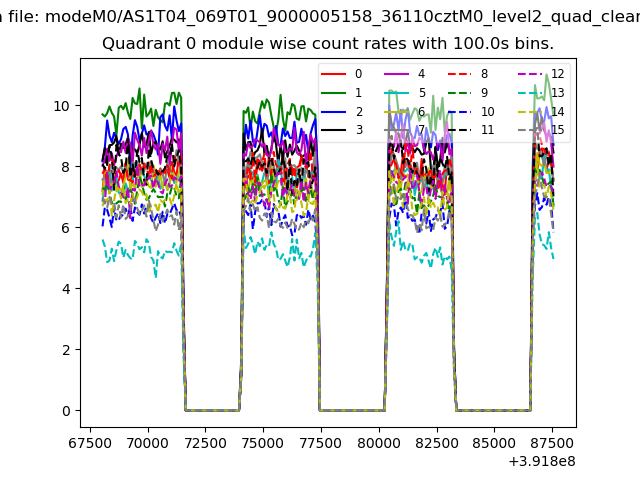 |
 |
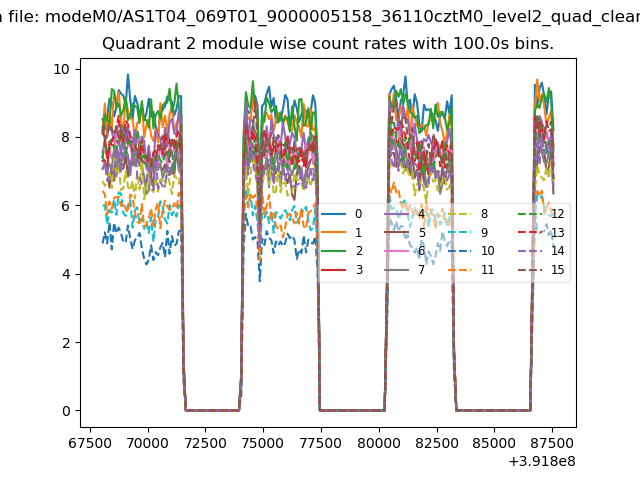
| Module-wise count rates for Quadrant B Data is divided into 100 sec bins |
 |
 |
| Module-wise count rates for Quadrant C Data is divided into 100 sec bins |
 |
 |
| Module-wise count rates for Quadrant D Data is divided into 100 sec bins |
 |
 |
| Parameter | Plot |
|---|---|
| CZT HV Monitor | 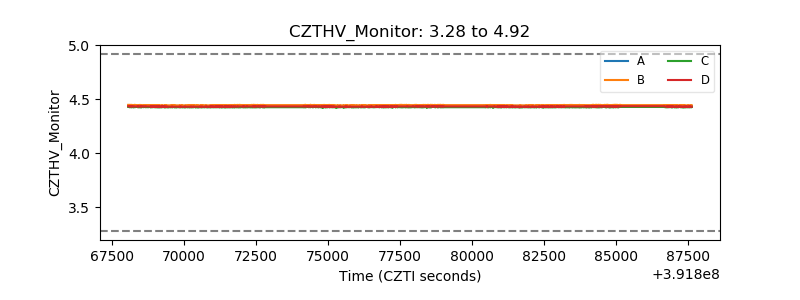 |
| D_VDD | 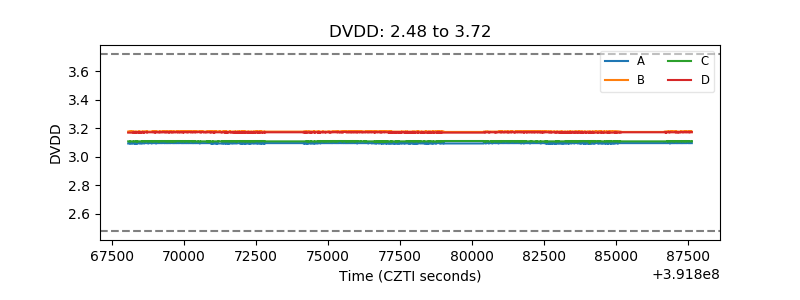 |
| Temperature 1 | 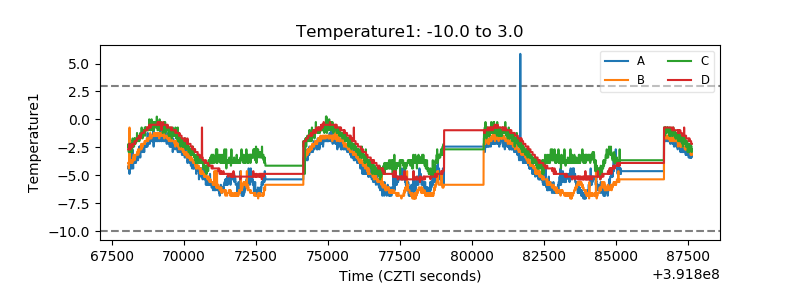 |
| Veto HV Monitor | 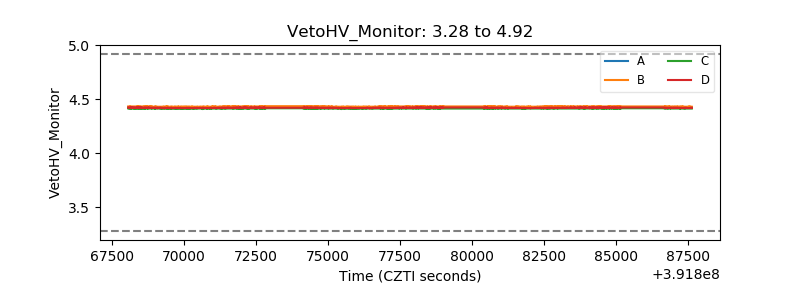 |
| Veto LLD | 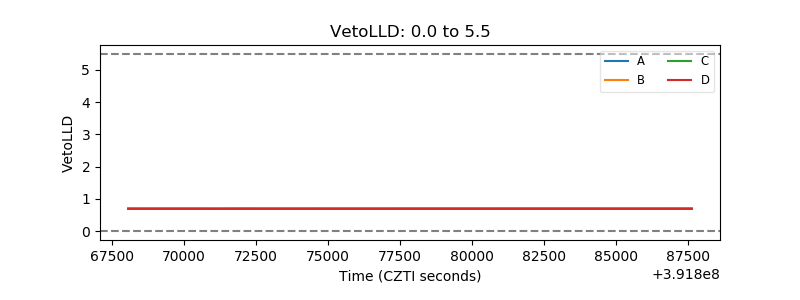 |
| Alpha Counter | 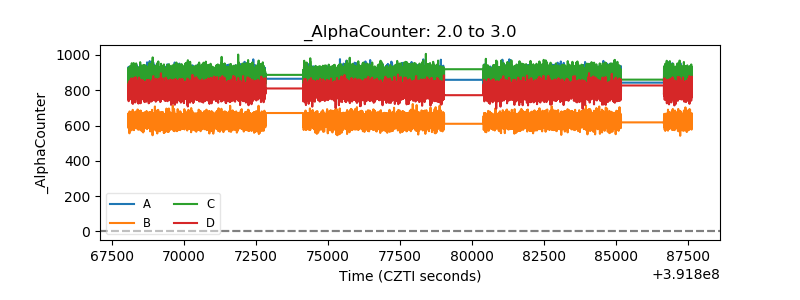 |
| _CPM_Rate | 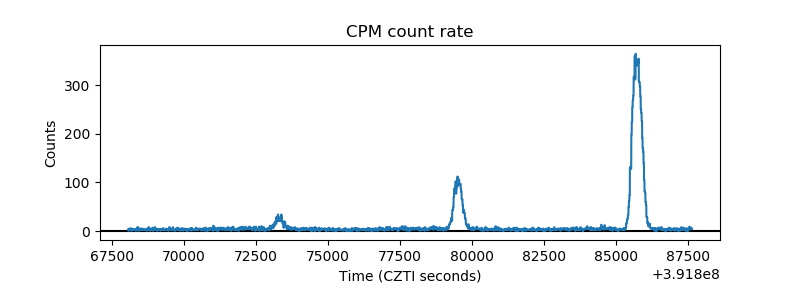 |
| CZT Counter | 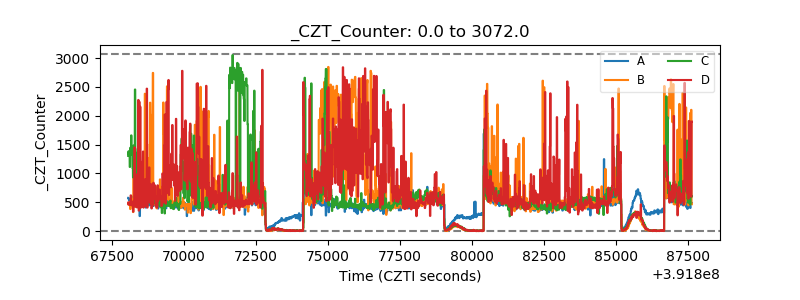 |
| +2.5 Volts monitor | 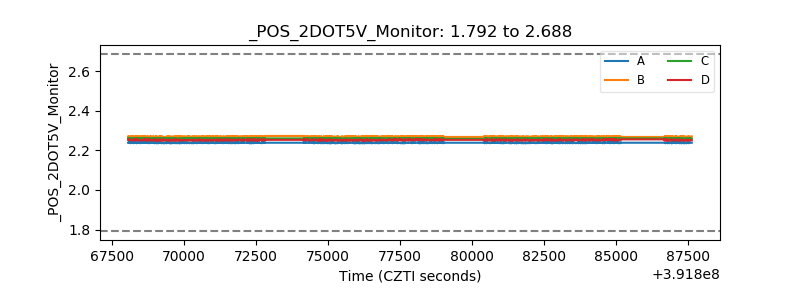 |
| +5 Volts monitor | 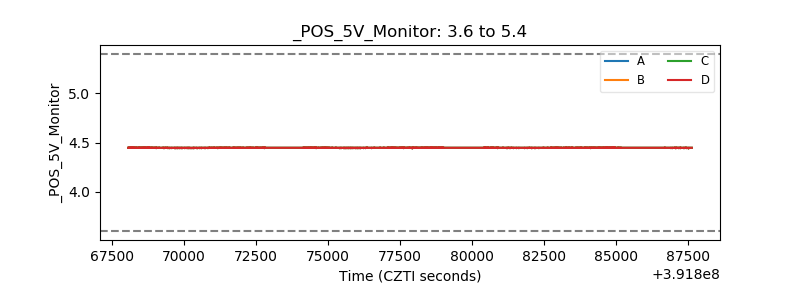 |
| _ROLL_ROT | 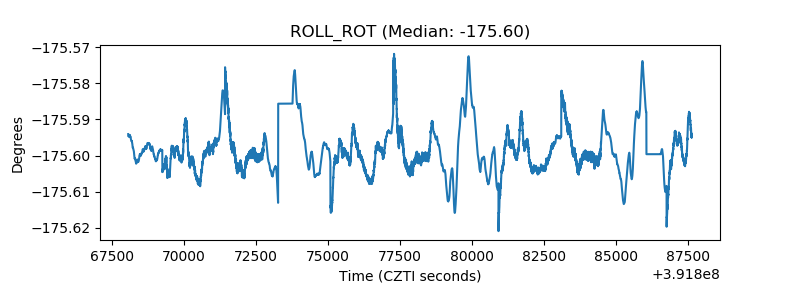 |
| _Roll_DEC | 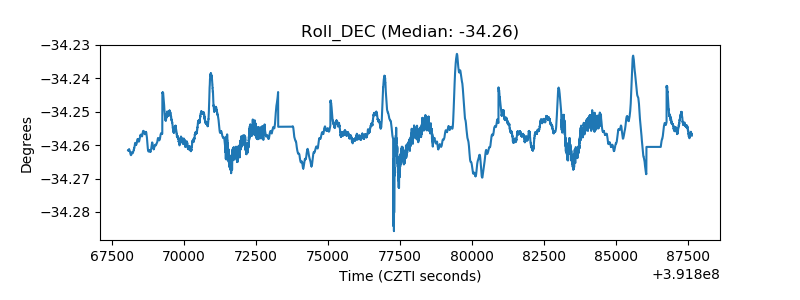 |
| _Roll_RA | 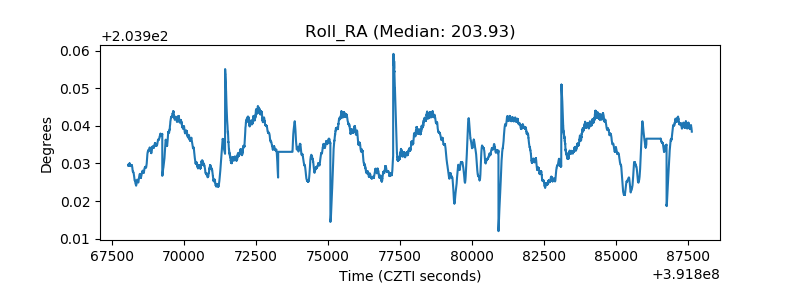 |
| Veto Counter | 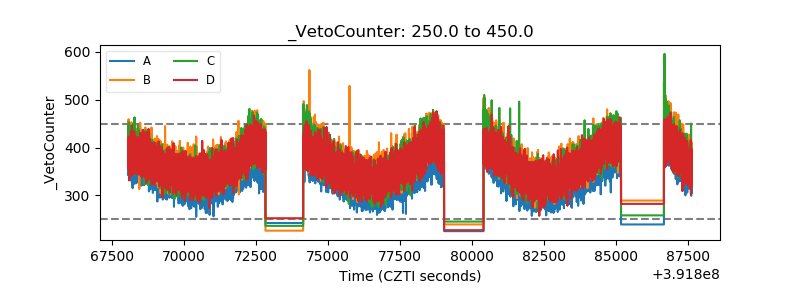 |