| Param | Original file | Final file |
|---|---|---|
| Filename | modeM0/AS1T04_069T01_9000005158_36104cztM0_level2.evt | modeM0/AS1T04_069T01_9000005158_36104cztM0_level2_quad_clean.evt |
| Size (bytes) | 472,075,200 | 53,182,080 |
| Size | 450.2 MB | 50.7 MB |
| Events in quadrant A | 2,537,794 | 325,908 |
| Events in quadrant B | 3,146,788 | 326,985 |
| Events in quadrant C | 3,630,340 | 314,555 |
| Events in quadrant D | 4,633,292 | 282,173 |
| Mode M0 | |||
|---|---|---|---|
| Quadrant | BADHDUFLAG | Total packets | Discarded packets |
| A | 0 | 10587 | 3 |
| B | 0 | 12549 | 2 |
| C | 0 | 13793 | 2 |
| D | 0 | 17198 | 2 |
| Mode M9 | |||
|---|---|---|---|
| Quadrant | BADHDUFLAG | Total packets | Discarded packets |
| A | 0 | 29 | 0 |
| B | 0 | 29 | 0 |
| C | 0 | 29 | 0 |
| D | 0 | 30 | 0 |
| Mode SS | |||
|---|---|---|---|
| Quadrant | BADHDUFLAG | Total packets | Discarded packets |
| A | 0 | 106 | 0 |
| B | 0 | 106 | 0 |
| C | 0 | 106 | 0 |
| D | 0 | 106 | 0 |
| Quadrant | Total seconds | Saturated seconds | Saturation percentage |
|---|---|---|---|
| A | 5135 | 5 | 0.097371% |
| B | 5135 | 133 | 2.590068% |
| C | 5135 | 303 | 5.900682% |
| D | 5135 | 649 | 12.638754% |
Noise dominated data is calculated using 1-second bins in cleaned event files. If a bin has >2000 counts, and if more than 50% of those come from <1% of pixels, then it is considered to be noise-dominated and hence unusable.
| Quadrant | # 1 sec bins | Bins with >0 counts | Bins with >2000 counts | High rate bins dominated by noise | Noise dominated (total time) | Noise dominated (detector-on time) | Marked lightcurve |
|---|---|---|---|---|---|---|---|
| A | 7137 | 5136 | 0 | 0 | 0.00% | 0.00% | 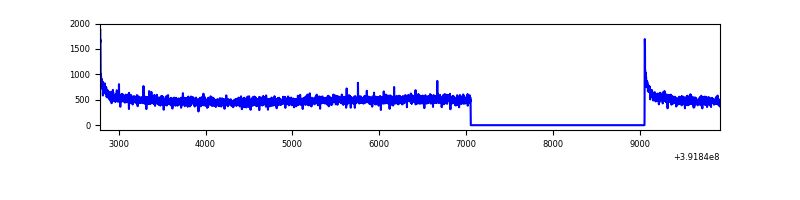 |
| B | 7137 | 5136 | 85 | 85 | 1.19% | 1.65% | 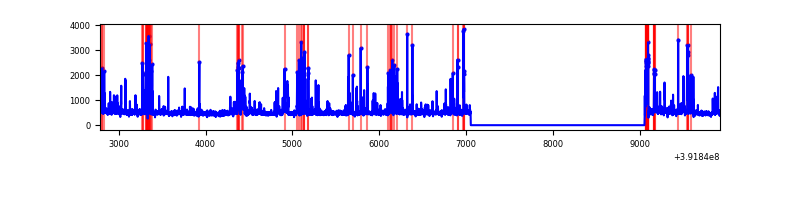 |
| C | 7137 | 5136 | 261 | 261 | 3.66% | 5.08% | 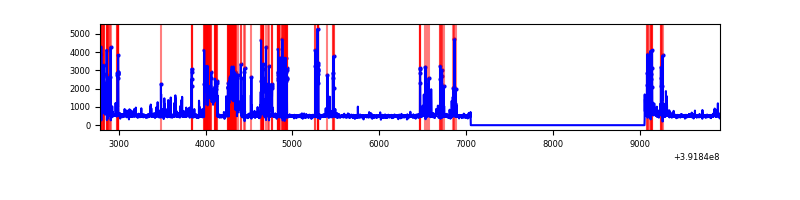 |
| D | 7137 | 5136 | 531 | 531 | 7.44% | 10.34% | 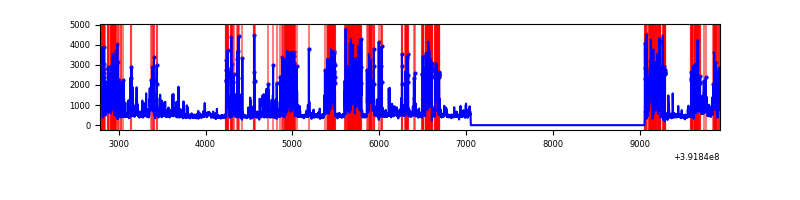 |
Top three noisy pixels from each quadrant. If the there are fewer than three noisy pixels in the level2.evt file, extra rows are filled as -1
| Pixel properties | Quadrant properties | ||||||
|---|---|---|---|---|---|---|---|
| Quadrant | DetID | PixID | Counts | Sigma | Mean | Median | Sigma |
| A | 10 | 83 | 174547 | 1420.5 | 605 | 592 | 122.5 |
| A | 8 | 144 | 19945 | 158.03 | 605 | 592 | 122.5 |
| A | 13 | 254 | 6419 | 47.58 | 605 | 592 | 122.5 |
| B | 5 | 236 | 321021 | 2804.17 | 597 | 581 | 114.3 |
| B | 5 | 172 | 259250 | 2263.61 | 597 | 581 | 114.3 |
| B | 5 | 255 | 72549 | 629.79 | 597 | 581 | 114.3 |
| C | 0 | 207 | 964466 | 7139.06 | 575 | 577 | 135.0 |
| C | 15 | 214 | 229526 | 1695.72 | 575 | 577 | 135.0 |
| C | 0 | 10 | 161930 | 1195.06 | 575 | 577 | 135.0 |
| D | 1 | 52 | 1065393 | 7760.14 | 558 | 541 | 137.2 |
| D | 12 | 6 | 604533 | 4401.61 | 558 | 541 | 137.2 |
| D | 2 | 250 | 308549 | 2244.61 | 558 | 541 | 137.2 |
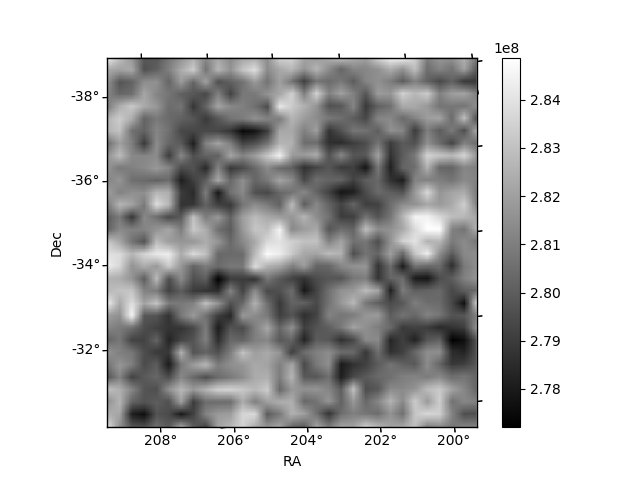
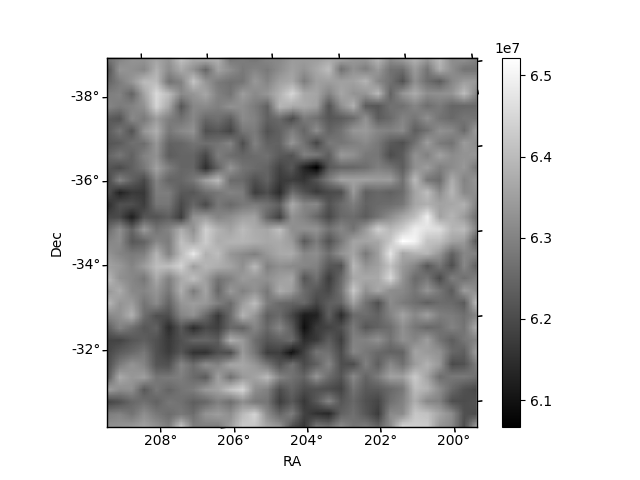
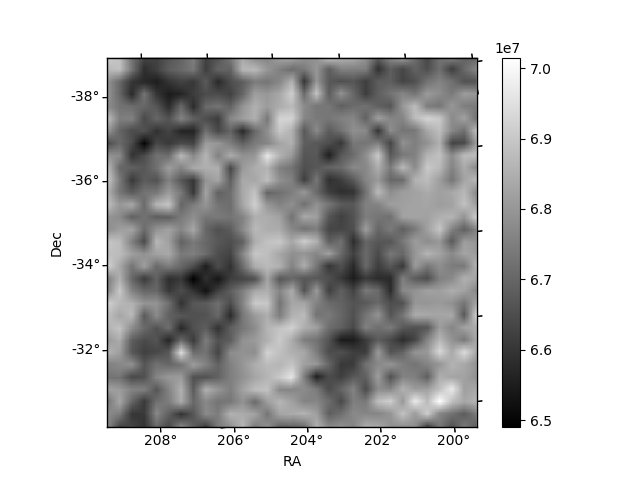
Histogram calculated using DETX and DETY for each event in the final _common_clean file
| Quadrant A | 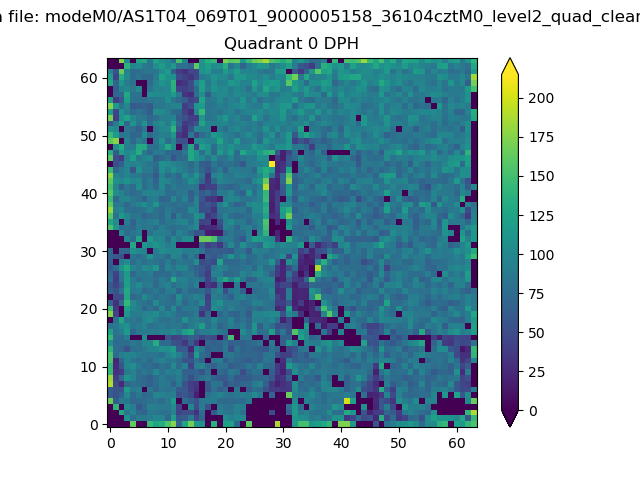 |
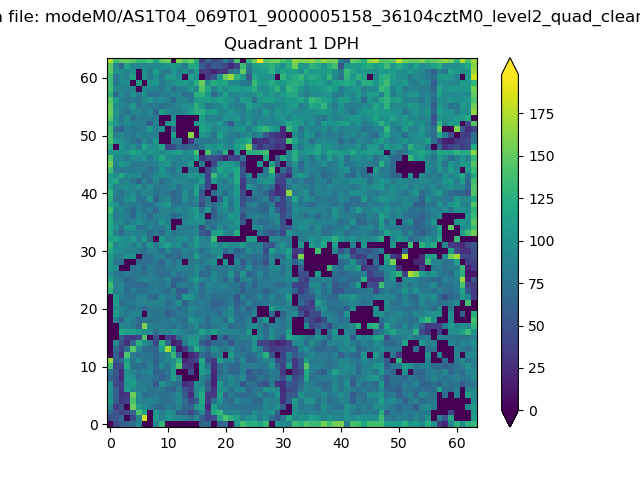 |
Quadrant B |
|---|---|---|---|
| Quadrant D | 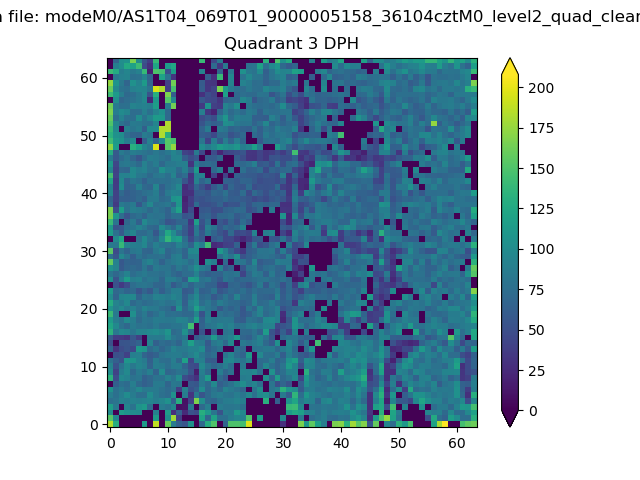 |
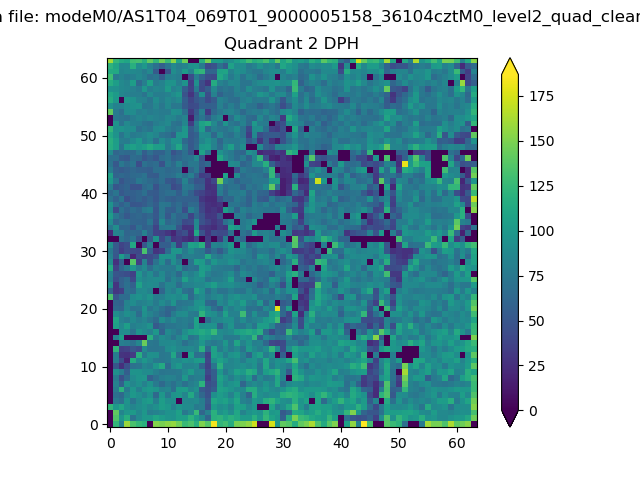 |
Quadrant C |
| Plot type | Count rate plots | Images |
|---|---|---|
| Comparison with Poisson distribution Blue bars denote a histogram of data divided into 1 sec bins. Red curve is a Poisson curve with rate = median count rate of data. |
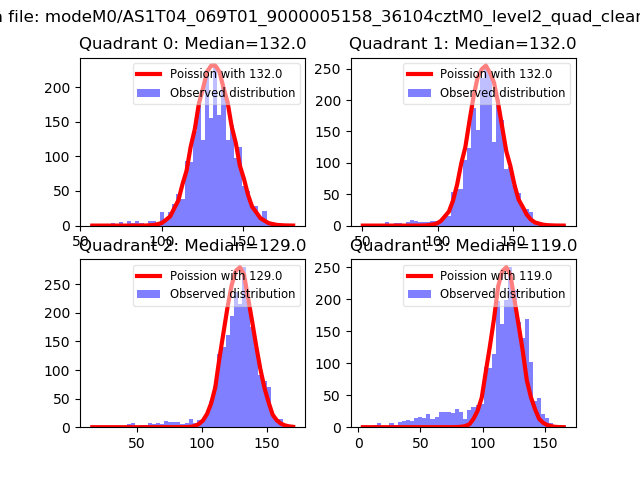 |
 |
| Quadrant-wise count rates Data is divided into 100 sec bins |
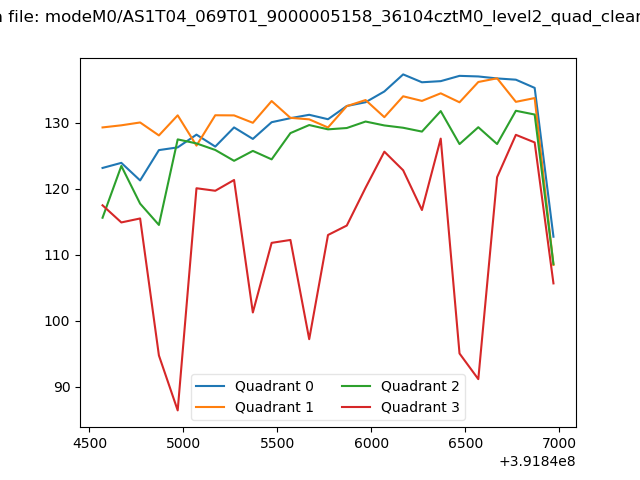 |
|
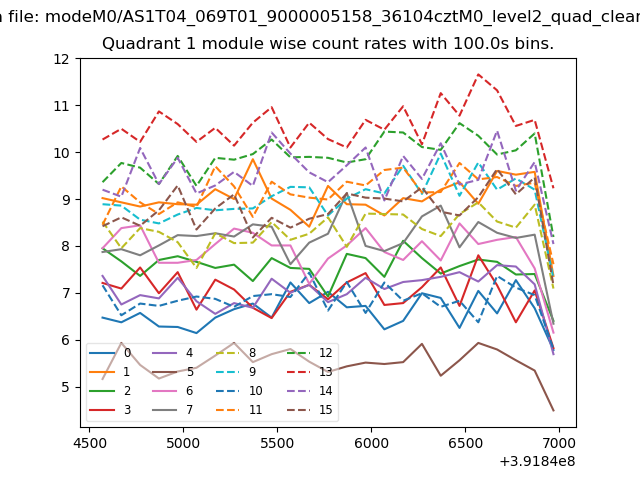
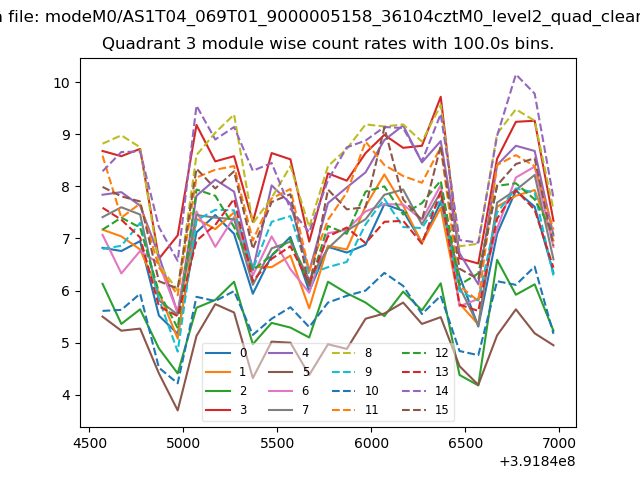
| Module-wise count rates for Quadrant A Data is divided into 100 sec bins |
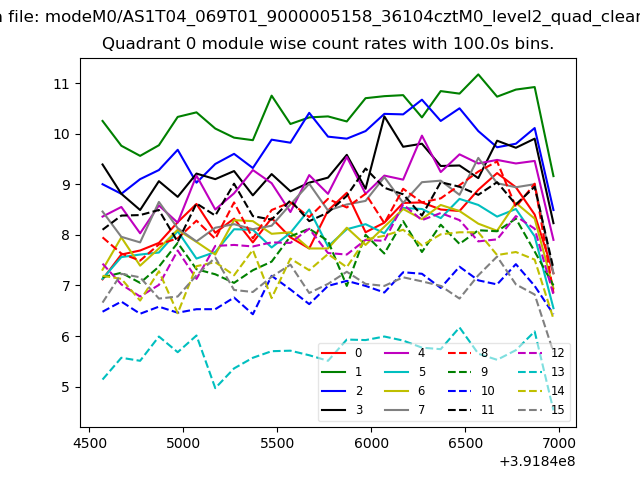 |
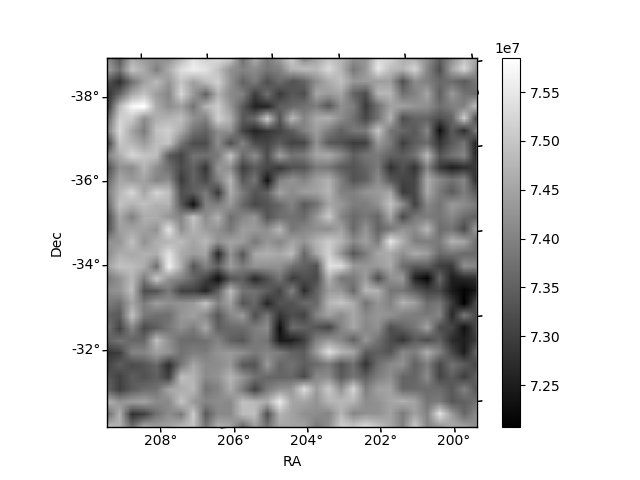 |
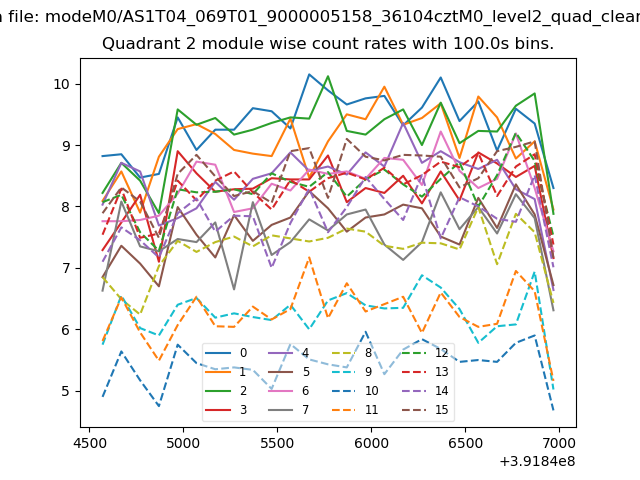
| Module-wise count rates for Quadrant B Data is divided into 100 sec bins |
 |
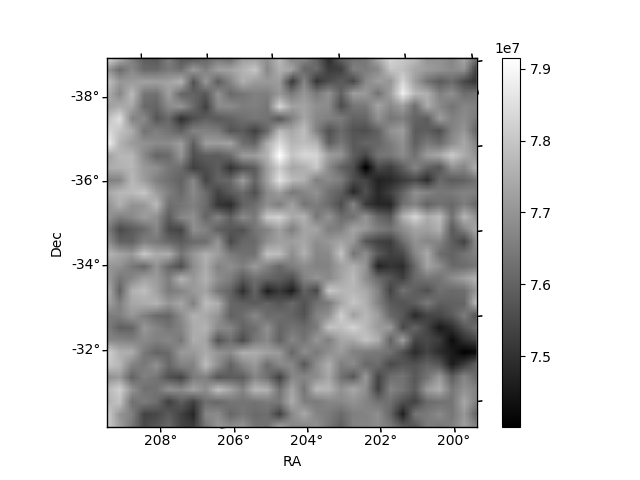 |
| Module-wise count rates for Quadrant C Data is divided into 100 sec bins |
 |
 |
| Module-wise count rates for Quadrant D Data is divided into 100 sec bins |
 |
 |
| Parameter | Plot |
|---|---|
| CZT HV Monitor | 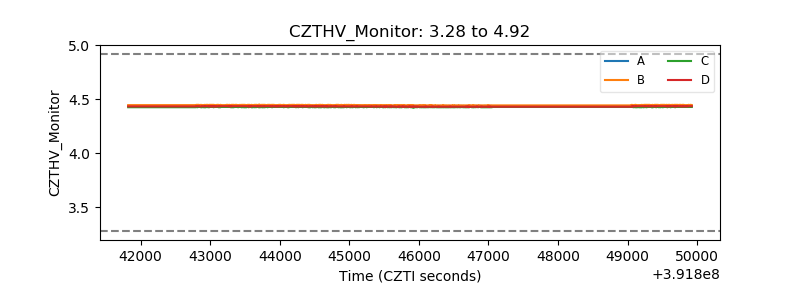 |
| D_VDD | 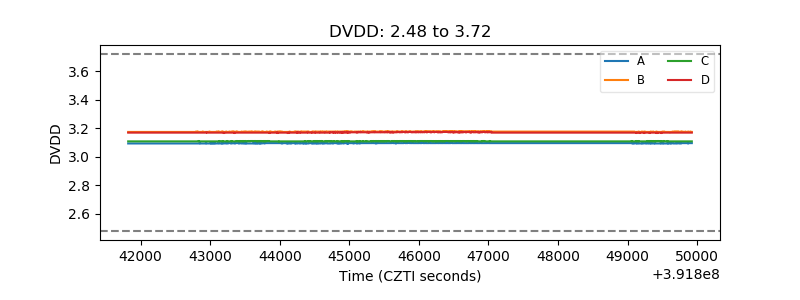 |
| Temperature 1 | 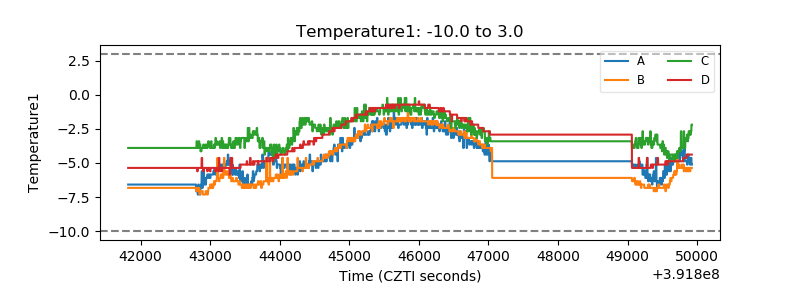 |
| Veto HV Monitor |  |
| Veto LLD | 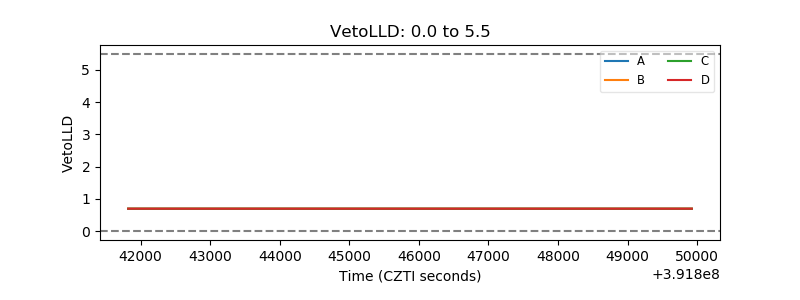 |
| Alpha Counter | 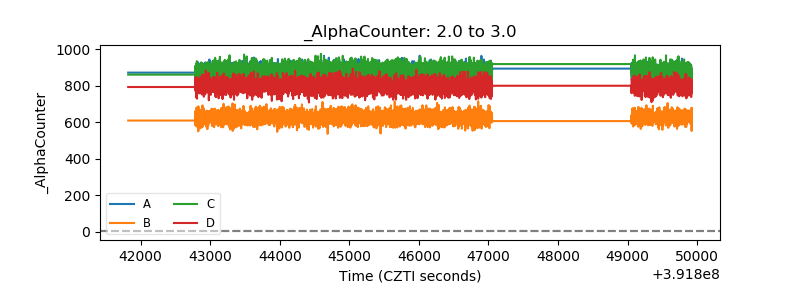 |
| _CPM_Rate | 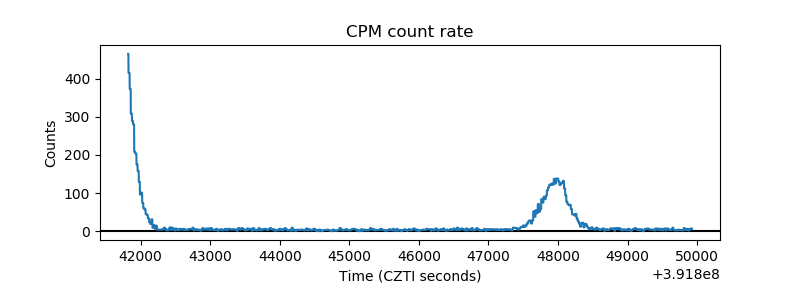 |
| CZT Counter | 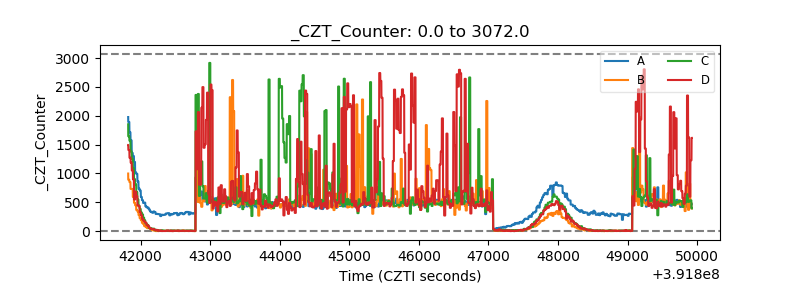 |
| +2.5 Volts monitor | 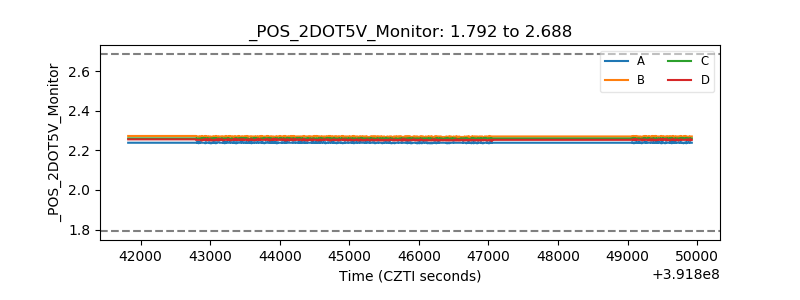 |
| +5 Volts monitor | 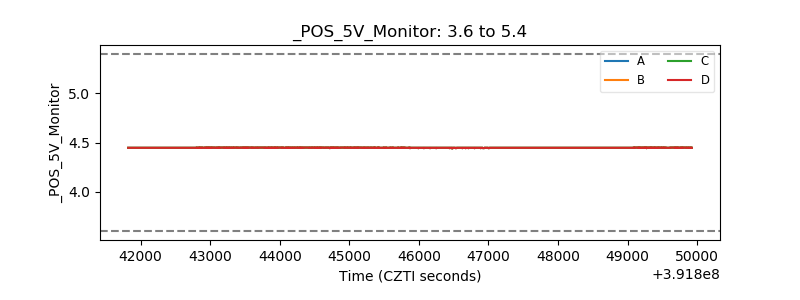 |
| _ROLL_ROT | 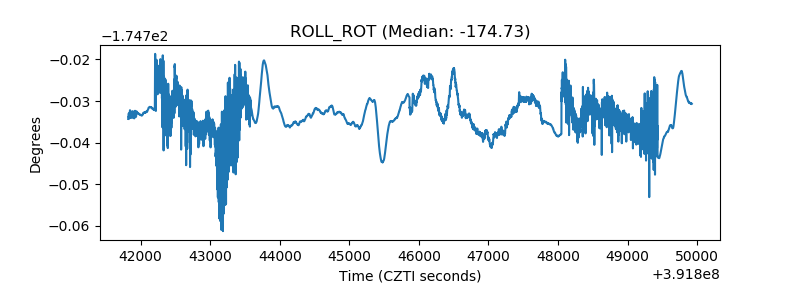 |
| _Roll_DEC | 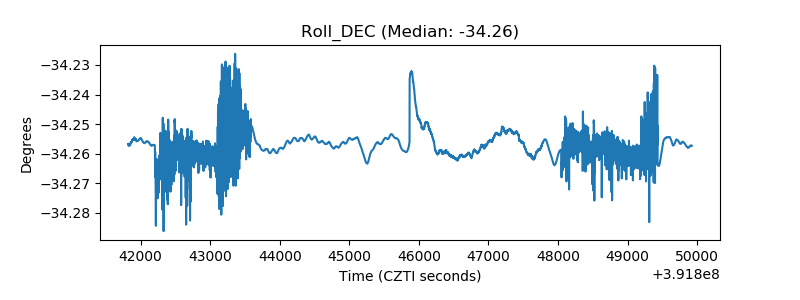 |
| _Roll_RA | 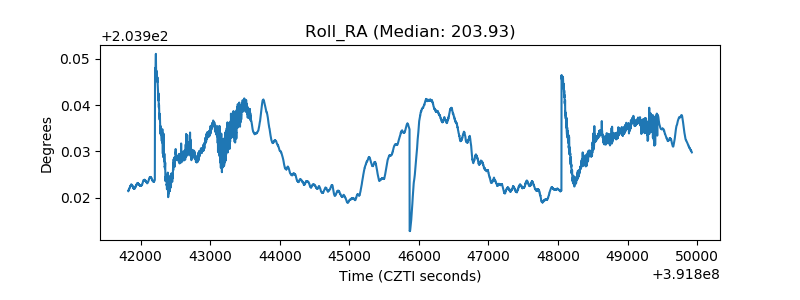 |
| Veto Counter | 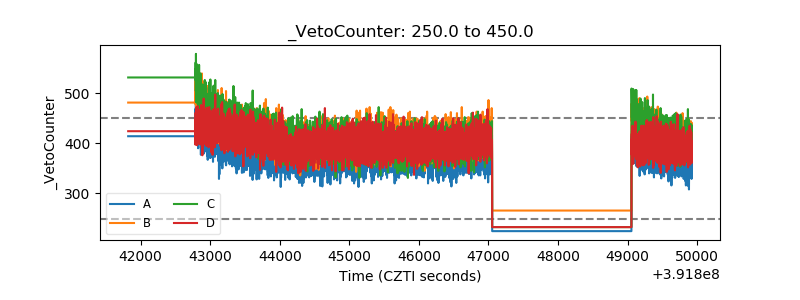 |