| Param | Original file | Final file |
|---|---|---|
| Filename | modeM0/AS1T04_069T01_9000005158_36103cztM0_level2.evt | modeM0/AS1T04_069T01_9000005158_36103cztM0_level2_quad_clean.evt |
| Size (bytes) | 455,224,320 | 45,339,840 |
| Size | 434.1 MB | 43.2 MB |
| Events in quadrant A | 2,702,024 | 262,634 |
| Events in quadrant B | 3,822,552 | 255,206 |
| Events in quadrant C | 3,381,790 | 259,344 |
| Events in quadrant D | 3,537,895 | 241,499 |
| Mode M0 | |||
|---|---|---|---|
| Quadrant | BADHDUFLAG | Total packets | Discarded packets |
| A | 0 | 10864 | 3 |
| B | 0 | 14583 | 2 |
| C | 0 | 12986 | 2 |
| D | 0 | 13823 | 2 |
| Mode M9 | |||
|---|---|---|---|
| Quadrant | BADHDUFLAG | Total packets | Discarded packets |
| A | 0 | 32 | 0 |
| B | 0 | 32 | 0 |
| C | 0 | 32 | 0 |
| D | 0 | 33 | 0 |
| Mode SS | |||
|---|---|---|---|
| Quadrant | BADHDUFLAG | Total packets | Discarded packets |
| A | 0 | 104 | 0 |
| B | 0 | 104 | 0 |
| C | 0 | 104 | 0 |
| D | 0 | 104 | 0 |
| Quadrant | Total seconds | Saturated seconds | Saturation percentage |
|---|---|---|---|
| A | 5038 | 6 | 0.119095% |
| B | 5038 | 361 | 7.165542% |
| C | 5038 | 151 | 2.997221% |
| D | 5038 | 243 | 4.823343% |
Noise dominated data is calculated using 1-second bins in cleaned event files. If a bin has >2000 counts, and if more than 50% of those come from <1% of pixels, then it is considered to be noise-dominated and hence unusable.
| Quadrant | # 1 sec bins | Bins with >0 counts | Bins with >2000 counts | High rate bins dominated by noise | Noise dominated (total time) | Noise dominated (detector-on time) | Marked lightcurve |
|---|---|---|---|---|---|---|---|
| A | 7161 | 5039 | 0 | 0 | 0.00% | 0.00% | 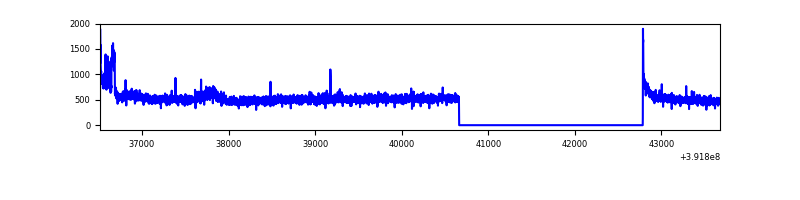 |
| B | 7161 | 5039 | 241 | 241 | 3.37% | 4.78% | 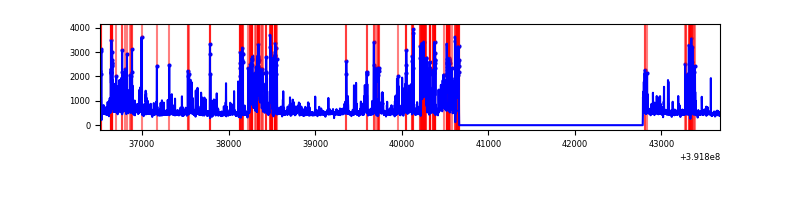 |
| C | 7161 | 5039 | 122 | 122 | 1.70% | 2.42% | 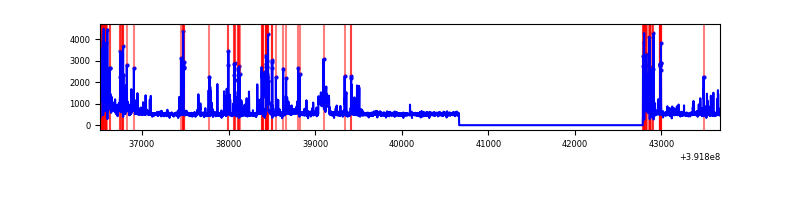 |
| D | 7161 | 5039 | 200 | 200 | 2.79% | 3.97% | 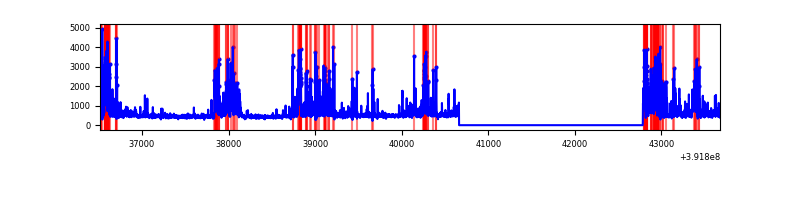 |
Top three noisy pixels from each quadrant. If the there are fewer than three noisy pixels in the level2.evt file, extra rows are filled as -1
| Pixel properties | Quadrant properties | ||||||
|---|---|---|---|---|---|---|---|
| Quadrant | DetID | PixID | Counts | Sigma | Mean | Median | Sigma |
| A | 10 | 83 | 169340 | 1370.99 | 608 | 596 | 123.1 |
| A | 15 | 223 | 165250 | 1337.76 | 608 | 596 | 123.1 |
| A | 8 | 144 | 8506 | 64.27 | 608 | 596 | 123.1 |
| B | 5 | 172 | 565950 | 5017.44 | 591 | 576 | 112.7 |
| B | 5 | 236 | 425396 | 3770.08 | 591 | 576 | 112.7 |
| B | 5 | 255 | 333222 | 2952.08 | 591 | 576 | 112.7 |
| C | 0 | 207 | 408178 | 2968.69 | 588 | 593 | 137.3 |
| C | 1 | 23 | 238210 | 1730.71 | 588 | 593 | 137.3 |
| C | 15 | 214 | 227587 | 1653.34 | 588 | 593 | 137.3 |
| D | 12 | 6 | 352677 | 2488.05 | 579 | 563 | 141.5 |
| D | 1 | 52 | 235947 | 1663.23 | 579 | 563 | 141.5 |
| D | 13 | 249 | 202478 | 1426.74 | 579 | 563 | 141.5 |
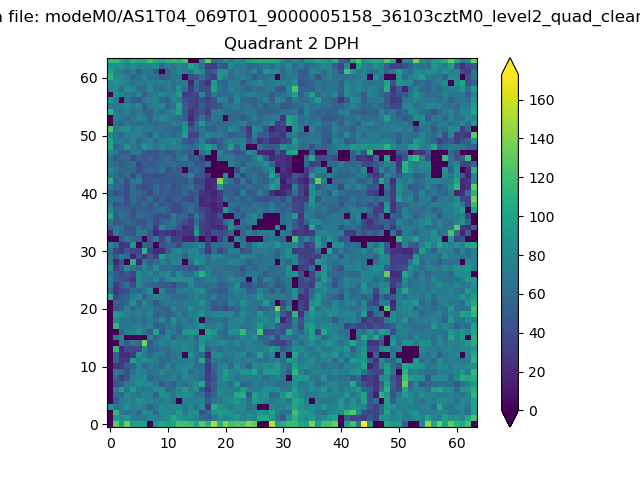
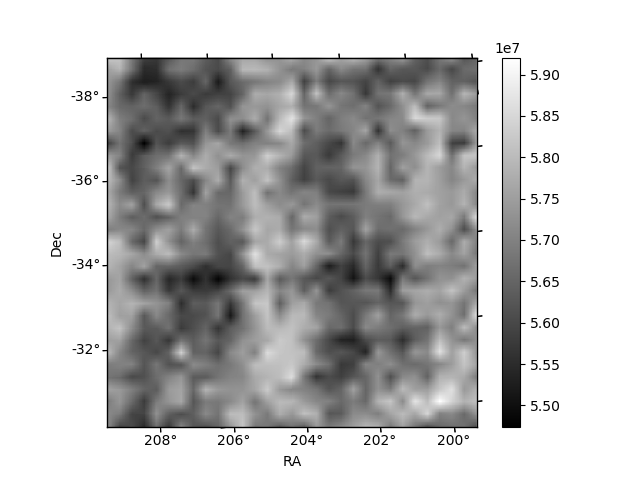
Histogram calculated using DETX and DETY for each event in the final _common_clean file
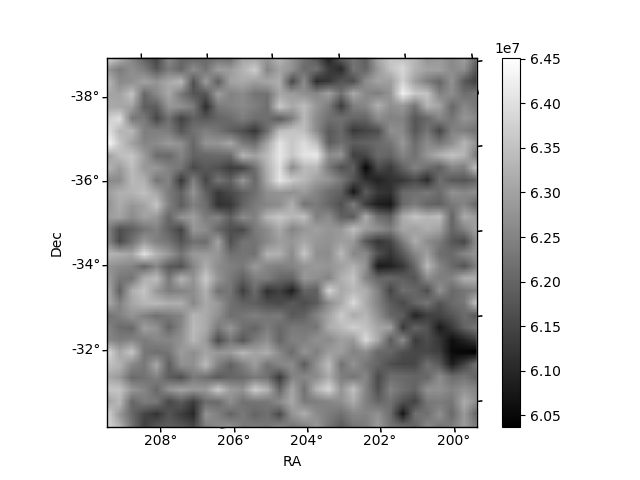
| Quadrant A | 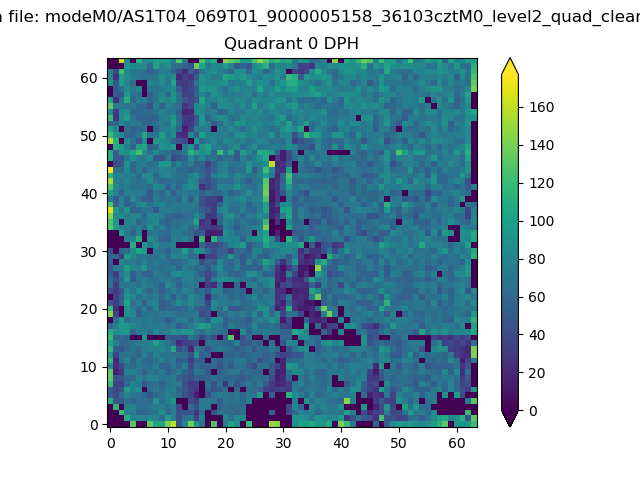 |
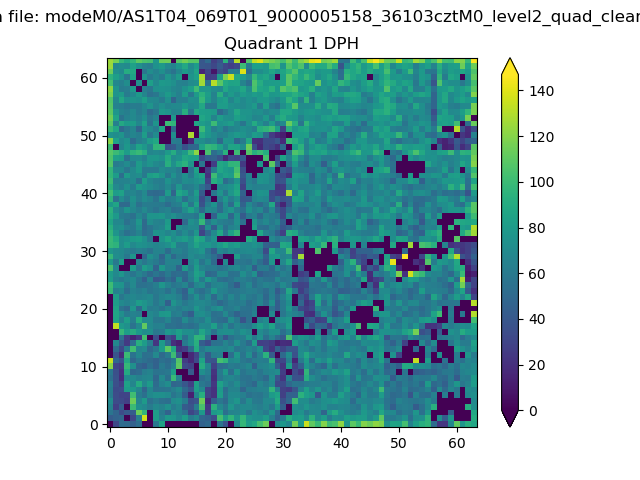 |
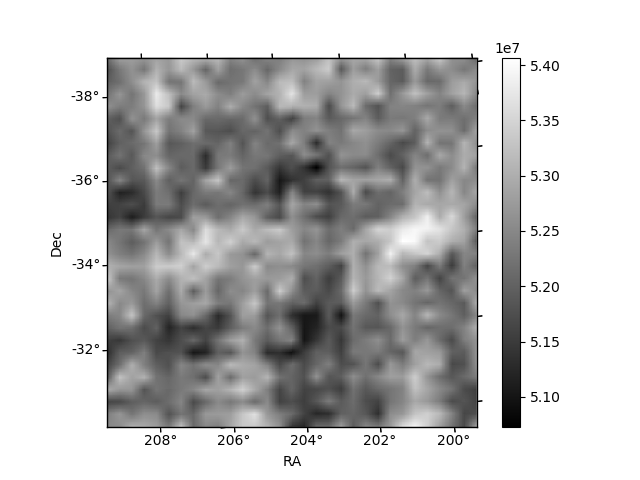
Quadrant B |
|---|---|---|---|
| Quadrant D | 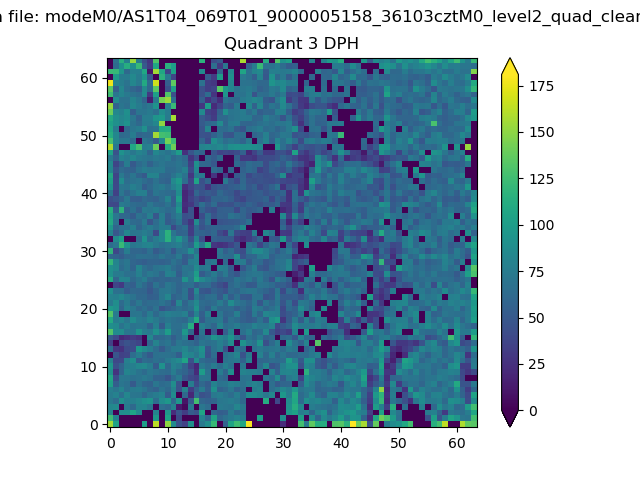 |
 |
Quadrant C |
| Plot type | Count rate plots | Images |
|---|---|---|
| Comparison with Poisson distribution Blue bars denote a histogram of data divided into 1 sec bins. Red curve is a Poisson curve with rate = median count rate of data. |
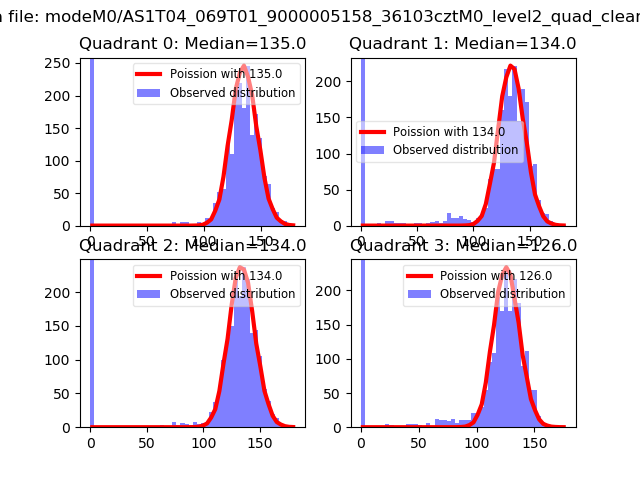 |
 |
| Quadrant-wise count rates Data is divided into 100 sec bins |
 |
|
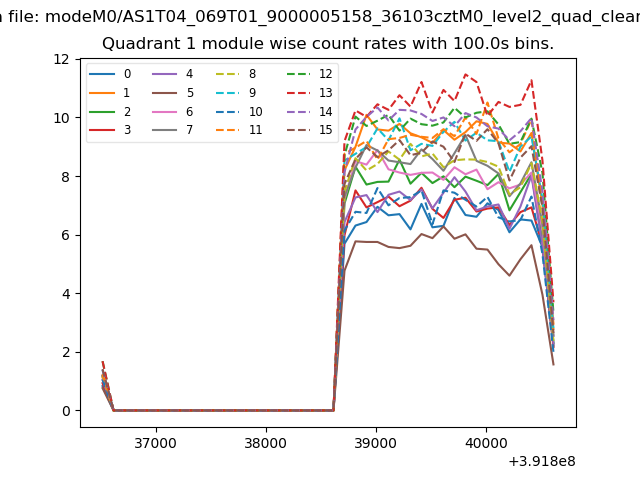
| Module-wise count rates for Quadrant A Data is divided into 100 sec bins |
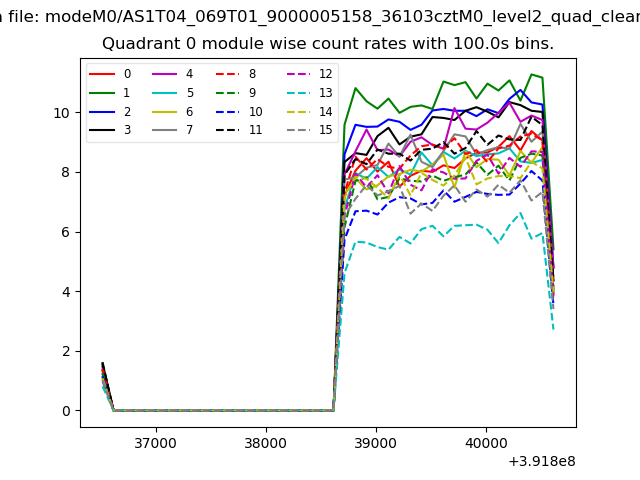 |
 |
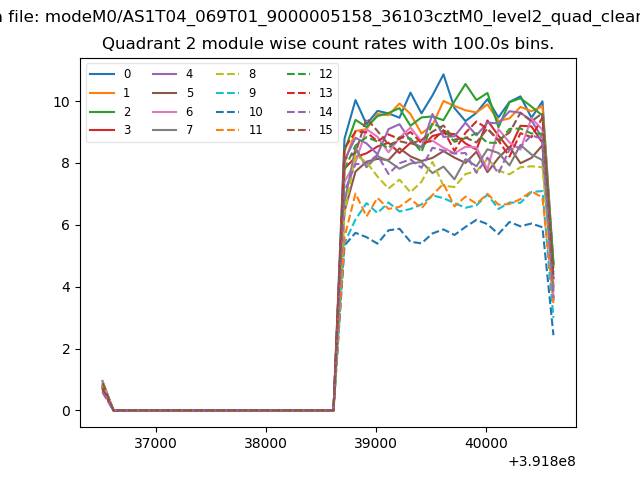
| Module-wise count rates for Quadrant B Data is divided into 100 sec bins |
 |
 |
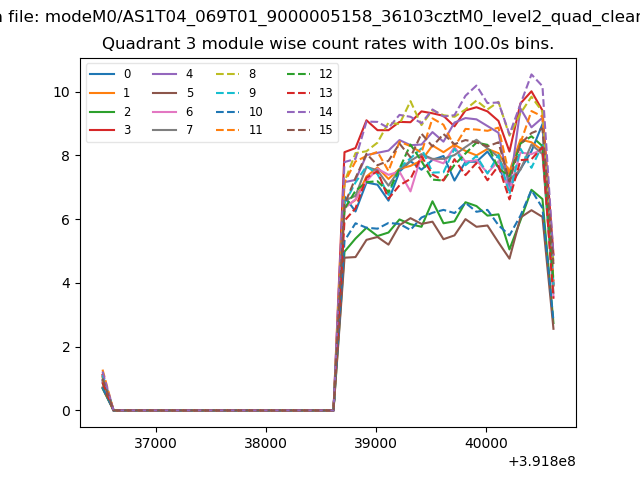
| Module-wise count rates for Quadrant C Data is divided into 100 sec bins |
 |
 |
| Module-wise count rates for Quadrant D Data is divided into 100 sec bins |
 |
 |
| Parameter | Plot |
|---|---|
| CZT HV Monitor | 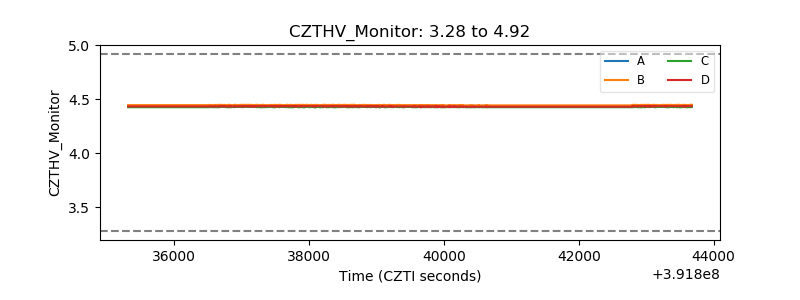 |
| D_VDD | 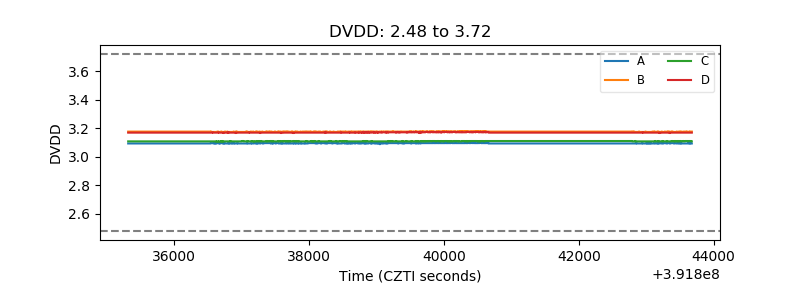 |
| Temperature 1 | 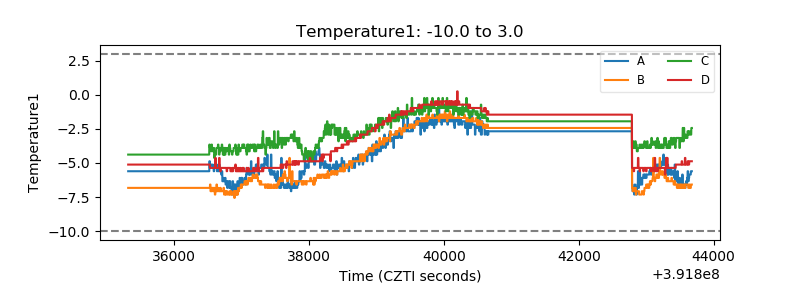 |
| Veto HV Monitor | 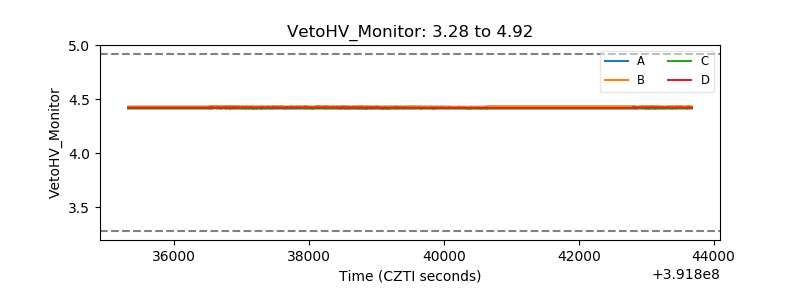 |
| Veto LLD | 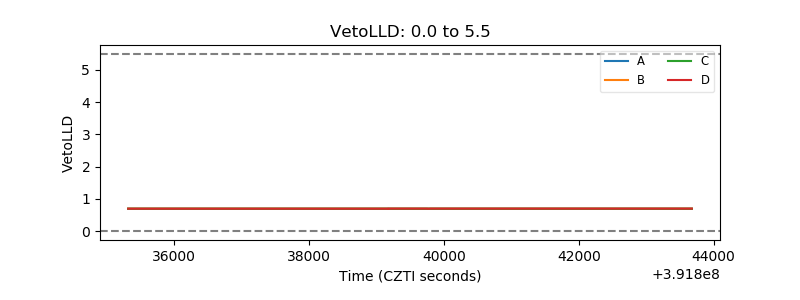 |
| Alpha Counter | 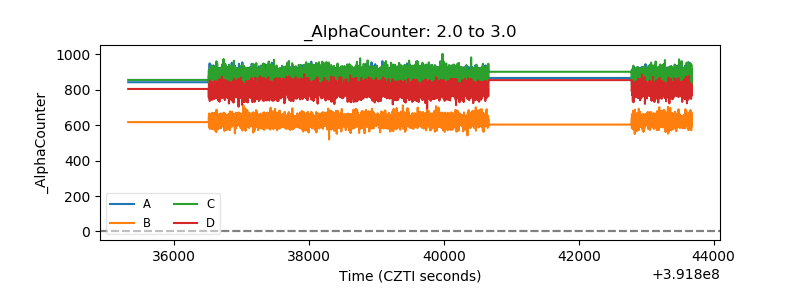 |
| _CPM_Rate | 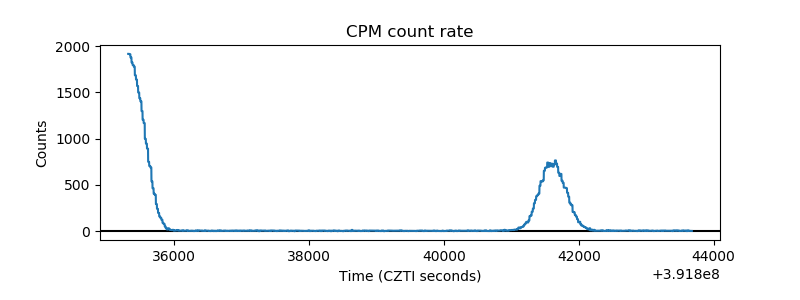 |
| CZT Counter | 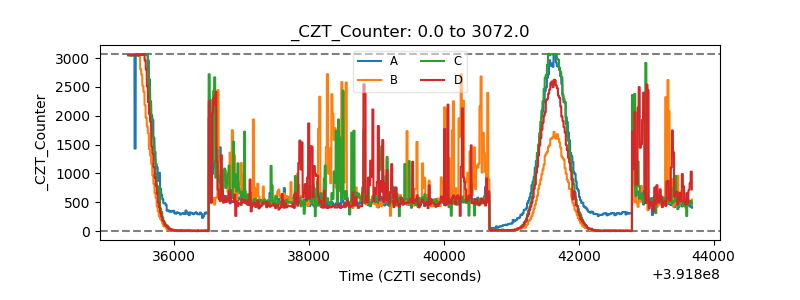 |
| +2.5 Volts monitor | 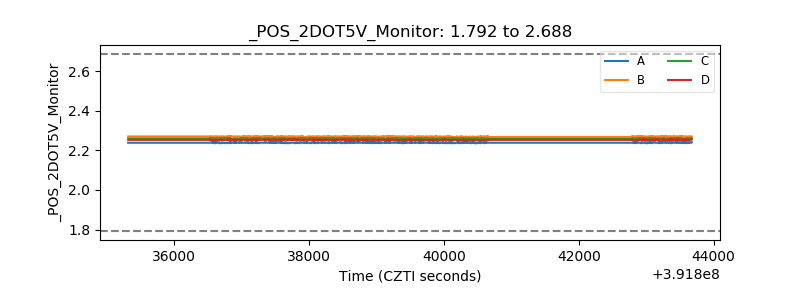 |
| +5 Volts monitor | 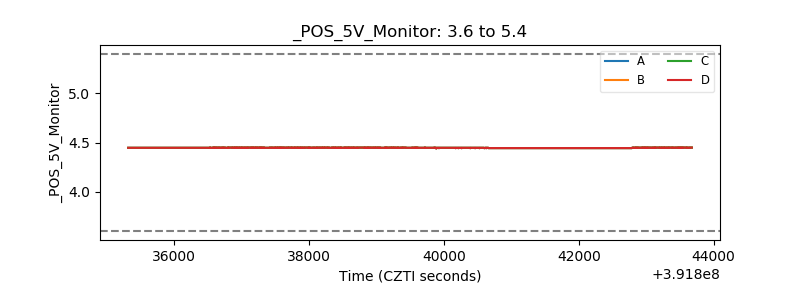 |
| _ROLL_ROT | 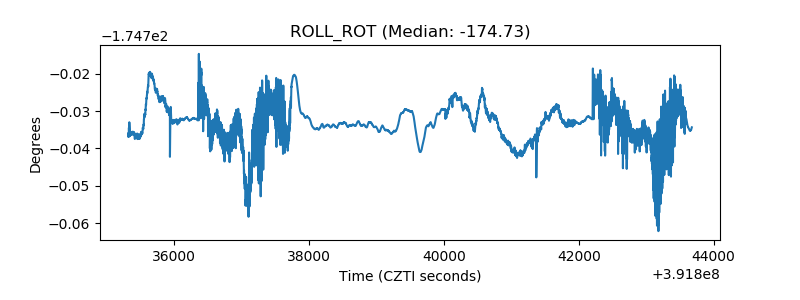 |
| _Roll_DEC | 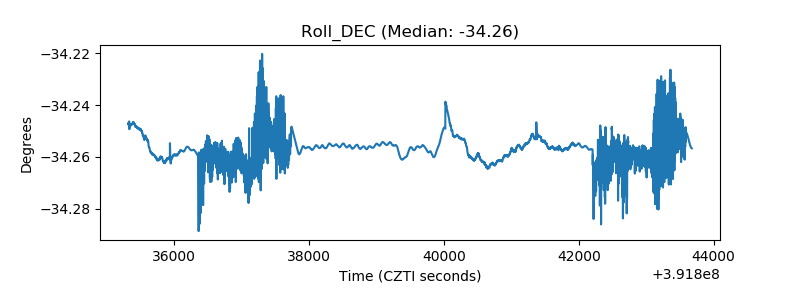 |
| _Roll_RA | 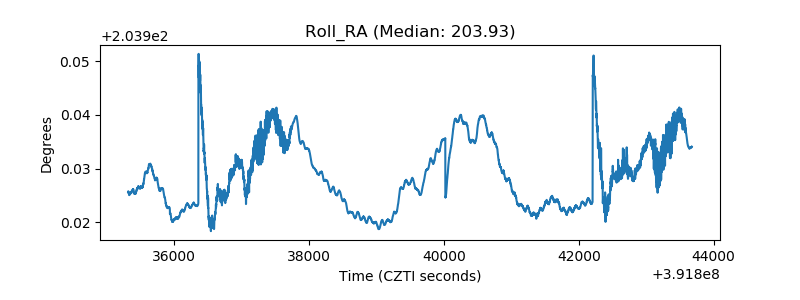 |
| Veto Counter | 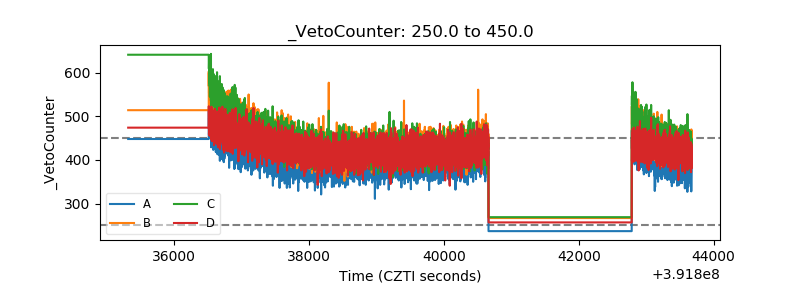 |