| Param | Original file | Final file |
|---|---|---|
| Filename | modeM0/AS1T04_069T01_9000005158_36100cztM0_level2.evt | modeM0/AS1T04_069T01_9000005158_36100cztM0_level2_quad_clean.evt |
| Size (bytes) | 434,540,160 | 63,947,520 |
| Size | 414.4 MB | 61.0 MB |
| Events in quadrant A | 2,541,831 | 409,192 |
| Events in quadrant B | 3,184,335 | 409,088 |
| Events in quadrant C | 3,149,983 | 391,439 |
| Events in quadrant D | 3,936,885 | 368,545 |
| Mode M0 | |||
|---|---|---|---|
| Quadrant | BADHDUFLAG | Total packets | Discarded packets |
| A | 0 | 10694 | 3 |
| B | 0 | 12607 | 2 |
| C | 0 | 12371 | 2 |
| D | 0 | 15113 | 2 |
| Mode M9 | |||
|---|---|---|---|
| Quadrant | BADHDUFLAG | Total packets | Discarded packets |
| A | 0 | 34 | 0 |
| B | 0 | 34 | 0 |
| C | 0 | 34 | 0 |
| D | 0 | 35 | 0 |
| Mode SS | |||
|---|---|---|---|
| Quadrant | BADHDUFLAG | Total packets | Discarded packets |
| A | 0 | 104 | 0 |
| B | 0 | 104 | 0 |
| C | 0 | 104 | 0 |
| D | 0 | 104 | 0 |
| Quadrant | Total seconds | Saturated seconds | Saturation percentage |
|---|---|---|---|
| A | 5106 | 5 | 0.097924% |
| B | 5106 | 168 | 3.290247% |
| C | 5106 | 140 | 2.741872% |
| D | 5106 | 400 | 7.833921% |
Noise dominated data is calculated using 1-second bins in cleaned event files. If a bin has >2000 counts, and if more than 50% of those come from <1% of pixels, then it is considered to be noise-dominated and hence unusable.
| Quadrant | # 1 sec bins | Bins with >0 counts | Bins with >2000 counts | High rate bins dominated by noise | Noise dominated (total time) | Noise dominated (detector-on time) | Marked lightcurve |
|---|---|---|---|---|---|---|---|
| A | 7019 | 5107 | 1 | 1 | 0.01% | 0.02% | 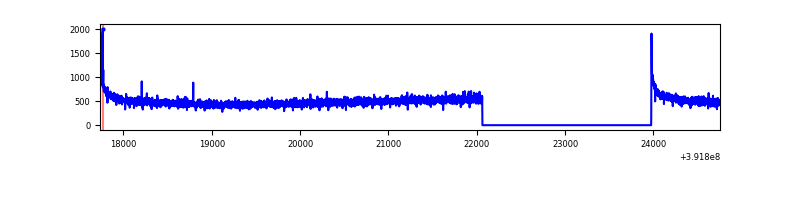 |
| B | 7019 | 5107 | 110 | 110 | 1.57% | 2.15% | 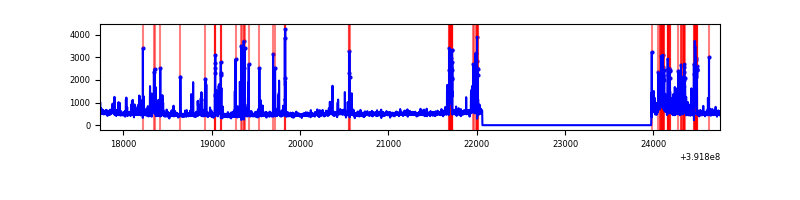 |
| C | 7019 | 5107 | 111 | 111 | 1.58% | 2.17% | 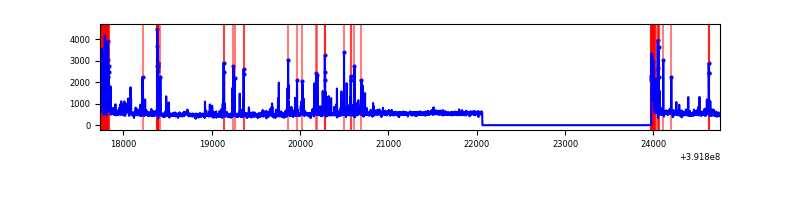 |
| D | 7019 | 5107 | 359 | 359 | 5.11% | 7.03% | 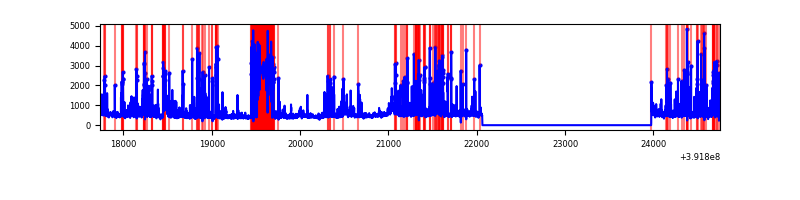 |
Top three noisy pixels from each quadrant. If the there are fewer than three noisy pixels in the level2.evt file, extra rows are filled as -1
| Pixel properties | Quadrant properties | ||||||
|---|---|---|---|---|---|---|---|
| Quadrant | DetID | PixID | Counts | Sigma | Mean | Median | Sigma |
| A | 10 | 83 | 169059 | 1372.65 | 609 | 599 | 122.7 |
| A | 13 | 6 | 8264 | 62.46 | 609 | 599 | 122.7 |
| A | 13 | 254 | 6490 | 48.0 | 609 | 599 | 122.7 |
| B | 5 | 172 | 393720 | 3400.08 | 604 | 589 | 115.6 |
| B | 5 | 236 | 151065 | 1301.43 | 604 | 589 | 115.6 |
| B | 5 | 255 | 105114 | 904.01 | 604 | 589 | 115.6 |
| C | 0 | 207 | 368676 | 2711.45 | 584 | 589 | 135.8 |
| C | 0 | 10 | 260970 | 1918.05 | 584 | 589 | 135.8 |
| C | 15 | 214 | 227965 | 1674.93 | 584 | 589 | 135.8 |
| D | 1 | 52 | 824091 | 5935.53 | 563 | 547 | 138.7 |
| D | 12 | 6 | 402795 | 2899.12 | 563 | 547 | 138.7 |
| D | 13 | 249 | 358345 | 2578.75 | 563 | 547 | 138.7 |
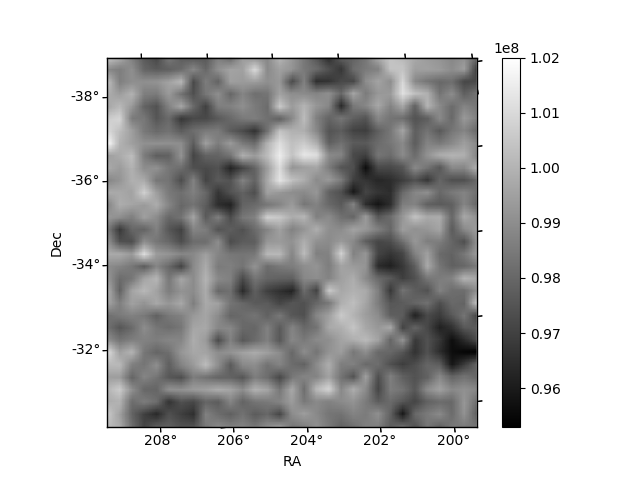
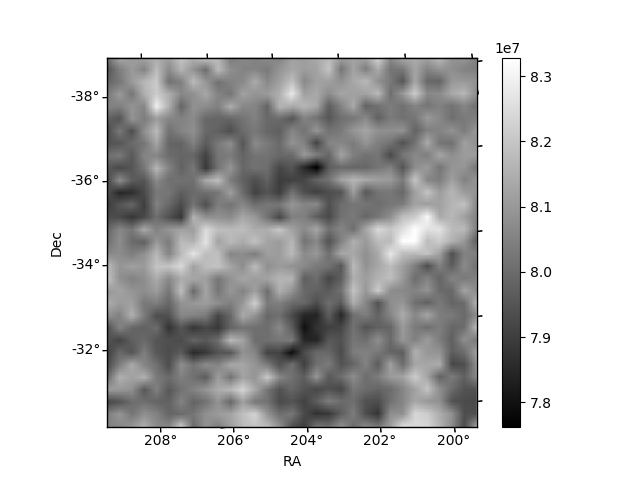
Histogram calculated using DETX and DETY for each event in the final _common_clean file
| Quadrant A | 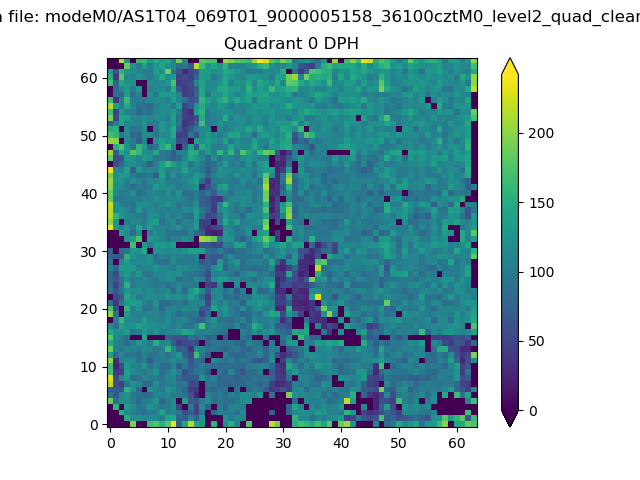 |
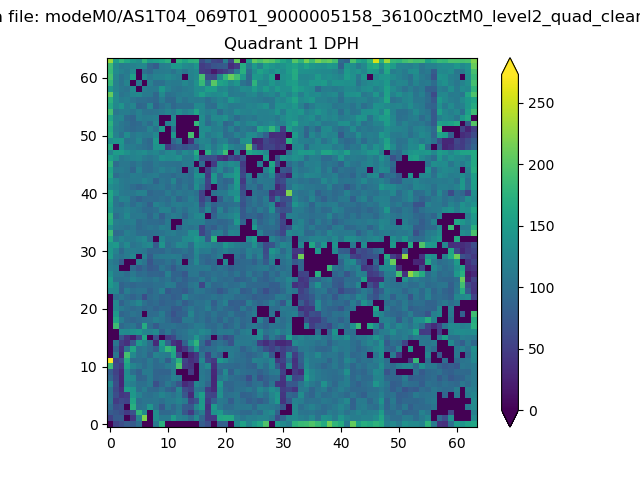 |
Quadrant B |
|---|---|---|---|
| Quadrant D | 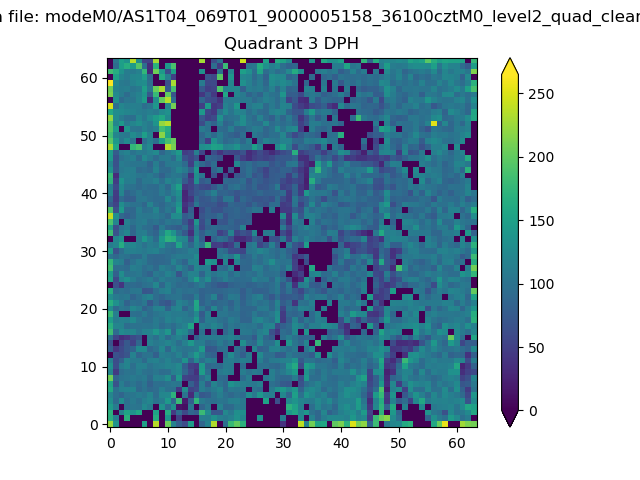 |
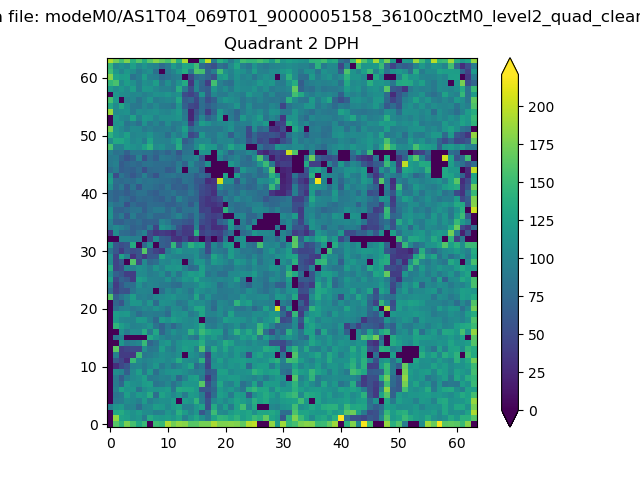 |
Quadrant C |
| Plot type | Count rate plots | Images |
|---|---|---|
| Comparison with Poisson distribution Blue bars denote a histogram of data divided into 1 sec bins. Red curve is a Poisson curve with rate = median count rate of data. |
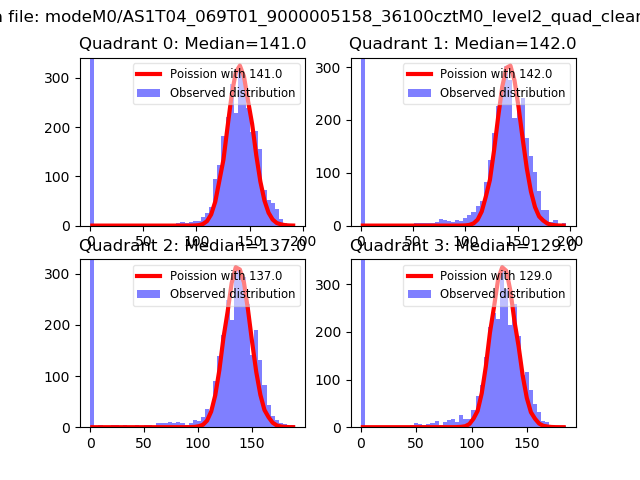 |
 |
| Quadrant-wise count rates Data is divided into 100 sec bins |
 |
|
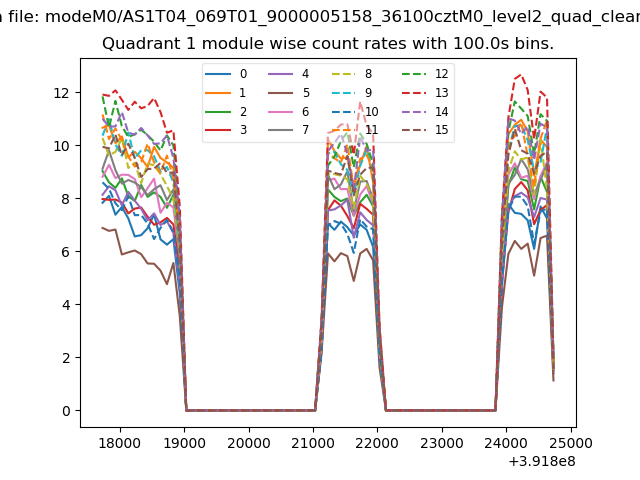
| Module-wise count rates for Quadrant A Data is divided into 100 sec bins |
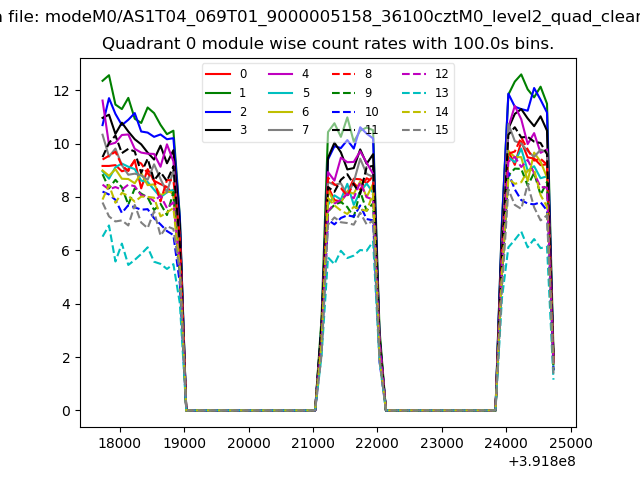 |
 |
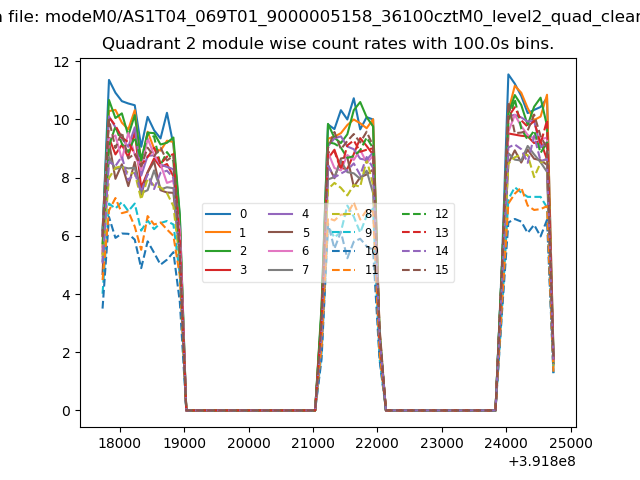
| Module-wise count rates for Quadrant B Data is divided into 100 sec bins |
 |
 |
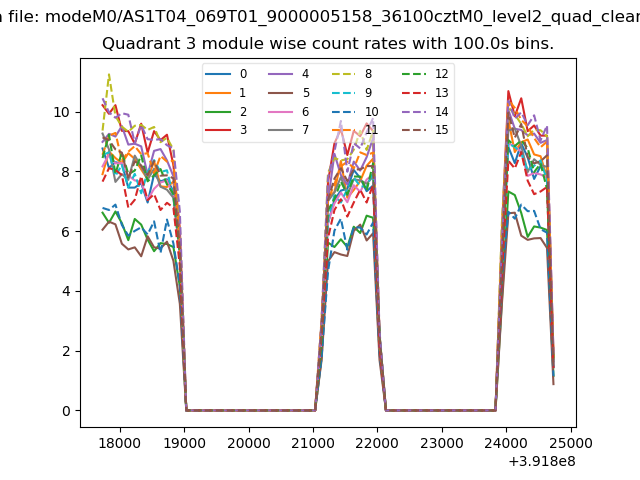
| Module-wise count rates for Quadrant C Data is divided into 100 sec bins |
 |
 |
| Module-wise count rates for Quadrant D Data is divided into 100 sec bins |
 |
 |
| Parameter | Plot |
|---|---|
| CZT HV Monitor | 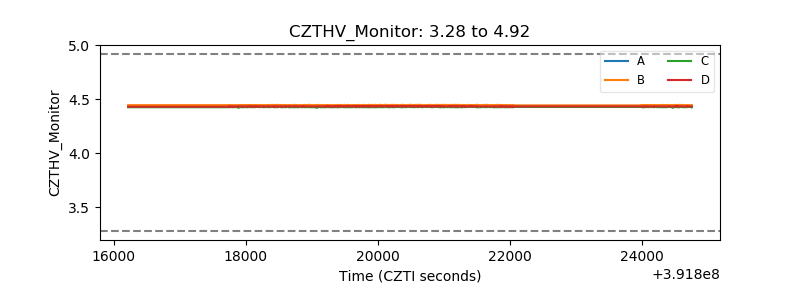 |
| D_VDD | 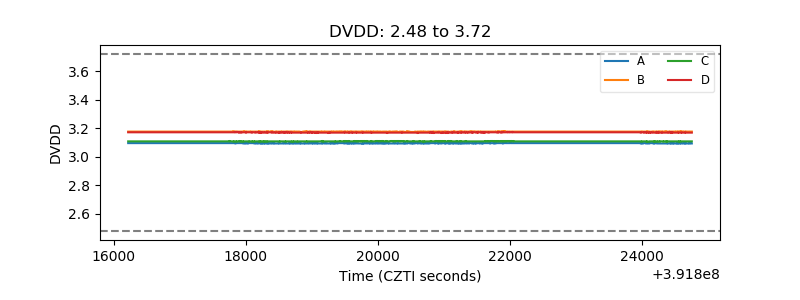 |
| Temperature 1 | 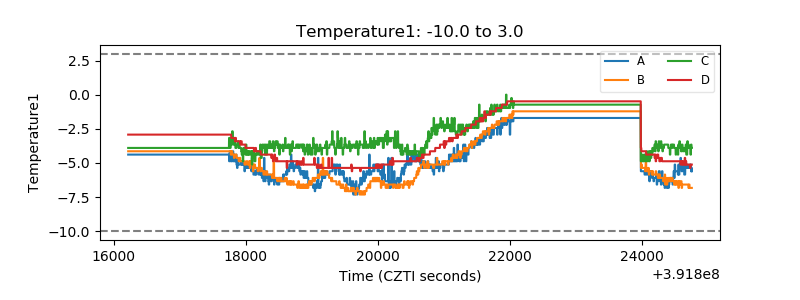 |
| Veto HV Monitor | 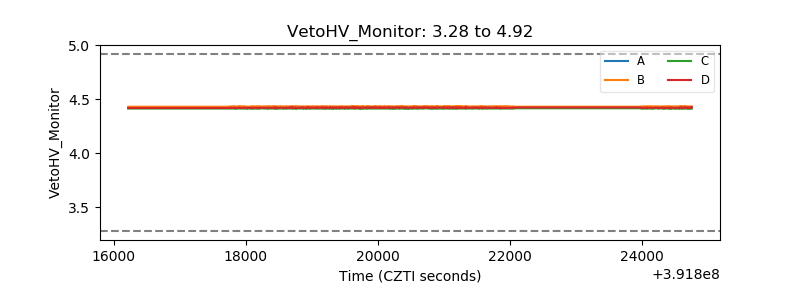 |
| Veto LLD | 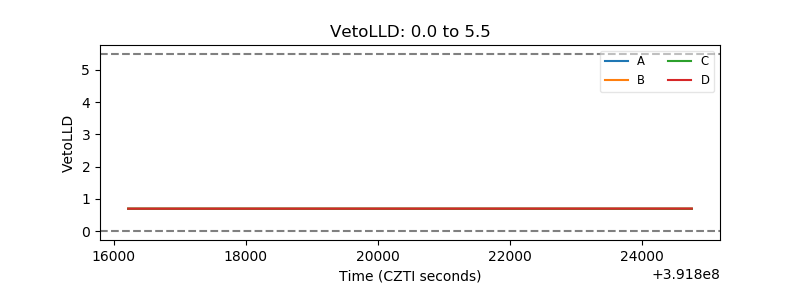 |
| Alpha Counter | 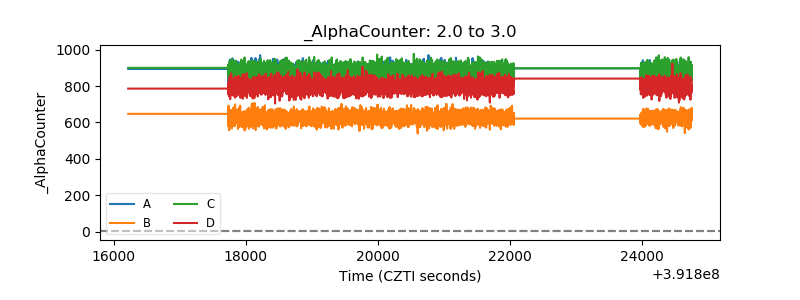 |
| _CPM_Rate | 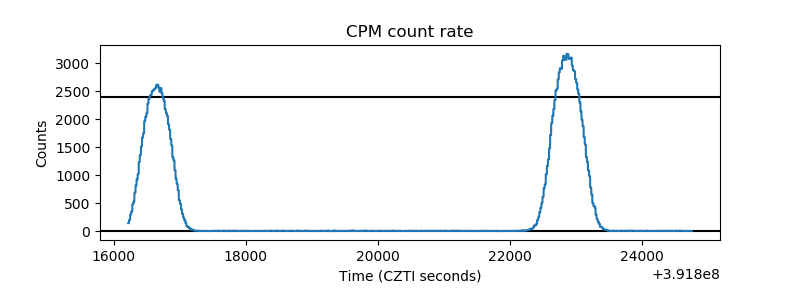 |
| CZT Counter | 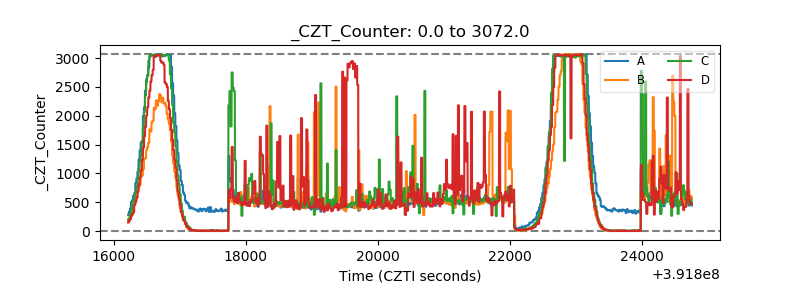 |
| +2.5 Volts monitor | 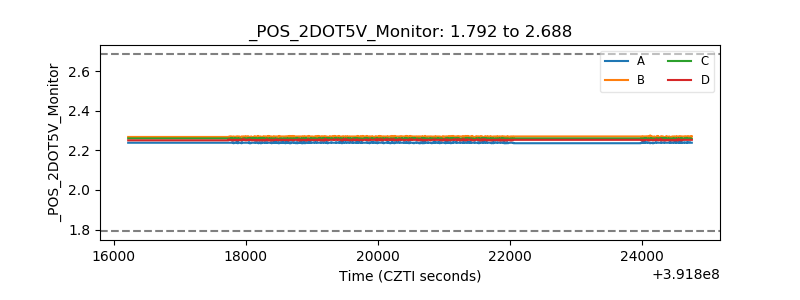 |
| +5 Volts monitor | 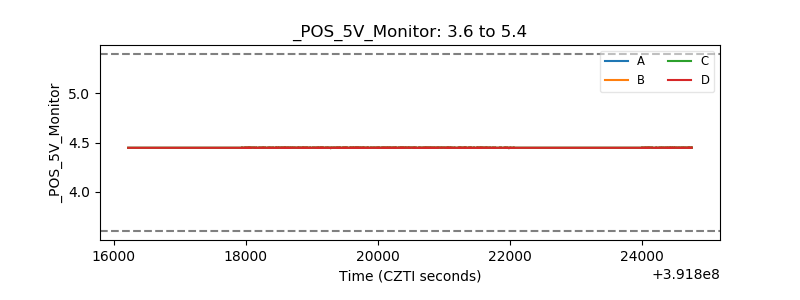 |
| _ROLL_ROT | 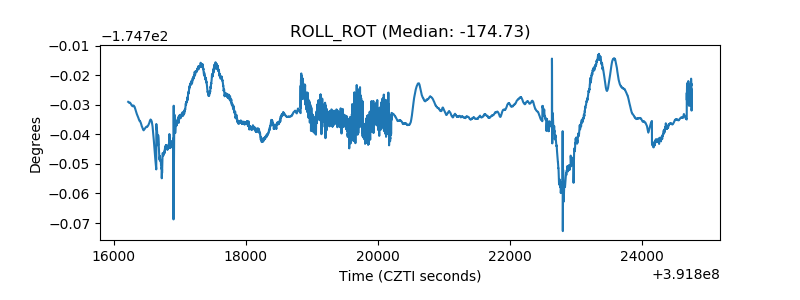 |
| _Roll_DEC | 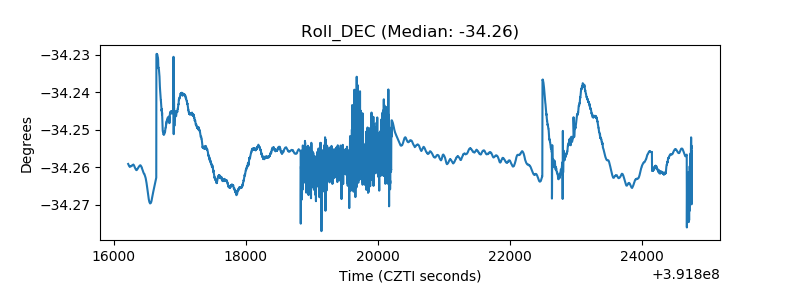 |
| _Roll_RA | 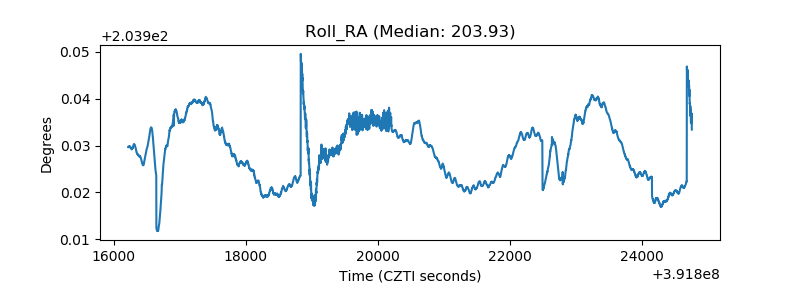 |
| Veto Counter | 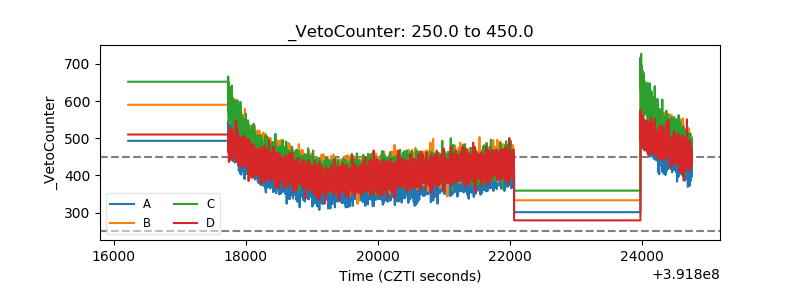 |