| Param | Original file | Final file |
|---|---|---|
| Filename | modeM0/AS1T04_069T01_9000005158_36095cztM0_level2.evt | modeM0/AS1T04_069T01_9000005158_36095cztM0_level2_quad_clean.evt |
| Size (bytes) | 700,778,880 | 119,888,640 |
| Size | 668.3 MB | 114.3 MB |
| Events in quadrant A | 4,225,553 | 778,517 |
| Events in quadrant B | 4,351,490 | 774,614 |
| Events in quadrant C | 4,316,923 | 753,132 |
| Events in quadrant D | 7,722,826 | 703,003 |
| Mode M0 | |||
|---|---|---|---|
| Quadrant | BADHDUFLAG | Total packets | Discarded packets |
| A | 0 | 18464 | 3 |
| B | 0 | 18780 | 2 |
| C | 0 | 18535 | 2 |
| D | 0 | 28931 | 2 |
| Mode M9 | |||
|---|---|---|---|
| Quadrant | BADHDUFLAG | Total packets | Discarded packets |
| A | 0 | 27 | 0 |
| B | 0 | 27 | 0 |
| C | 0 | 27 | 0 |
| D | 0 | 27 | 0 |
| Mode SS | |||
|---|---|---|---|
| Quadrant | BADHDUFLAG | Total packets | Discarded packets |
| A | 0 | 182 | 0 |
| B | 0 | 182 | 0 |
| C | 0 | 182 | 0 |
| D | 0 | 182 | 0 |
| Quadrant | Total seconds | Saturated seconds | Saturation percentage |
|---|---|---|---|
| A | 8959 | 8 | 0.089296% |
| B | 8959 | 33 | 0.368345% |
| C | 8959 | 22 | 0.245563% |
| D | 8959 | 951 | 10.615024% |
Noise dominated data is calculated using 1-second bins in cleaned event files. If a bin has >2000 counts, and if more than 50% of those come from <1% of pixels, then it is considered to be noise-dominated and hence unusable.
| Quadrant | # 1 sec bins | Bins with >0 counts | Bins with >2000 counts | High rate bins dominated by noise | Noise dominated (total time) | Noise dominated (detector-on time) | Marked lightcurve |
|---|---|---|---|---|---|---|---|
| A | 11615 | 8961 | 0 | 0 | 0.00% | 0.00% | 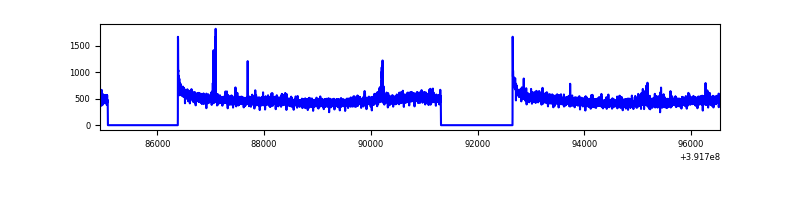 |
| B | 11615 | 8961 | 18 | 18 | 0.15% | 0.20% | 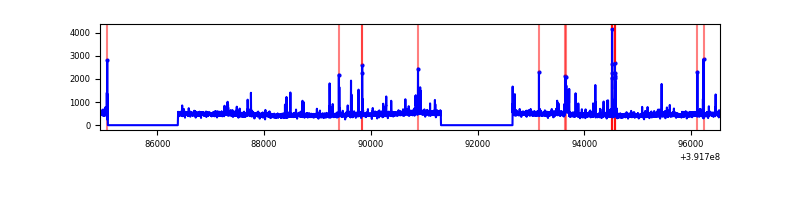 |
| C | 11615 | 8961 | 9 | 9 | 0.08% | 0.10% | 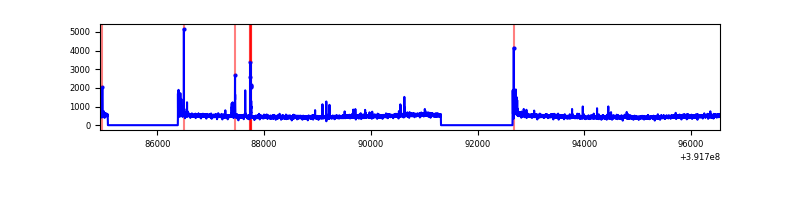 |
| D | 11615 | 8960 | 779 | 779 | 6.71% | 8.69% | 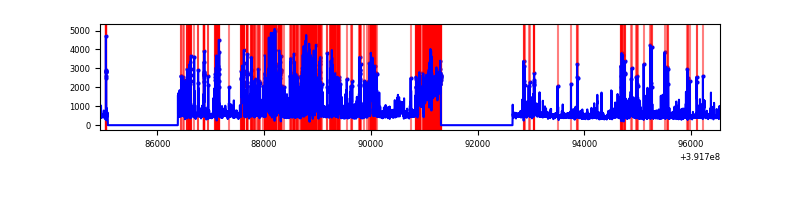 |
Top three noisy pixels from each quadrant. If the there are fewer than three noisy pixels in the level2.evt file, extra rows are filled as -1
| Pixel properties | Quadrant properties | ||||||
|---|---|---|---|---|---|---|---|
| Quadrant | DetID | PixID | Counts | Sigma | Mean | Median | Sigma |
| A | 10 | 83 | 233993 | 1142.27 | 1007 | 985 | 204.0 |
| A | 9 | 143 | 31730 | 150.72 | 1007 | 985 | 204.0 |
| A | 12 | 189 | 21161 | 98.91 | 1007 | 985 | 204.0 |
| B | 5 | 172 | 130328 | 666.94 | 999 | 972 | 194.0 |
| B | 0 | 190 | 93132 | 475.16 | 999 | 972 | 194.0 |
| B | 0 | 229 | 92642 | 472.64 | 999 | 972 | 194.0 |
| C | 15 | 214 | 394153 | 1751.33 | 966 | 973 | 224.5 |
| C | 0 | 10 | 125489 | 554.63 | 966 | 973 | 224.5 |
| C | 15 | 159 | 18741 | 79.14 | 966 | 973 | 224.5 |
| D | 1 | 52 | 2828246 | 12572.46 | 906 | 879 | 224.9 |
| D | 12 | 6 | 437934 | 1943.45 | 906 | 879 | 224.9 |
| D | 13 | 249 | 213381 | 944.93 | 906 | 879 | 224.9 |
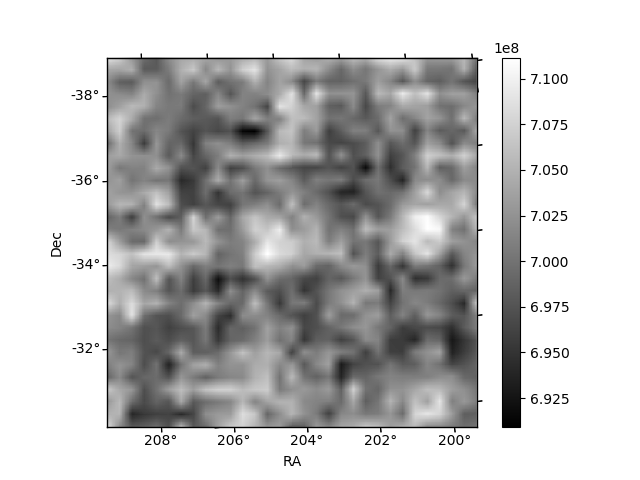
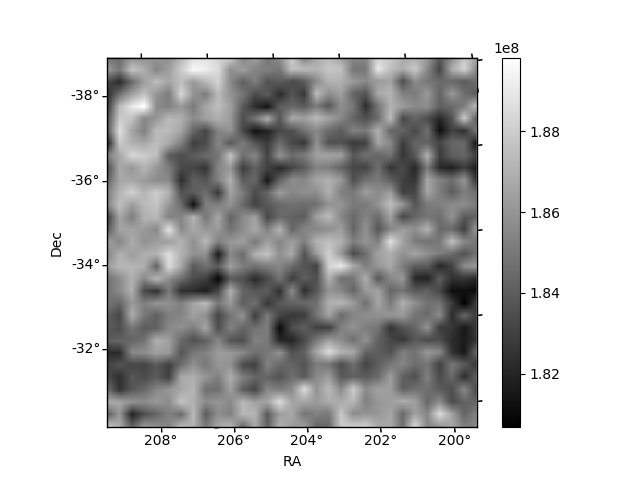
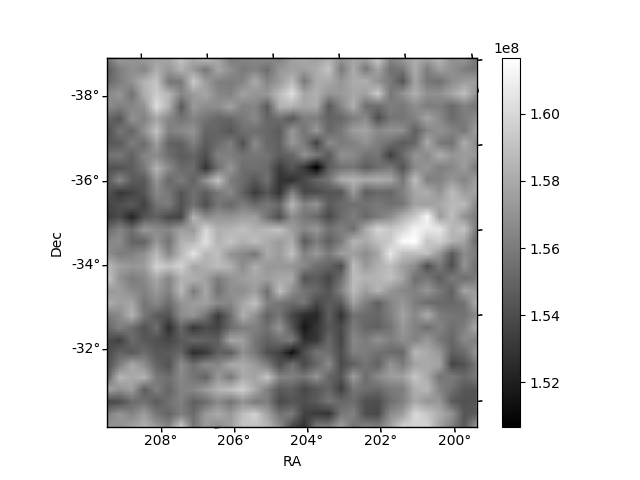
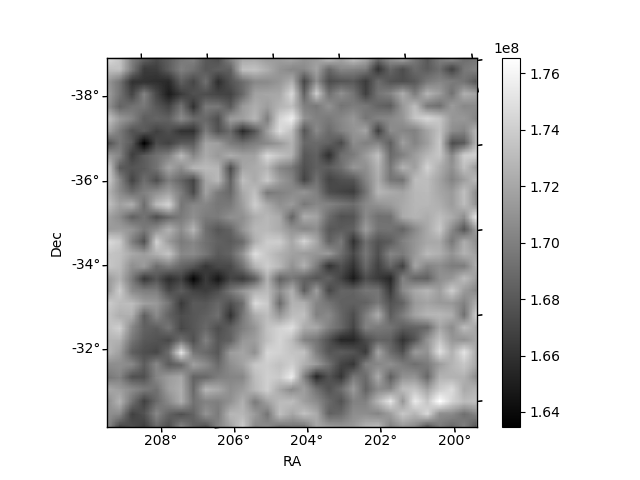
Histogram calculated using DETX and DETY for each event in the final _common_clean file
| Quadrant A | 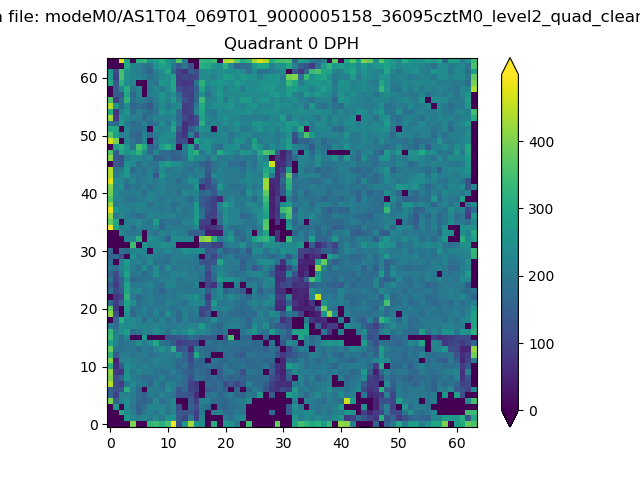 |
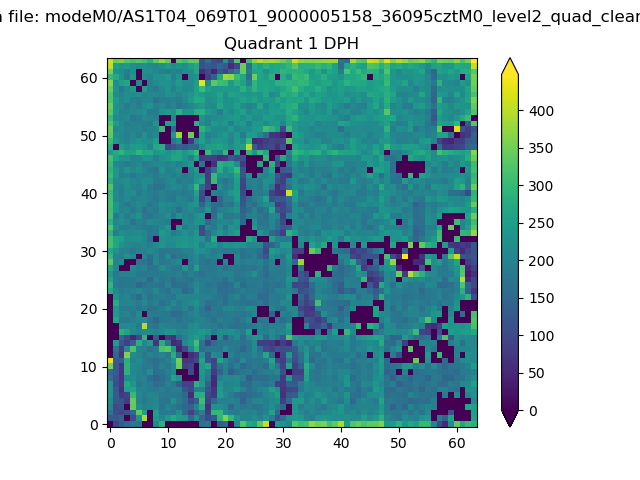 |
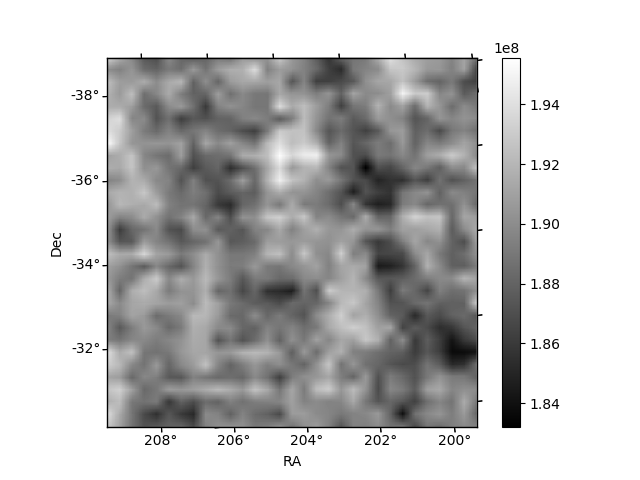
Quadrant B |
|---|---|---|---|
| Quadrant D | 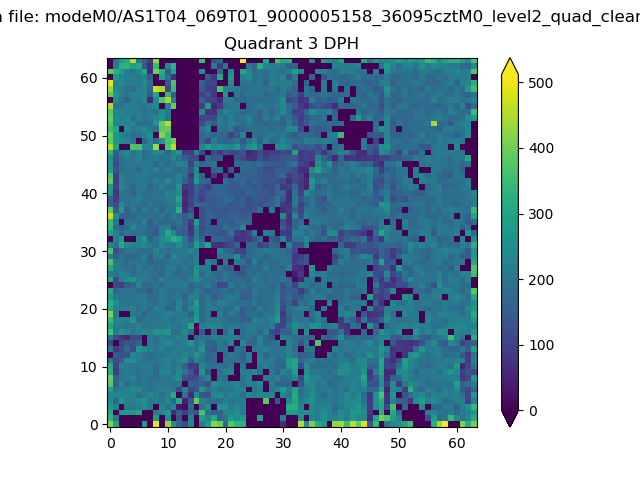 |
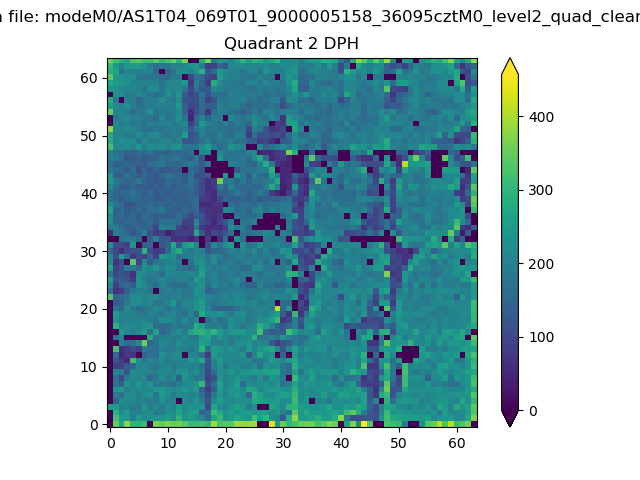 |
Quadrant C |
| Plot type | Count rate plots | Images |
|---|---|---|
| Comparison with Poisson distribution Blue bars denote a histogram of data divided into 1 sec bins. Red curve is a Poisson curve with rate = median count rate of data. |
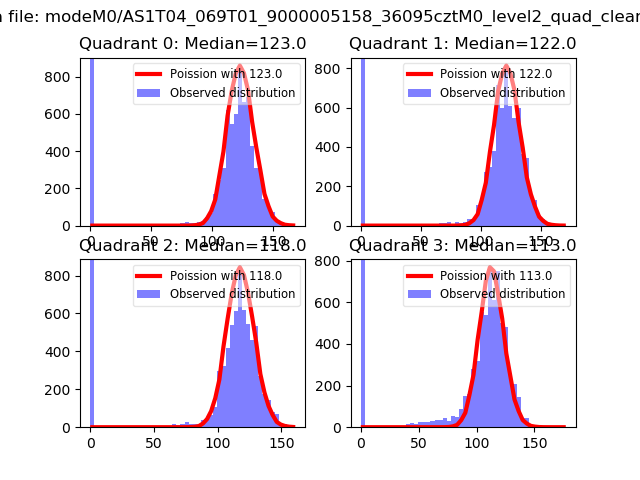 |
 |
| Quadrant-wise count rates Data is divided into 100 sec bins |
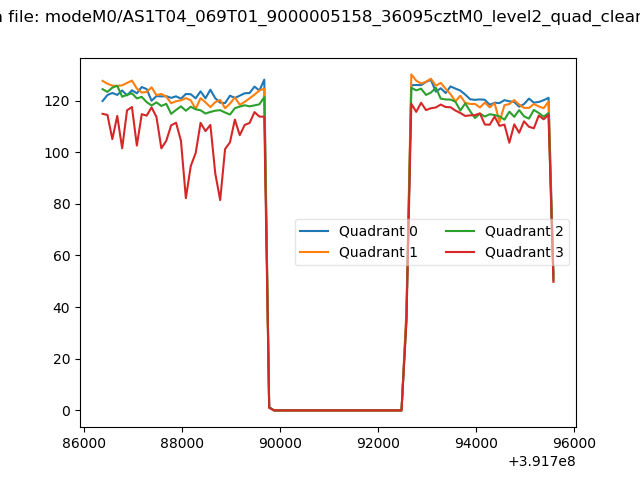 |
|
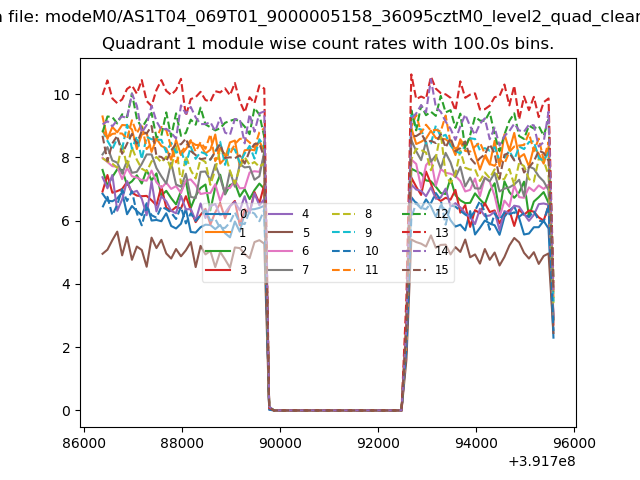
| Module-wise count rates for Quadrant A Data is divided into 100 sec bins |
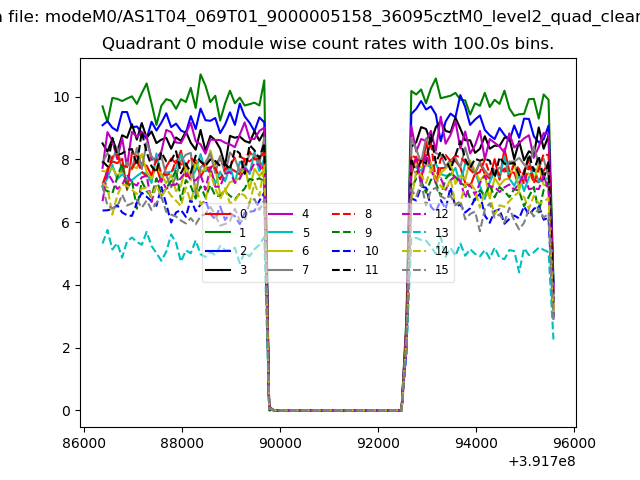 |
 |
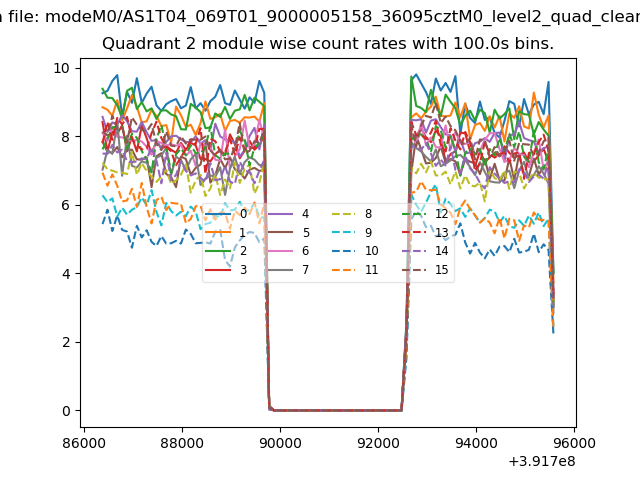
| Module-wise count rates for Quadrant B Data is divided into 100 sec bins |
 |
 |
| Module-wise count rates for Quadrant C Data is divided into 100 sec bins |
 |
 |
| Module-wise count rates for Quadrant D Data is divided into 100 sec bins |
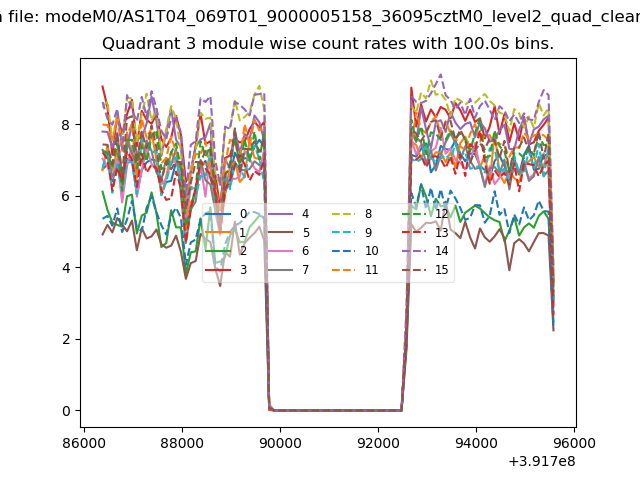 |
 |
| Parameter | Plot |
|---|---|
| CZT HV Monitor | 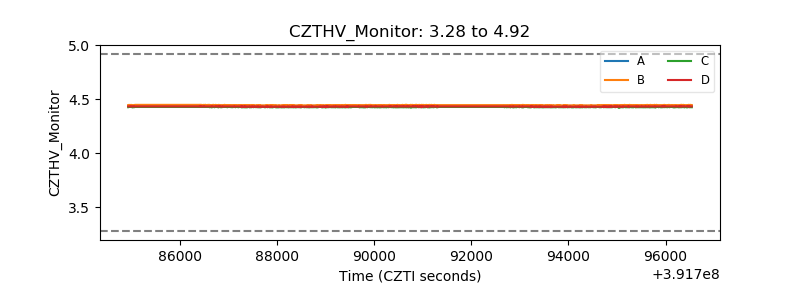 |
| D_VDD | 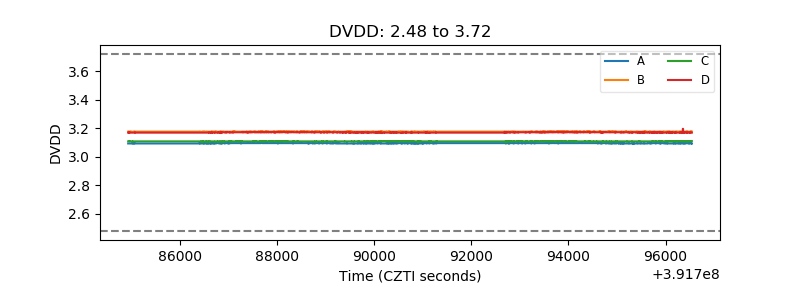 |
| Temperature 1 | 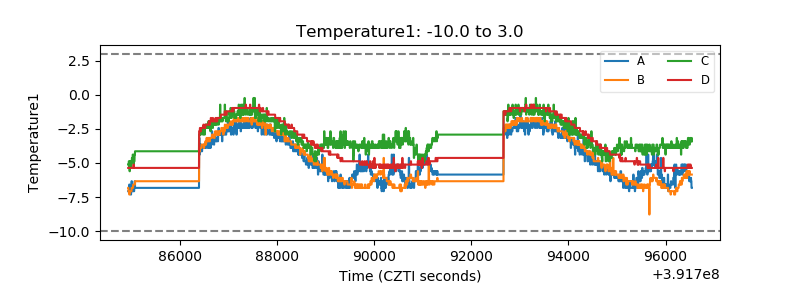 |
| Veto HV Monitor |  |
| Veto LLD | 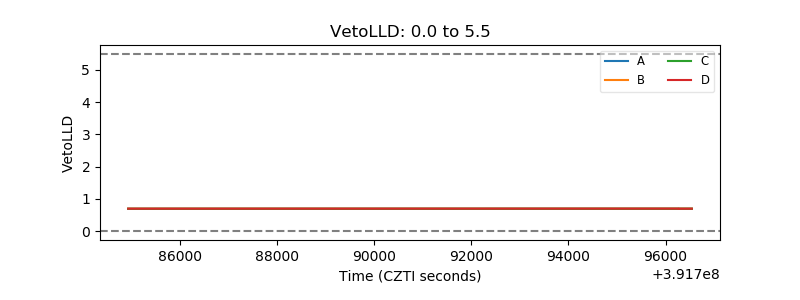 |
| Alpha Counter | 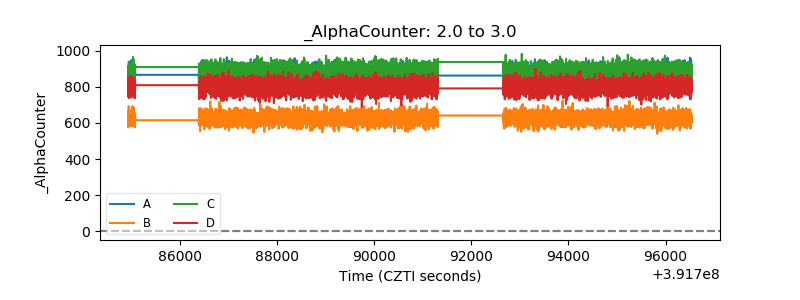 |
| _CPM_Rate | 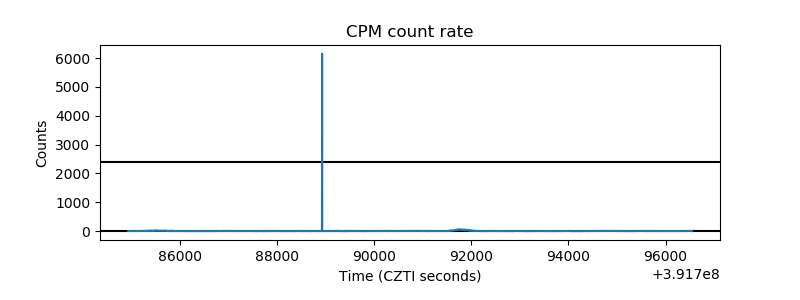 |
| CZT Counter | 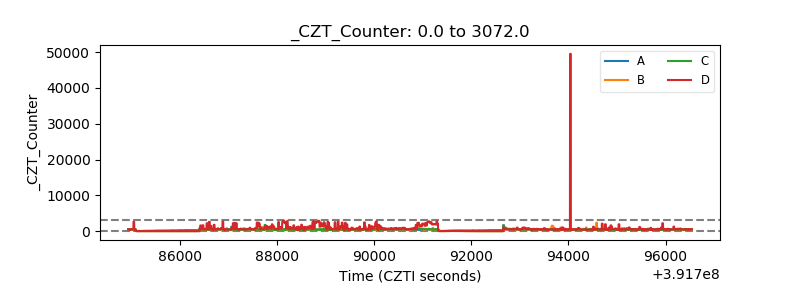 |
| +2.5 Volts monitor | 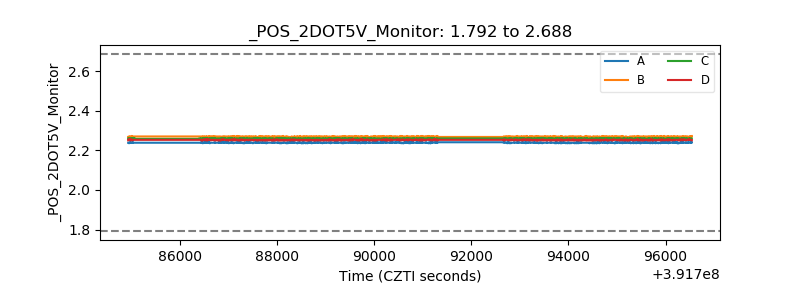 |
| +5 Volts monitor | 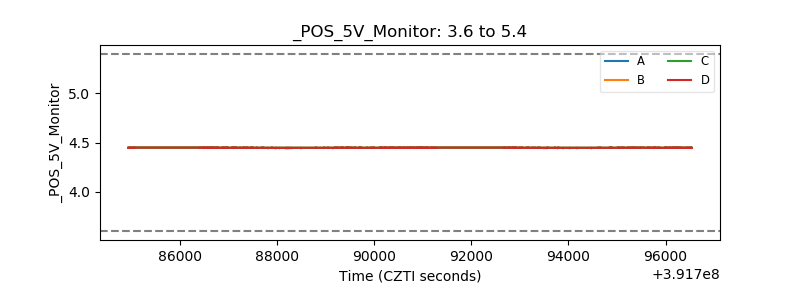 |
| _ROLL_ROT | 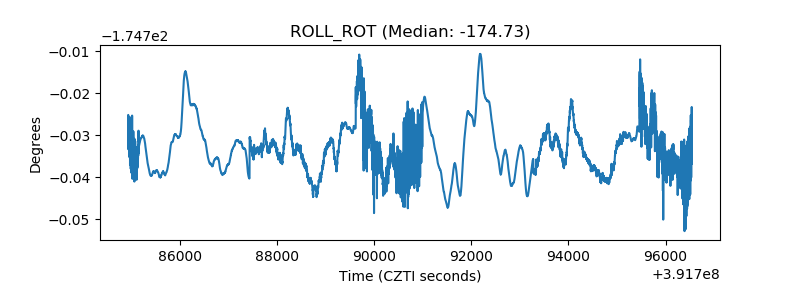 |
| _Roll_DEC | 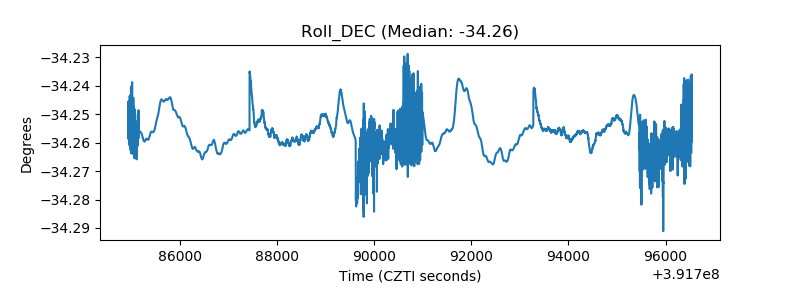 |
| _Roll_RA | 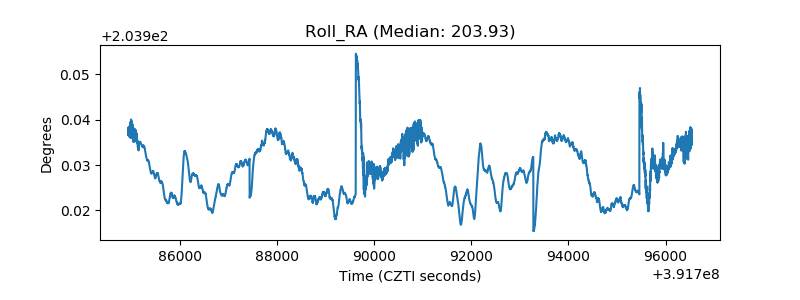 |
| Veto Counter | 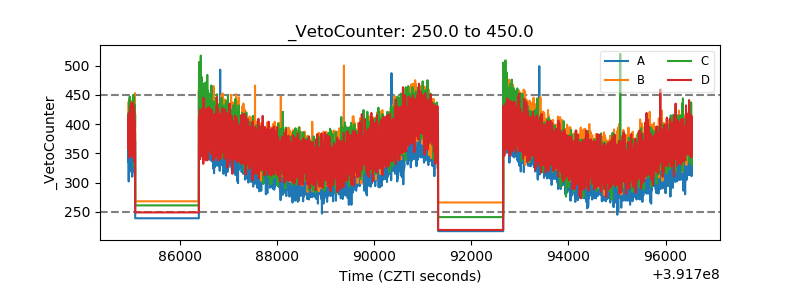 |