| Param | Original file | Final file |
|---|---|---|
| Filename | modeM0/AS1T04_069T01_9000005158_36092cztM0_level2.evt | modeM0/AS1T04_069T01_9000005158_36092cztM0_level2_quad_clean.evt |
| Size (bytes) | 503,447,040 | 82,713,600 |
| Size | 480.1 MB | 78.9 MB |
| Events in quadrant A | 2,859,750 | 538,788 |
| Events in quadrant B | 3,109,903 | 540,684 |
| Events in quadrant C | 3,184,673 | 530,891 |
| Events in quadrant D | 5,695,674 | 484,915 |
| Mode M0 | |||
|---|---|---|---|
| Quadrant | BADHDUFLAG | Total packets | Discarded packets |
| A | 0 | 12120 | 3 |
| B | 0 | 12856 | 2 |
| C | 0 | 13084 | 2 |
| D | 0 | 20905 | 2 |
| Mode M9 | |||
|---|---|---|---|
| Quadrant | BADHDUFLAG | Total packets | Discarded packets |
| A | 0 | 22 | 0 |
| B | 0 | 22 | 0 |
| C | 0 | 22 | 0 |
| D | 0 | 23 | 0 |
| Mode SS | |||
|---|---|---|---|
| Quadrant | BADHDUFLAG | Total packets | Discarded packets |
| A | 0 | 120 | 0 |
| B | 0 | 120 | 0 |
| C | 0 | 120 | 0 |
| D | 0 | 120 | 0 |
| Quadrant | Total seconds | Saturated seconds | Saturation percentage |
|---|---|---|---|
| A | 5854 | 19 | 0.324564% |
| B | 5854 | 61 | 1.042023% |
| C | 5854 | 44 | 0.751623% |
| D | 5854 | 370 | 6.320465% |
Noise dominated data is calculated using 1-second bins in cleaned event files. If a bin has >2000 counts, and if more than 50% of those come from <1% of pixels, then it is considered to be noise-dominated and hence unusable.
| Quadrant | # 1 sec bins | Bins with >0 counts | Bins with >2000 counts | High rate bins dominated by noise | Noise dominated (total time) | Noise dominated (detector-on time) | Marked lightcurve |
|---|---|---|---|---|---|---|---|
| A | 7197 | 5855 | 7 | 7 | 0.10% | 0.12% | 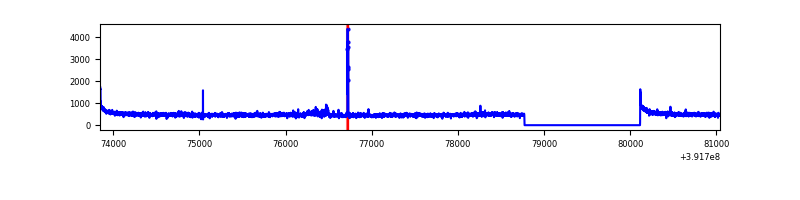 |
| B | 7197 | 5855 | 21 | 21 | 0.29% | 0.36% | 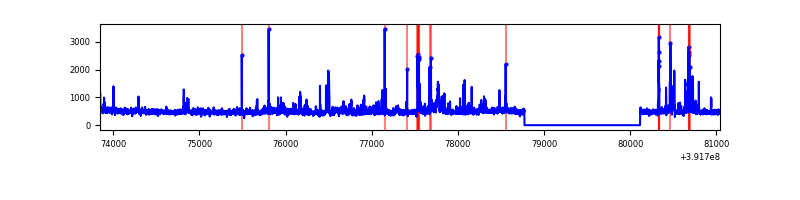 |
| C | 7197 | 5855 | 31 | 31 | 0.43% | 0.53% | 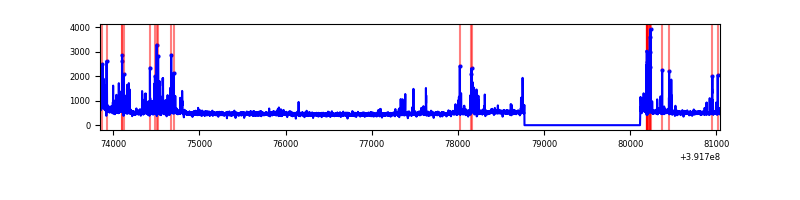 |
| D | 7197 | 5855 | 355 | 355 | 4.93% | 6.06% | 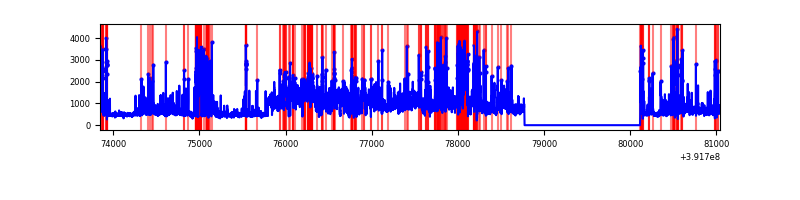 |
Top three noisy pixels from each quadrant. If the there are fewer than three noisy pixels in the level2.evt file, extra rows are filled as -1
| Pixel properties | Quadrant properties | ||||||
|---|---|---|---|---|---|---|---|
| Quadrant | DetID | PixID | Counts | Sigma | Mean | Median | Sigma |
| A | 10 | 83 | 182347 | 1329.05 | 673 | 660 | 136.7 |
| A | 8 | 144 | 30889 | 221.13 | 673 | 660 | 136.7 |
| A | 0 | 31 | 27701 | 197.81 | 673 | 660 | 136.7 |
| B | 5 | 172 | 289811 | 2241.6 | 666 | 647 | 129.0 |
| B | 0 | 213 | 50429 | 385.91 | 666 | 647 | 129.0 |
| B | 0 | 190 | 48775 | 373.09 | 666 | 647 | 129.0 |
| C | 0 | 207 | 263554 | 1725.62 | 647 | 651 | 152.4 |
| C | 15 | 214 | 251003 | 1643.24 | 647 | 651 | 152.4 |
| C | 0 | 10 | 115701 | 755.15 | 647 | 651 | 152.4 |
| D | 1 | 52 | 1967463 | 12584.75 | 633 | 613 | 156.3 |
| D | 12 | 17 | 443905 | 2836.37 | 633 | 613 | 156.3 |
| D | 12 | 6 | 286687 | 1830.42 | 633 | 613 | 156.3 |
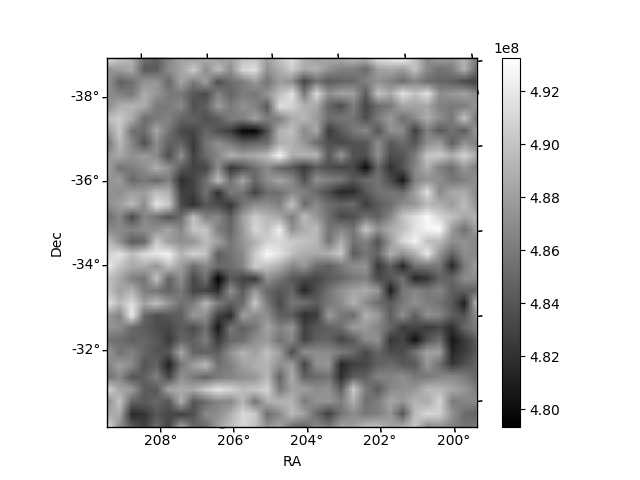
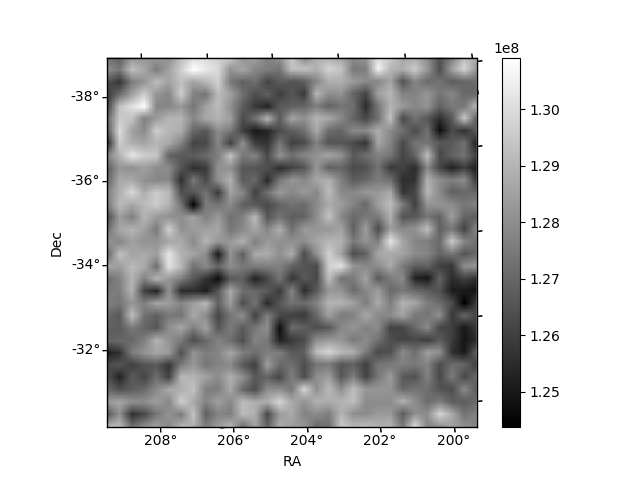
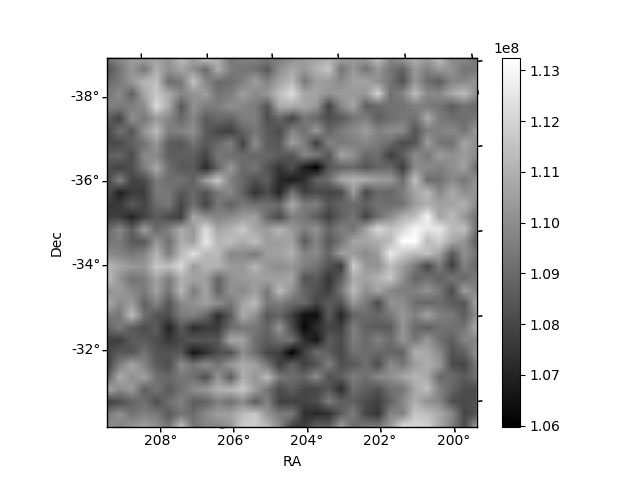
Histogram calculated using DETX and DETY for each event in the final _common_clean file
| Quadrant A | 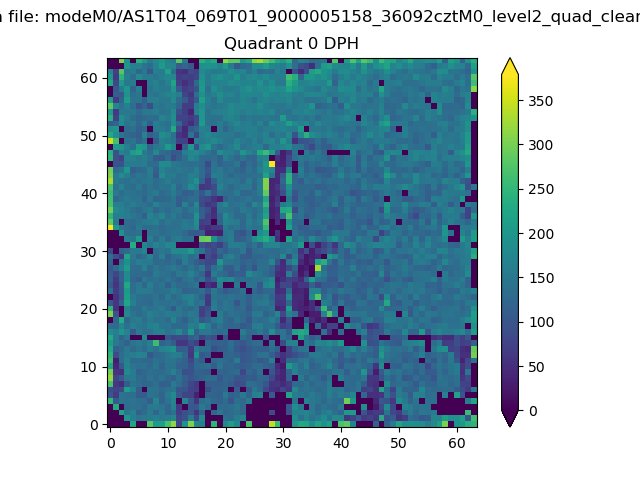 |
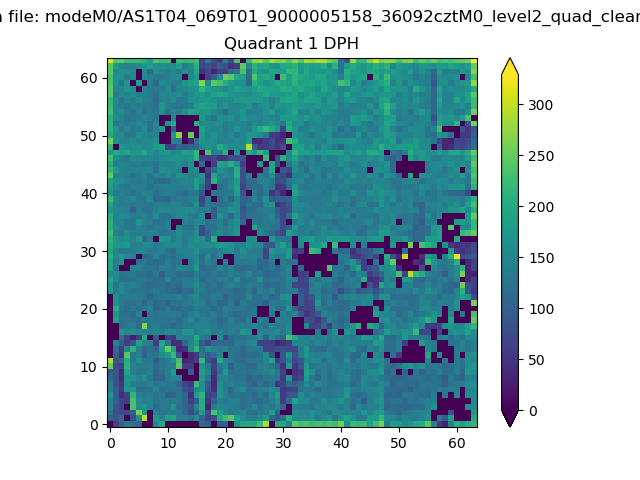 |
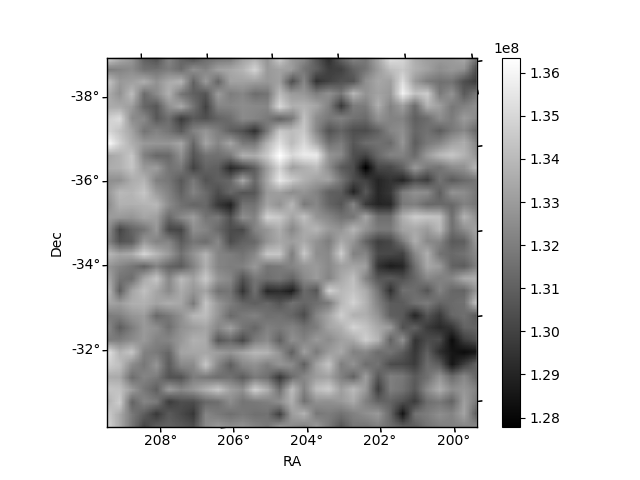
Quadrant B |
|---|---|---|---|
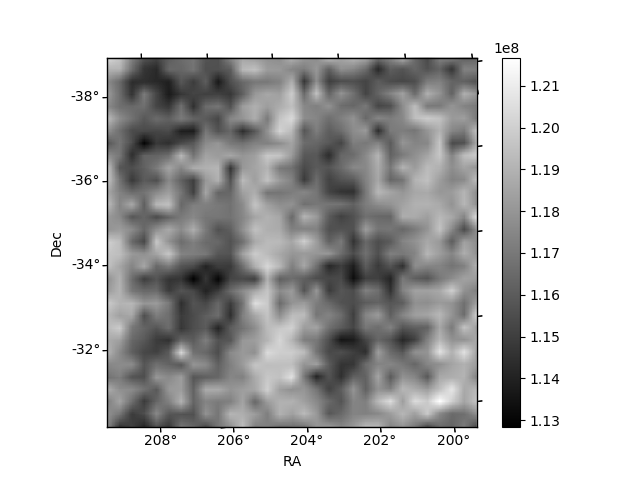
| Quadrant D | 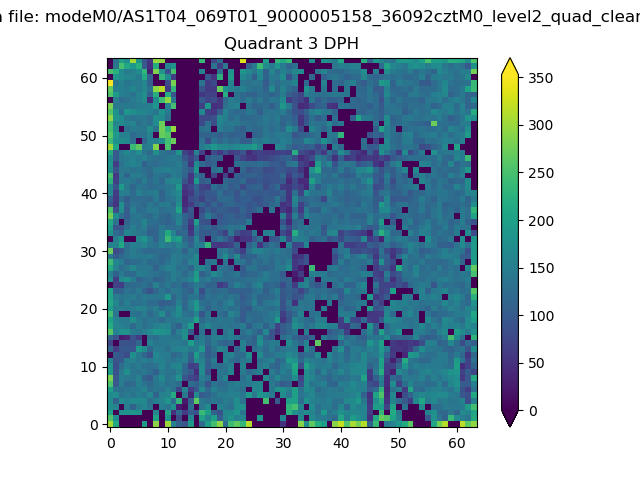 |
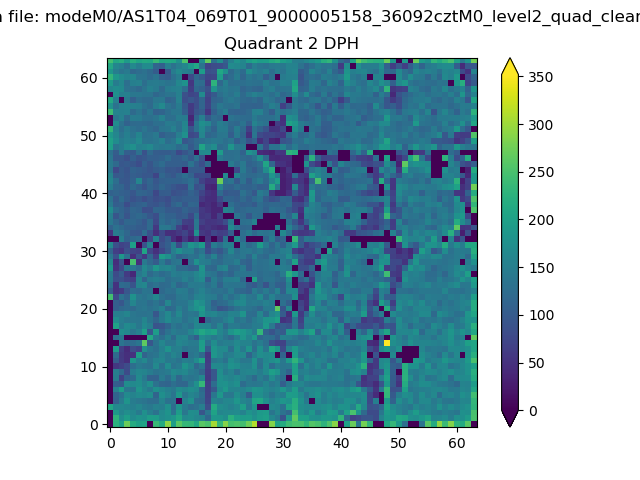 |
Quadrant C |
| Plot type | Count rate plots | Images |
|---|---|---|
| Comparison with Poisson distribution Blue bars denote a histogram of data divided into 1 sec bins. Red curve is a Poisson curve with rate = median count rate of data. |
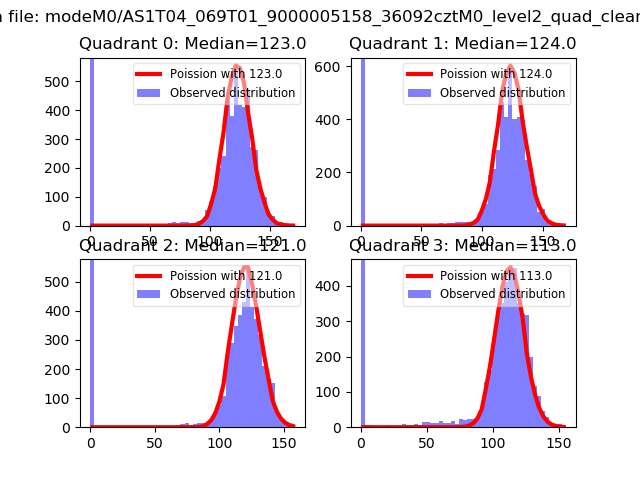 |
 |
| Quadrant-wise count rates Data is divided into 100 sec bins |
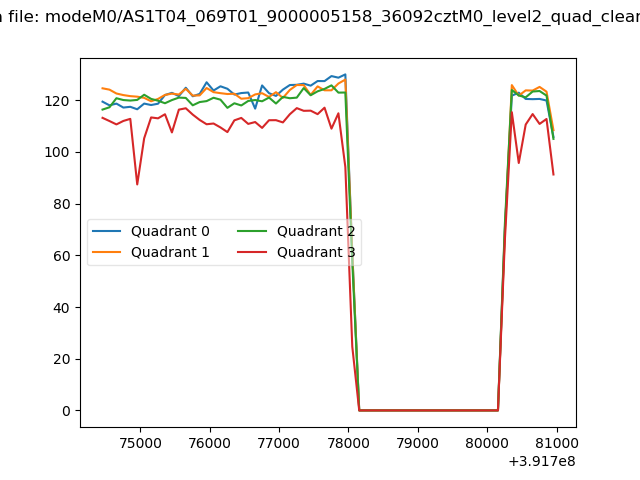 |
|
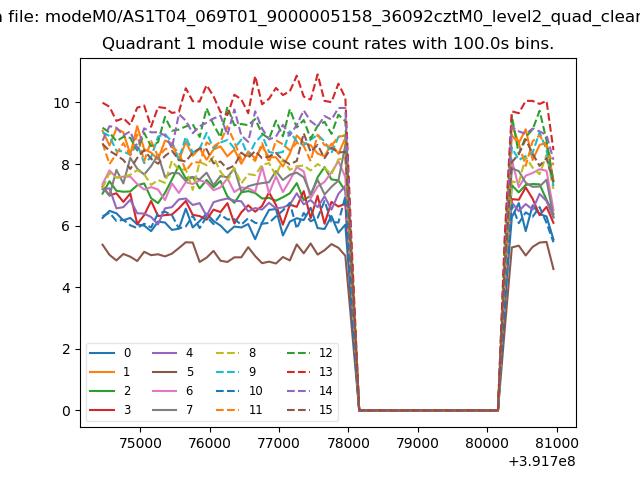
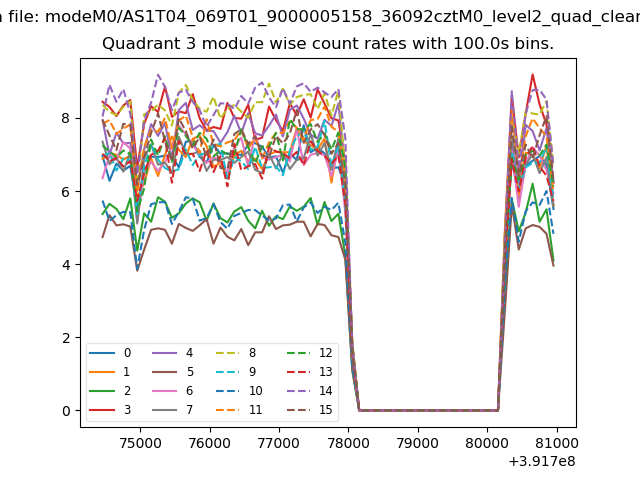
| Module-wise count rates for Quadrant A Data is divided into 100 sec bins |
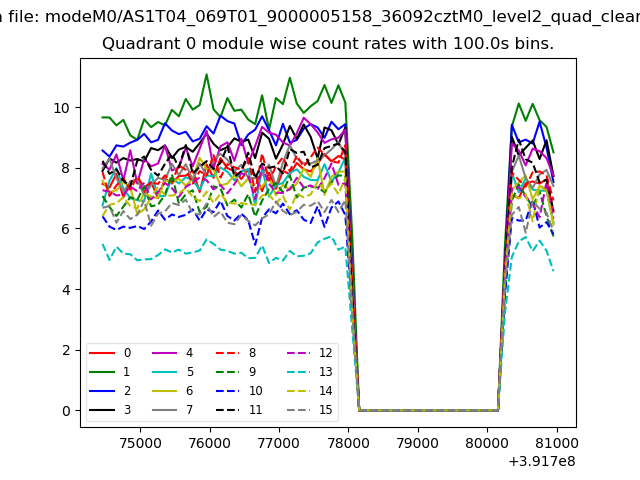 |
 |
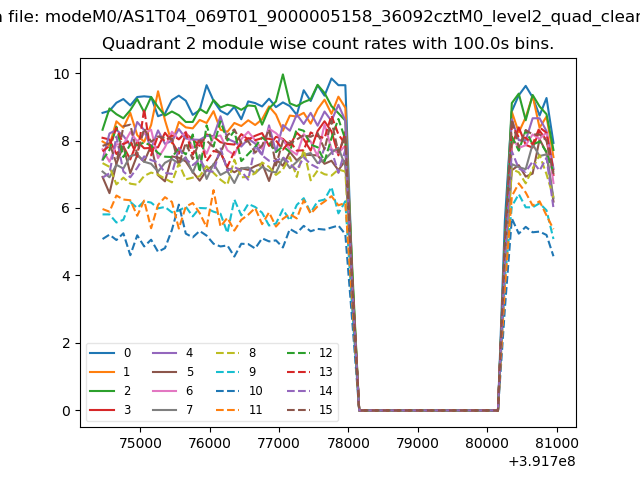
| Module-wise count rates for Quadrant B Data is divided into 100 sec bins |
 |
 |
| Module-wise count rates for Quadrant C Data is divided into 100 sec bins |
 |
 |
| Module-wise count rates for Quadrant D Data is divided into 100 sec bins |
 |
 |
| Parameter | Plot |
|---|---|
| CZT HV Monitor | 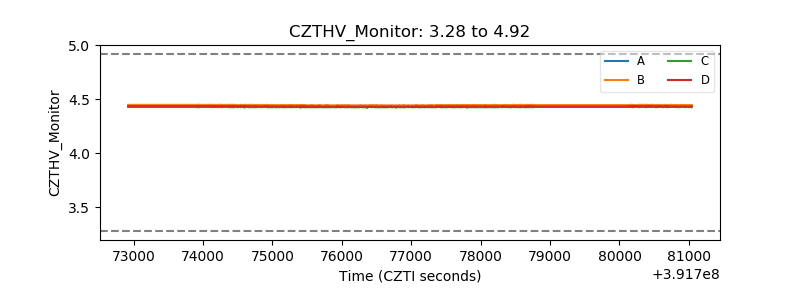 |
| D_VDD | 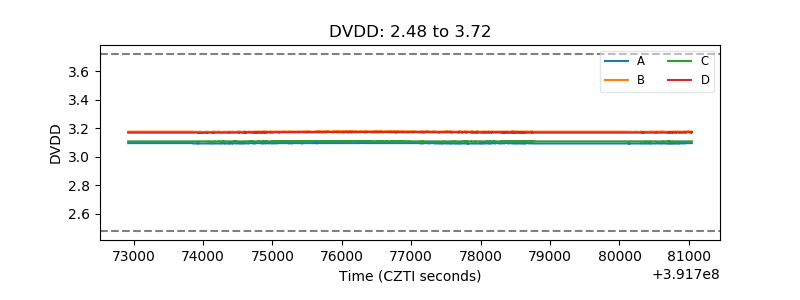 |
| Temperature 1 | 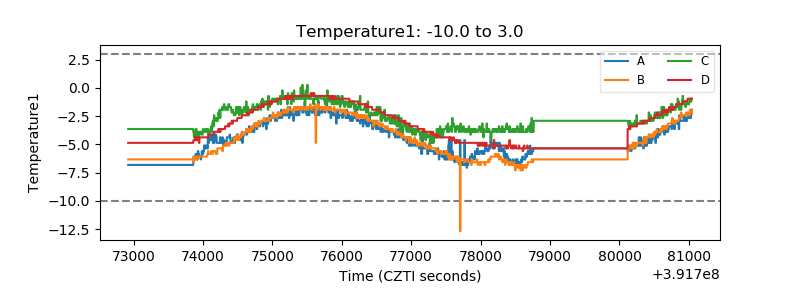 |
| Veto HV Monitor | 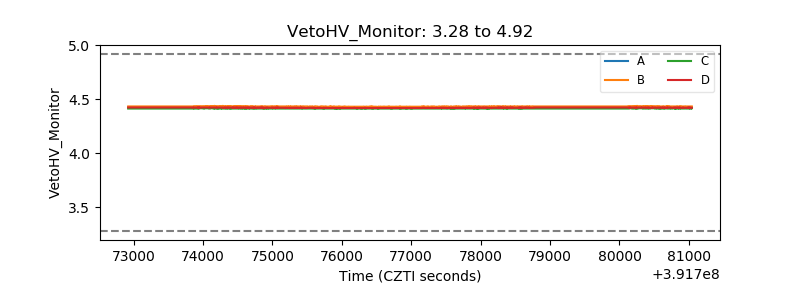 |
| Veto LLD | 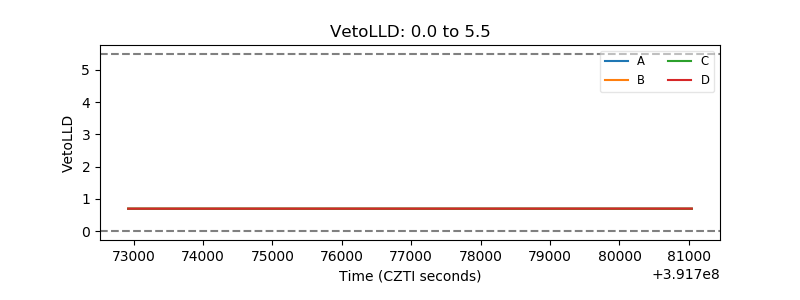 |
| Alpha Counter | 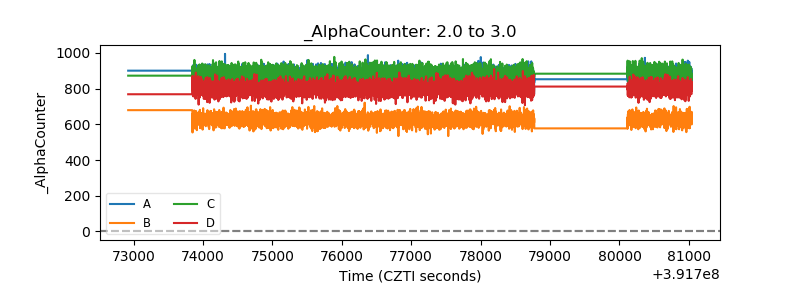 |
| _CPM_Rate | 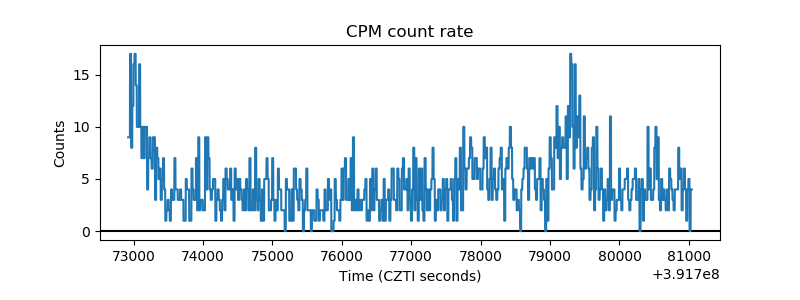 |
| CZT Counter | 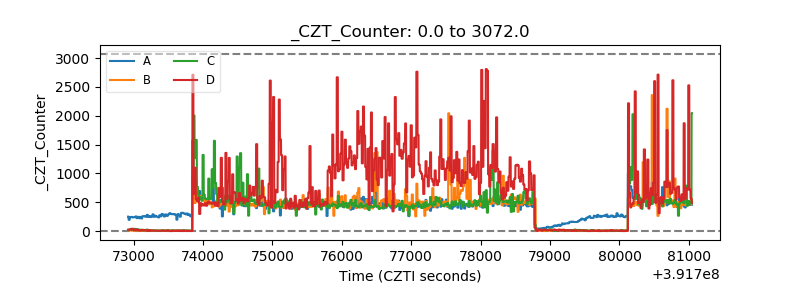 |
| +2.5 Volts monitor | 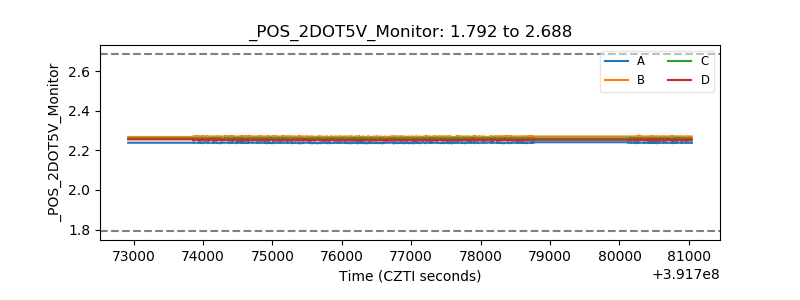 |
| +5 Volts monitor | 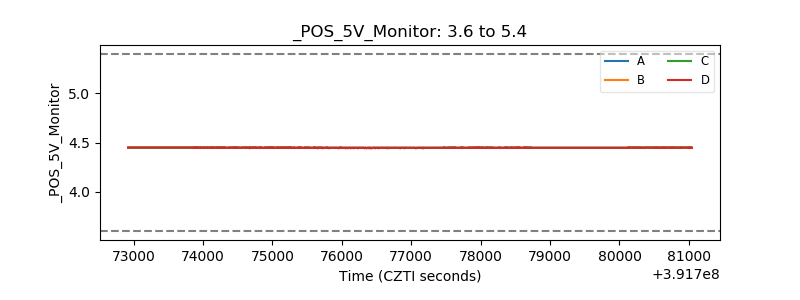 |
| _ROLL_ROT | 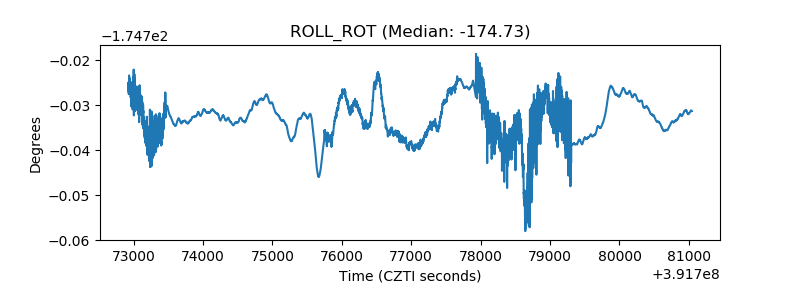 |
| _Roll_DEC | 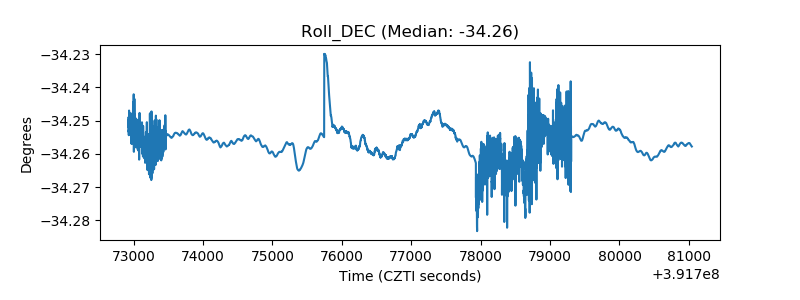 |
| _Roll_RA | 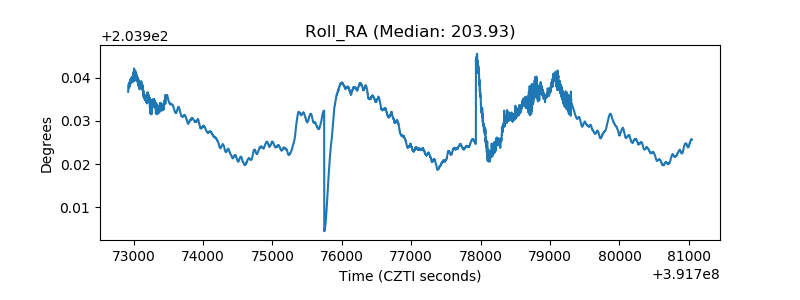 |
| Veto Counter | 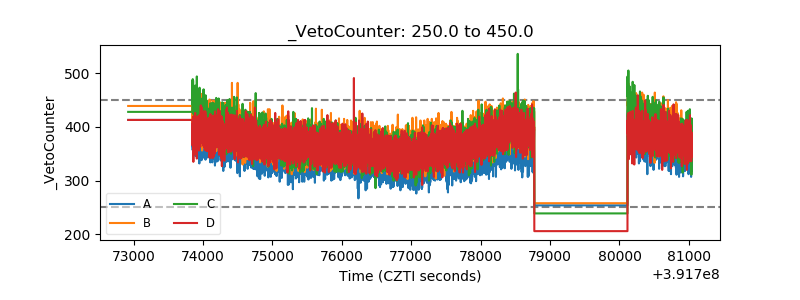 |