| Param | Original file | Final file |
|---|---|---|
| Filename | modeM0/AS1T04_069T01_9000005158_36091cztM0_level2.evt | modeM0/AS1T04_069T01_9000005158_36091cztM0_level2_quad_clean.evt |
| Size (bytes) | 467,000,640 | 76,078,080 |
| Size | 445.4 MB | 72.6 MB |
| Events in quadrant A | 2,702,051 | 491,422 |
| Events in quadrant B | 2,797,399 | 494,874 |
| Events in quadrant C | 3,204,564 | 480,259 |
| Events in quadrant D | 5,059,086 | 445,300 |
| Mode M0 | |||
|---|---|---|---|
| Quadrant | BADHDUFLAG | Total packets | Discarded packets |
| A | 0 | 11525 | 3 |
| B | 0 | 11743 | 2 |
| C | 0 | 12937 | 2 |
| D | 0 | 18893 | 2 |
| Mode M9 | |||
|---|---|---|---|
| Quadrant | BADHDUFLAG | Total packets | Discarded packets |
| A | 0 | 32 | 0 |
| B | 0 | 32 | 0 |
| C | 0 | 32 | 0 |
| D | 0 | 33 | 0 |
| Mode SS | |||
|---|---|---|---|
| Quadrant | BADHDUFLAG | Total packets | Discarded packets |
| A | 0 | 114 | 0 |
| B | 0 | 114 | 0 |
| C | 0 | 114 | 0 |
| D | 0 | 114 | 0 |
| Quadrant | Total seconds | Saturated seconds | Saturation percentage |
|---|---|---|---|
| A | 5602 | 9 | 0.160657% |
| B | 5602 | 25 | 0.446269% |
| C | 5602 | 80 | 1.428061% |
| D | 5602 | 321 | 5.730096% |
Noise dominated data is calculated using 1-second bins in cleaned event files. If a bin has >2000 counts, and if more than 50% of those come from <1% of pixels, then it is considered to be noise-dominated and hence unusable.
| Quadrant | # 1 sec bins | Bins with >0 counts | Bins with >2000 counts | High rate bins dominated by noise | Noise dominated (total time) | Noise dominated (detector-on time) | Marked lightcurve |
|---|---|---|---|---|---|---|---|
| A | 7155 | 5603 | 2 | 2 | 0.03% | 0.04% |  |
| B | 7155 | 5603 | 12 | 12 | 0.17% | 0.21% | 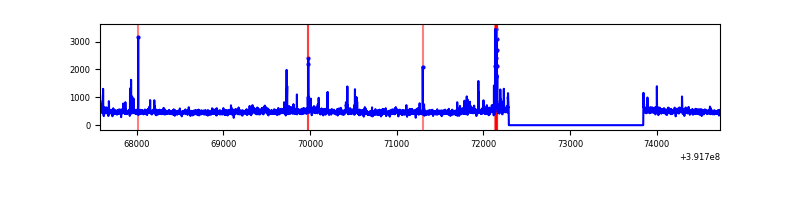 |
| C | 7155 | 5603 | 60 | 60 | 0.84% | 1.07% | 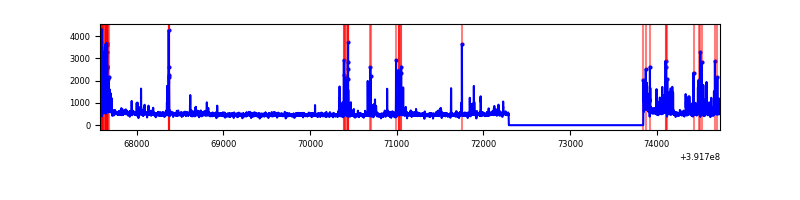 |
| D | 7155 | 5603 | 330 | 330 | 4.61% | 5.89% | 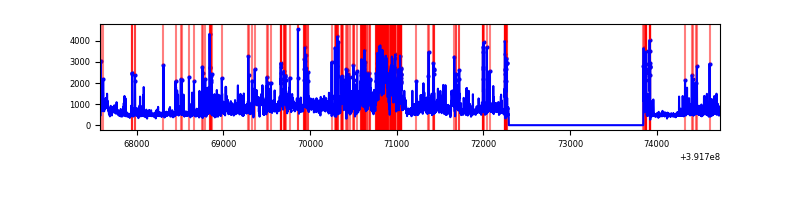 |
Top three noisy pixels from each quadrant. If the there are fewer than three noisy pixels in the level2.evt file, extra rows are filled as -1
| Pixel properties | Quadrant properties | ||||||
|---|---|---|---|---|---|---|---|
| Quadrant | DetID | PixID | Counts | Sigma | Mean | Median | Sigma |
| A | 10 | 83 | 180324 | 1377.23 | 644 | 632 | 130.5 |
| A | 9 | 143 | 14936 | 109.63 | 644 | 632 | 130.5 |
| A | 13 | 6 | 14740 | 108.13 | 644 | 632 | 130.5 |
| B | 5 | 172 | 111026 | 885.27 | 639 | 623 | 124.7 |
| B | 0 | 190 | 60381 | 479.17 | 639 | 623 | 124.7 |
| B | 0 | 213 | 31070 | 244.14 | 639 | 623 | 124.7 |
| C | 15 | 214 | 236581 | 1619.34 | 619 | 623 | 145.7 |
| C | 0 | 207 | 236367 | 1617.87 | 619 | 623 | 145.7 |
| C | 0 | 10 | 174723 | 1194.82 | 619 | 623 | 145.7 |
| D | 1 | 52 | 1063131 | 7088.94 | 611 | 594 | 149.9 |
| D | 12 | 227 | 692786 | 4618.1 | 611 | 594 | 149.9 |
| D | 12 | 6 | 298040 | 1984.47 | 611 | 594 | 149.9 |
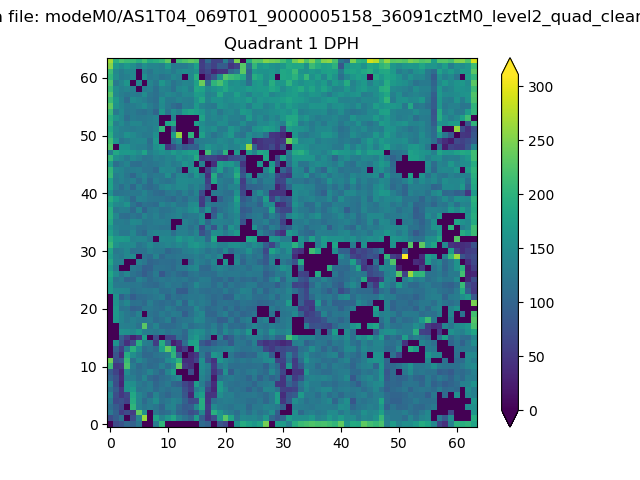
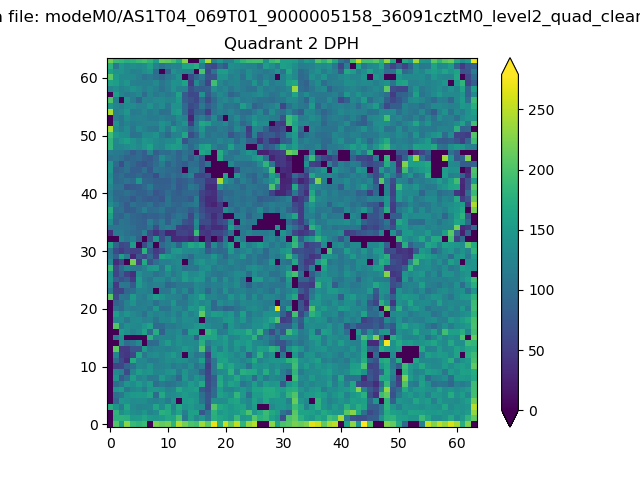
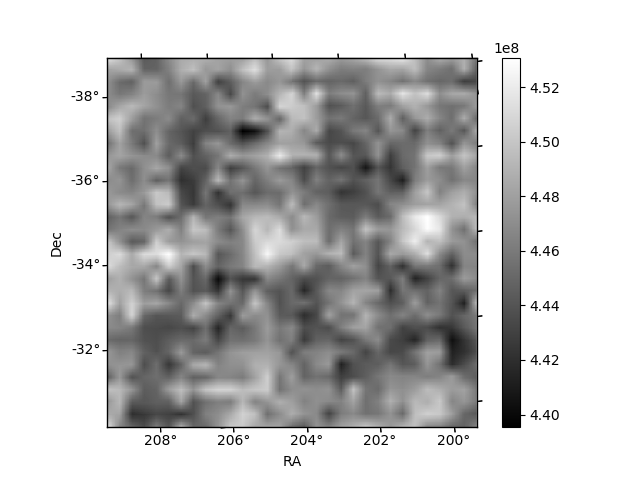
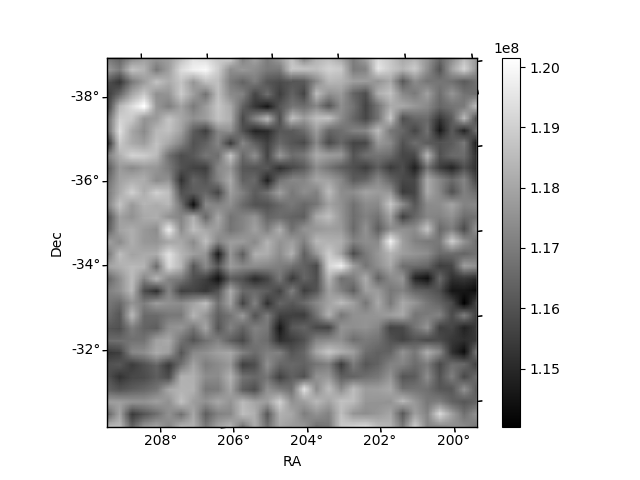
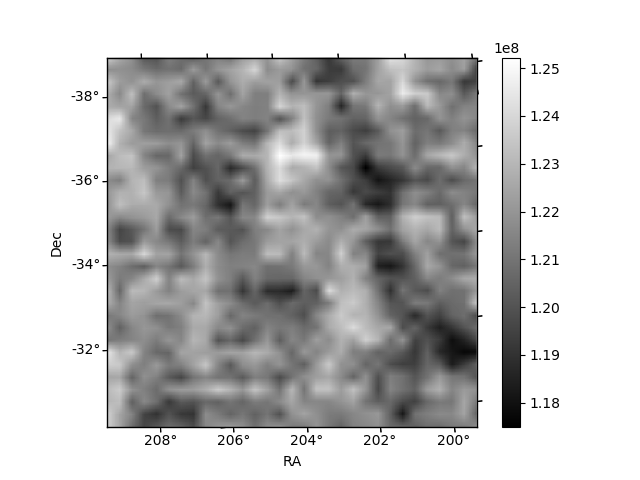
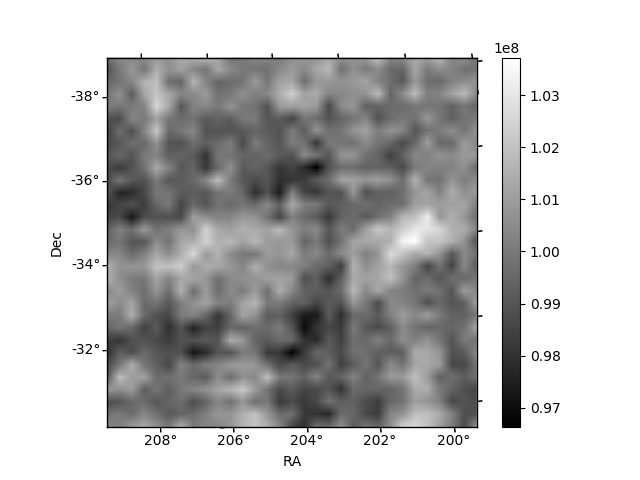
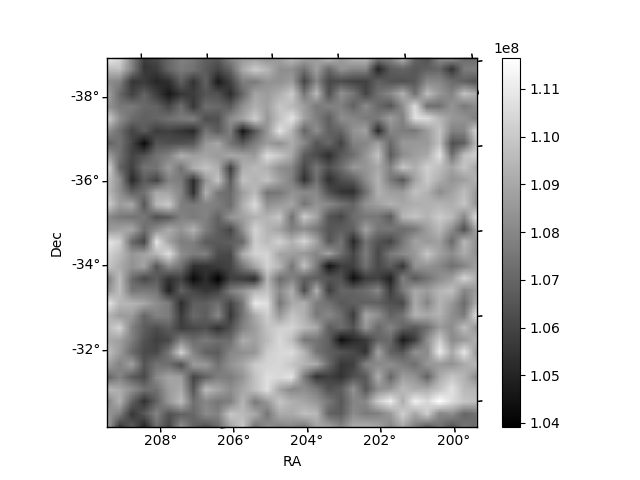
Histogram calculated using DETX and DETY for each event in the final _common_clean file
| Quadrant A | 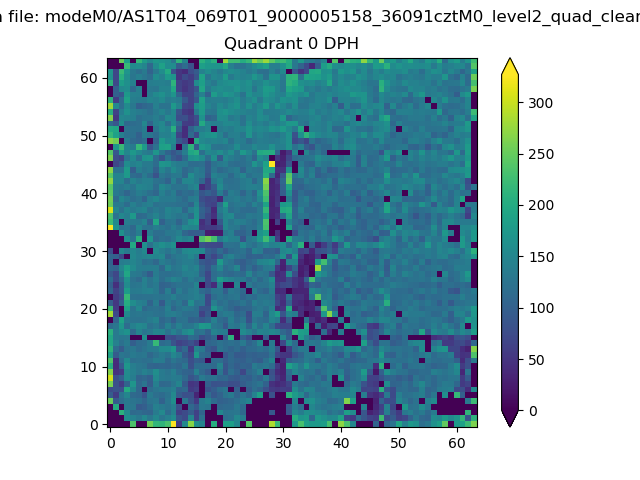 |
 |
Quadrant B |
|---|---|---|---|
| Quadrant D | 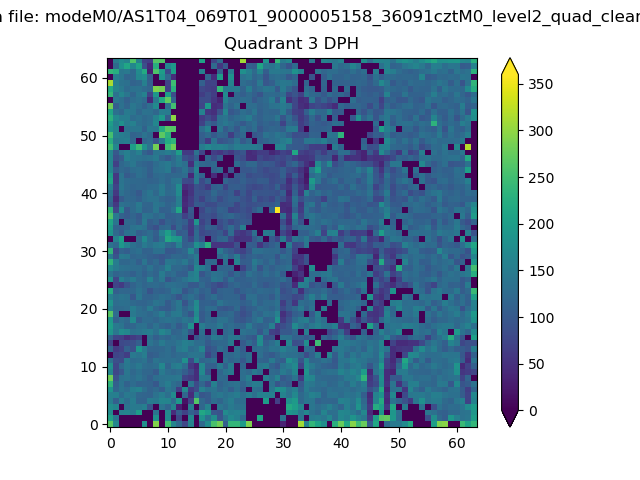 |
 |
Quadrant C |
| Plot type | Count rate plots | Images |
|---|---|---|
| Comparison with Poisson distribution Blue bars denote a histogram of data divided into 1 sec bins. Red curve is a Poisson curve with rate = median count rate of data. |
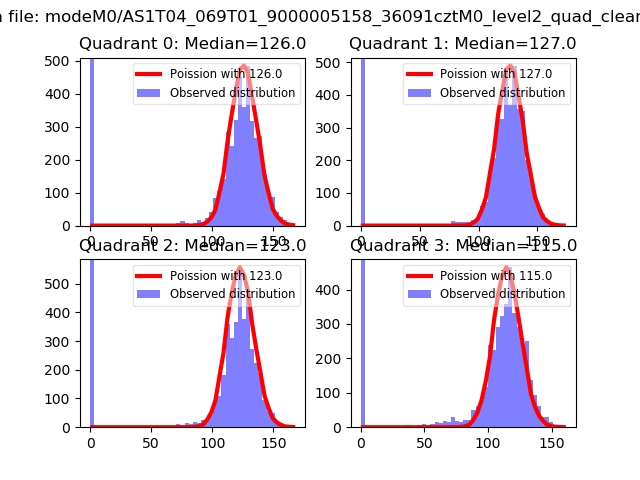 |
 |
| Quadrant-wise count rates Data is divided into 100 sec bins |
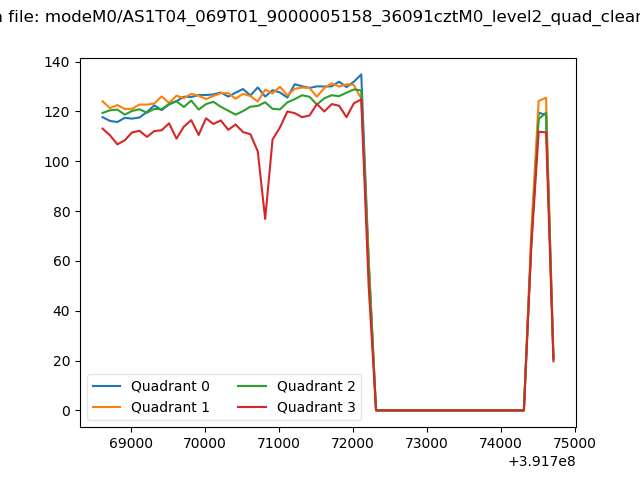 |
|
| Module-wise count rates for Quadrant A Data is divided into 100 sec bins |
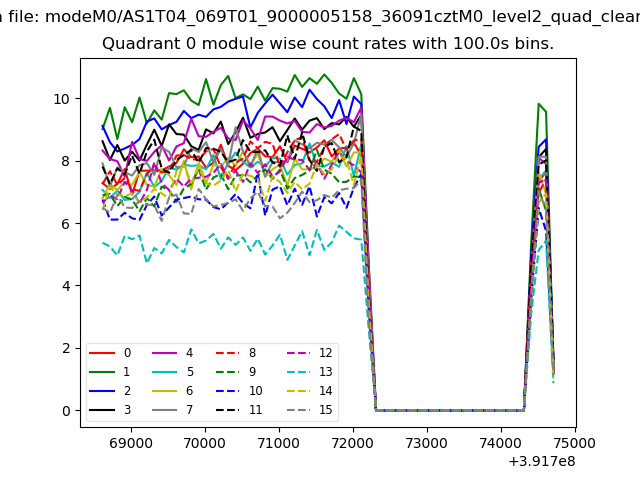 |
 |
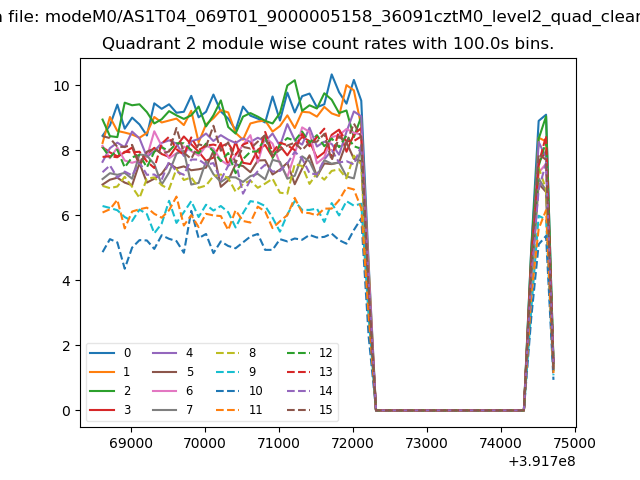
| Module-wise count rates for Quadrant B Data is divided into 100 sec bins |
 |
 |
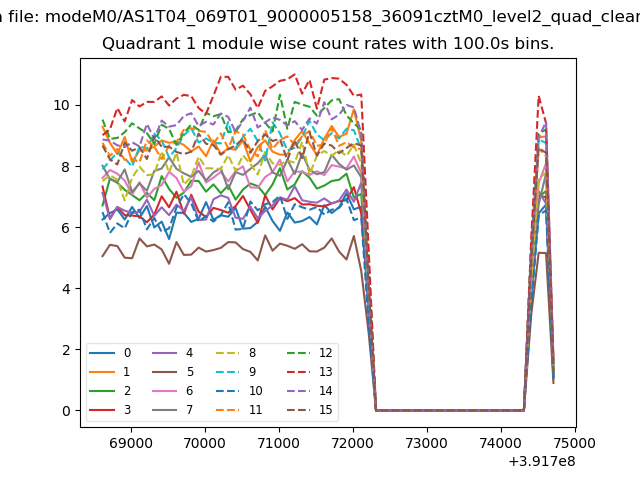
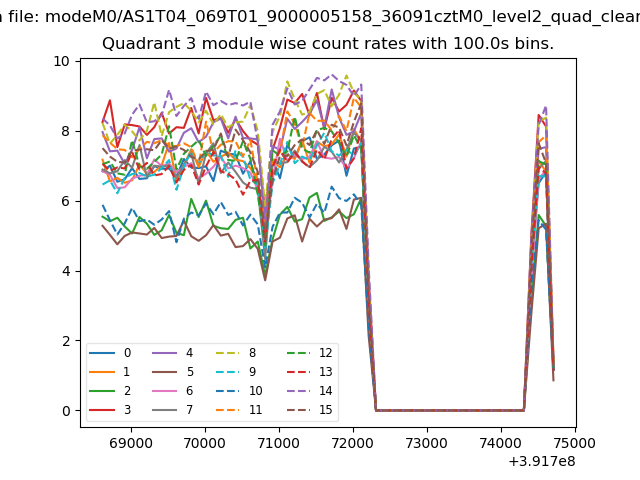
| Module-wise count rates for Quadrant C Data is divided into 100 sec bins |
 |
 |
| Module-wise count rates for Quadrant D Data is divided into 100 sec bins |
 |
 |
| Parameter | Plot |
|---|---|
| CZT HV Monitor | 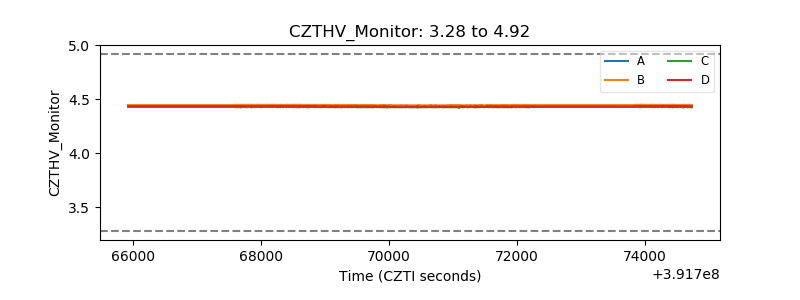 |
| D_VDD | 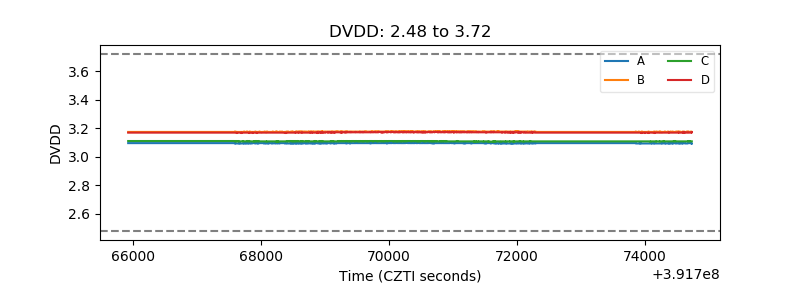 |
| Temperature 1 | 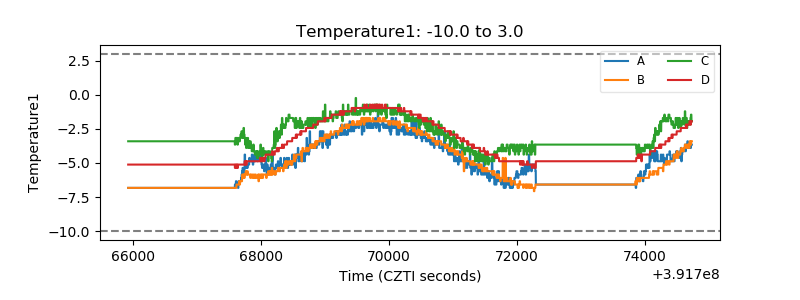 |
| Veto HV Monitor | 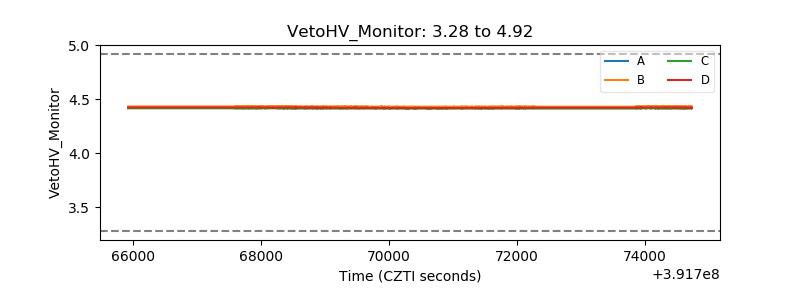 |
| Veto LLD | 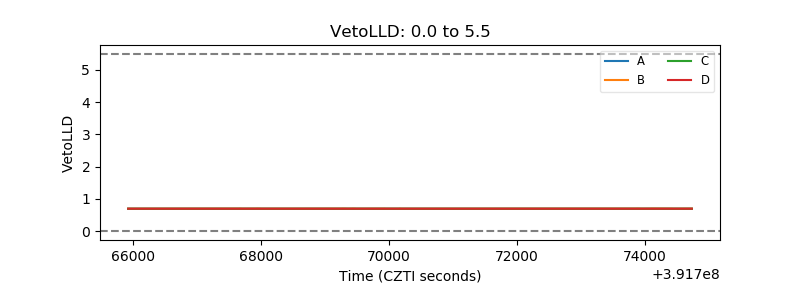 |
| Alpha Counter | 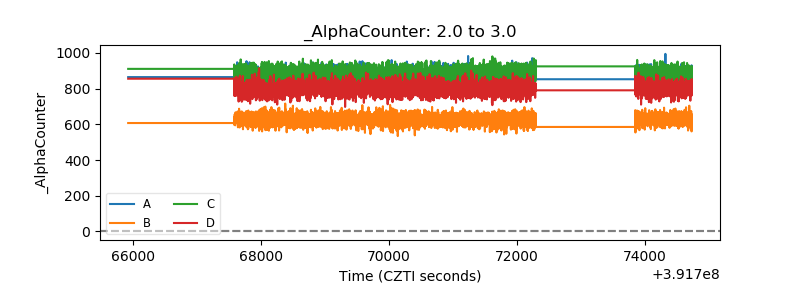 |
| _CPM_Rate | 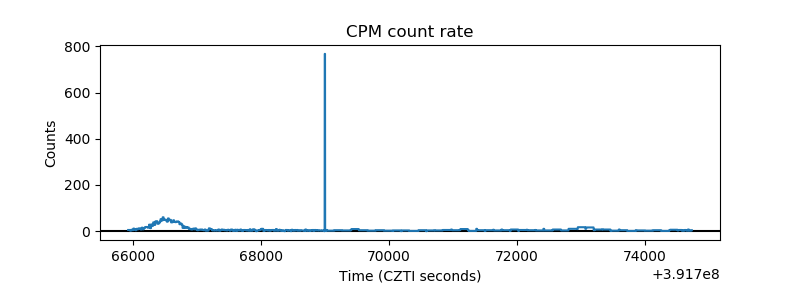 |
| CZT Counter | 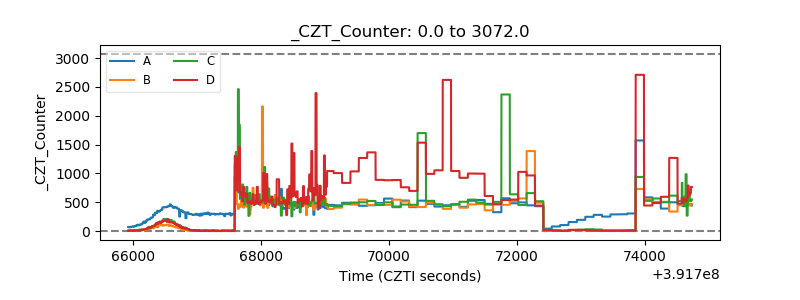 |
| +2.5 Volts monitor | 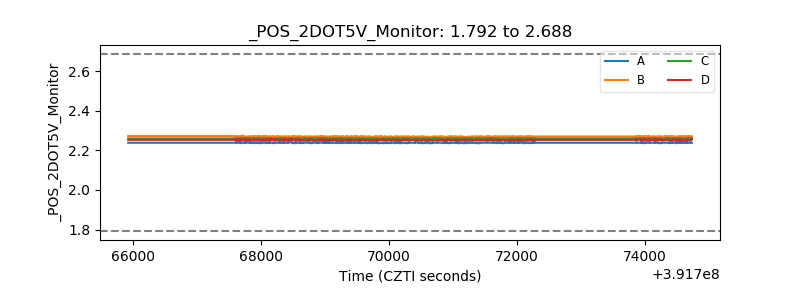 |
| +5 Volts monitor | 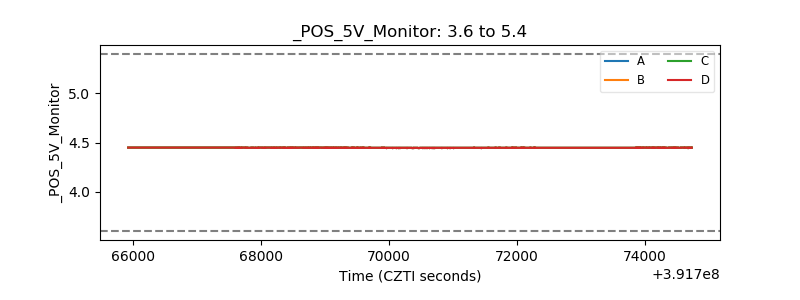 |
| _ROLL_ROT | 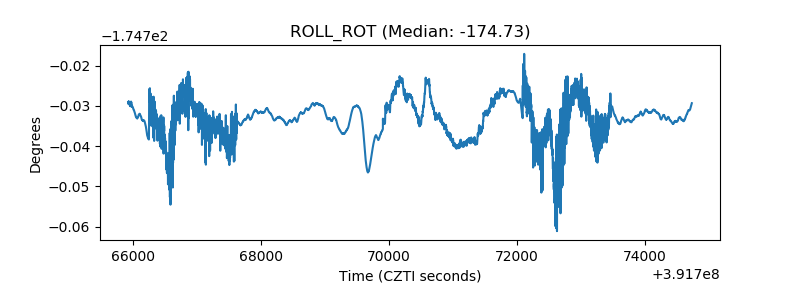 |
| _Roll_DEC | 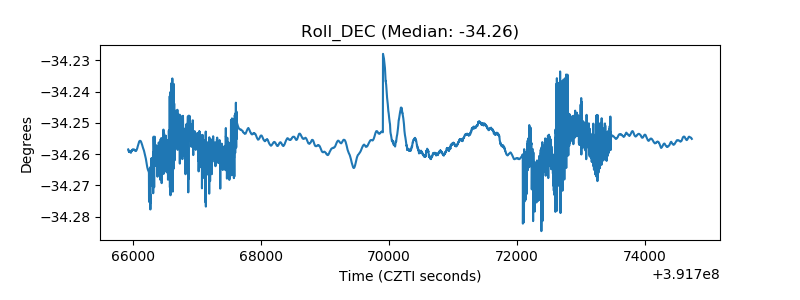 |
| _Roll_RA | 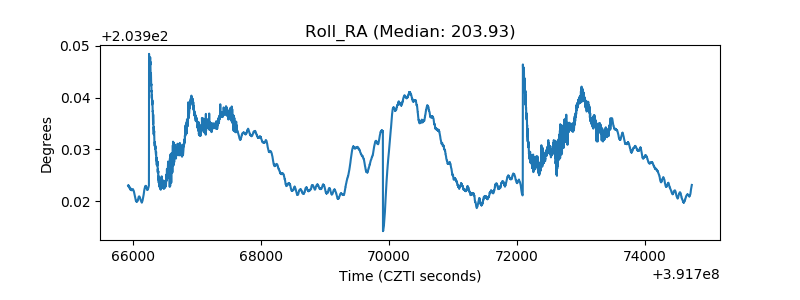 |
| Veto Counter | 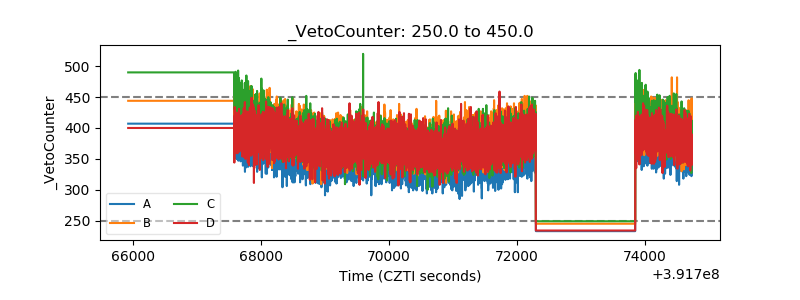 |