| Param | Original file | Final file |
|---|---|---|
| Filename | modeM0/AS1T04_069T01_9000005158_36090cztM0_level2.evt | modeM0/AS1T04_069T01_9000005158_36090cztM0_level2_quad_clean.evt |
| Size (bytes) | 478,296,000 | 65,508,480 |
| Size | 456.1 MB | 62.5 MB |
| Events in quadrant A | 2,622,599 | 419,508 |
| Events in quadrant B | 2,842,068 | 420,344 |
| Events in quadrant C | 3,155,599 | 410,339 |
| Events in quadrant D | 5,499,804 | 356,282 |
| Mode M0 | |||
|---|---|---|---|
| Quadrant | BADHDUFLAG | Total packets | Discarded packets |
| A | 0 | 11043 | 3 |
| B | 0 | 11724 | 2 |
| C | 0 | 12614 | 2 |
| D | 0 | 19968 | 2 |
| Mode M9 | |||
|---|---|---|---|
| Quadrant | BADHDUFLAG | Total packets | Discarded packets |
| A | 0 | 40 | 0 |
| B | 0 | 40 | 0 |
| C | 0 | 40 | 0 |
| D | 0 | 40 | 0 |
| Mode SS | |||
|---|---|---|---|
| Quadrant | BADHDUFLAG | Total packets | Discarded packets |
| A | 0 | 112 | 0 |
| B | 0 | 112 | 0 |
| C | 0 | 112 | 0 |
| D | 0 | 112 | 0 |
| Quadrant | Total seconds | Saturated seconds | Saturation percentage |
|---|---|---|---|
| A | 5380 | 6 | 0.111524% |
| B | 5380 | 50 | 0.929368% |
| C | 5380 | 100 | 1.858736% |
| D | 5380 | 709 | 13.178439% |
Noise dominated data is calculated using 1-second bins in cleaned event files. If a bin has >2000 counts, and if more than 50% of those come from <1% of pixels, then it is considered to be noise-dominated and hence unusable.
| Quadrant | # 1 sec bins | Bins with >0 counts | Bins with >2000 counts | High rate bins dominated by noise | Noise dominated (total time) | Noise dominated (detector-on time) | Marked lightcurve |
|---|---|---|---|---|---|---|---|
| A | 9357 | 5382 | 0 | 0 | 0.00% | 0.00% | 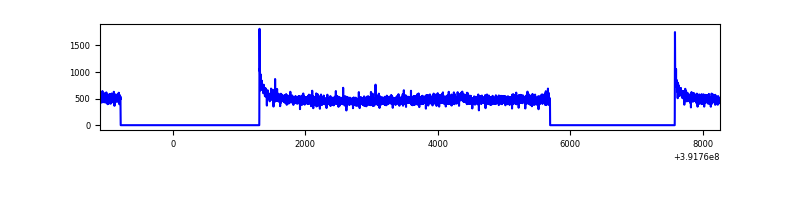 |
| B | 9357 | 5382 | 23 | 23 | 0.25% | 0.43% | 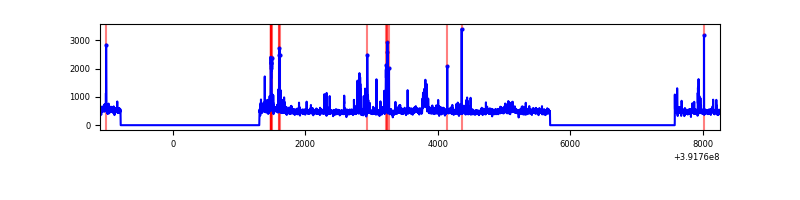 |
| C | 9357 | 5382 | 80 | 80 | 0.85% | 1.49% | 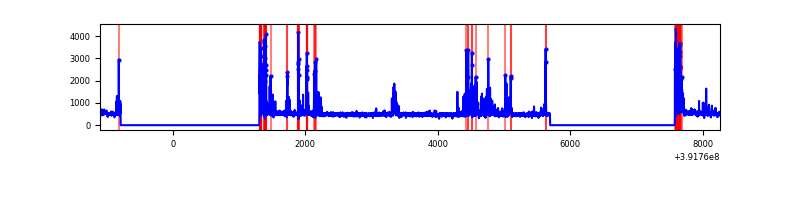 |
| D | 9357 | 5382 | 745 | 745 | 7.96% | 13.84% | 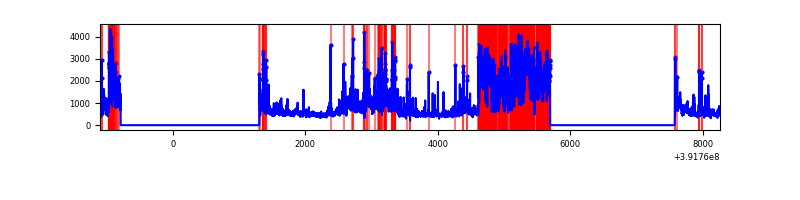 |
Top three noisy pixels from each quadrant. If the there are fewer than three noisy pixels in the level2.evt file, extra rows are filled as -1
| Pixel properties | Quadrant properties | ||||||
|---|---|---|---|---|---|---|---|
| Quadrant | DetID | PixID | Counts | Sigma | Mean | Median | Sigma |
| A | 10 | 83 | 178393 | 1397.03 | 628 | 615 | 127.3 |
| A | 15 | 223 | 9921 | 73.13 | 628 | 615 | 127.3 |
| A | 13 | 6 | 7560 | 54.58 | 628 | 615 | 127.3 |
| B | 5 | 172 | 166165 | 1369.45 | 623 | 608 | 120.9 |
| B | 0 | 213 | 57637 | 471.73 | 623 | 608 | 120.9 |
| B | 0 | 229 | 56440 | 461.83 | 623 | 608 | 120.9 |
| C | 0 | 207 | 313872 | 2229.47 | 603 | 607 | 140.5 |
| C | 0 | 10 | 239982 | 1703.6 | 603 | 607 | 140.5 |
| C | 15 | 214 | 226324 | 1606.4 | 603 | 607 | 140.5 |
| D | 12 | 227 | 2026291 | 14047.87 | 584 | 568 | 144.2 |
| D | 1 | 52 | 612881 | 4246.23 | 584 | 568 | 144.2 |
| D | 12 | 6 | 201392 | 1392.66 | 584 | 568 | 144.2 |
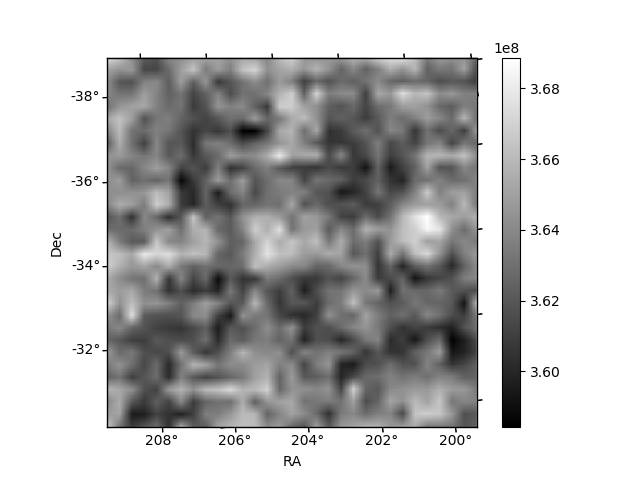
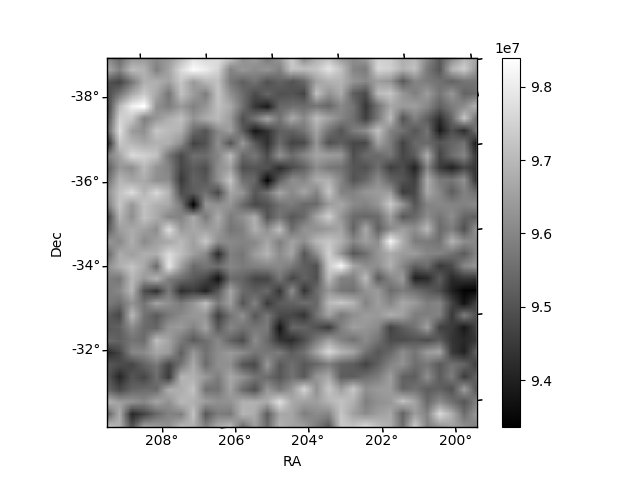
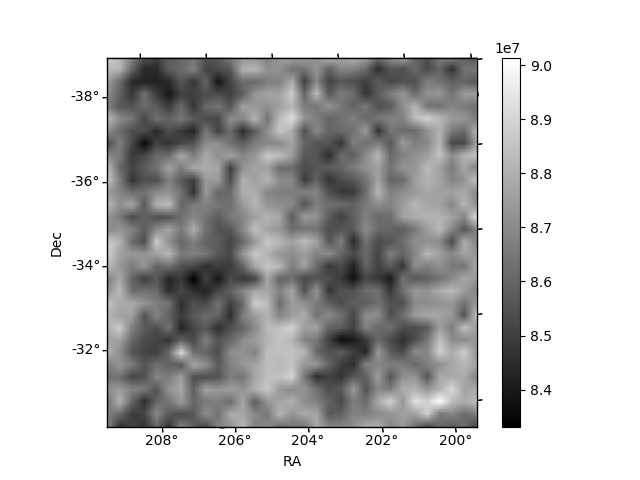
Histogram calculated using DETX and DETY for each event in the final _common_clean file
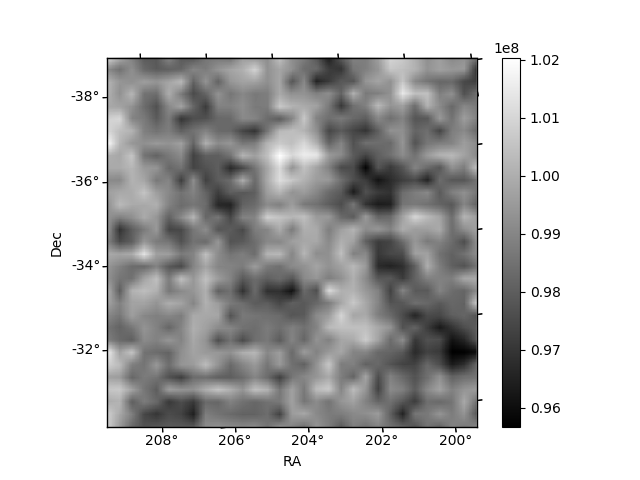
| Quadrant A | 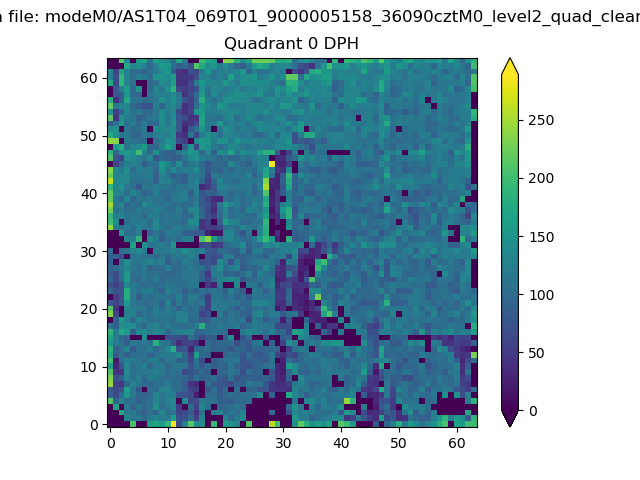 |
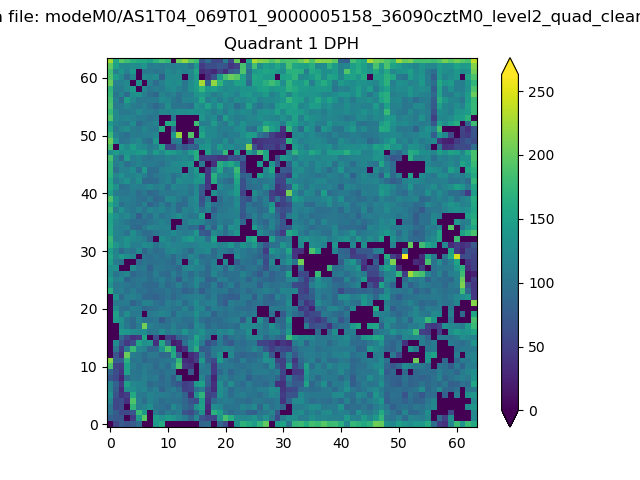 |
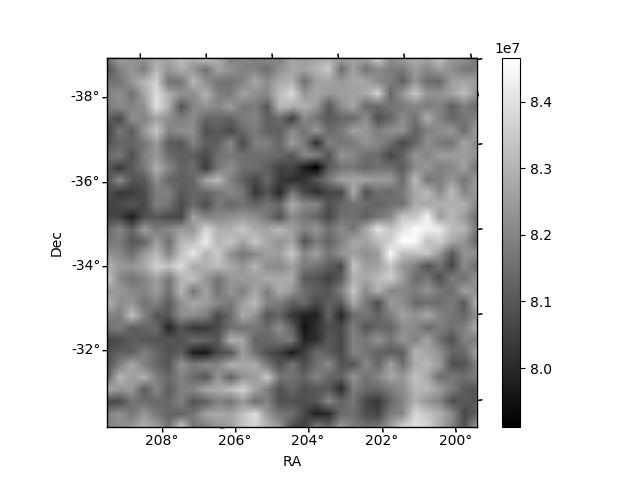
Quadrant B |
|---|---|---|---|
| Quadrant D |  |
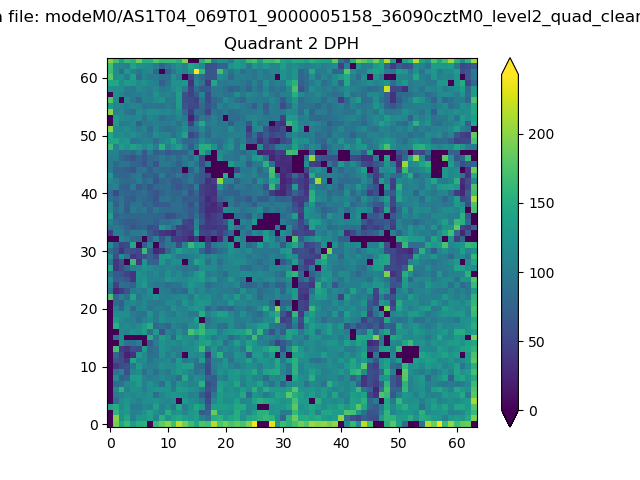 |
Quadrant C |
| Plot type | Count rate plots | Images |
|---|---|---|
| Comparison with Poisson distribution Blue bars denote a histogram of data divided into 1 sec bins. Red curve is a Poisson curve with rate = median count rate of data. |
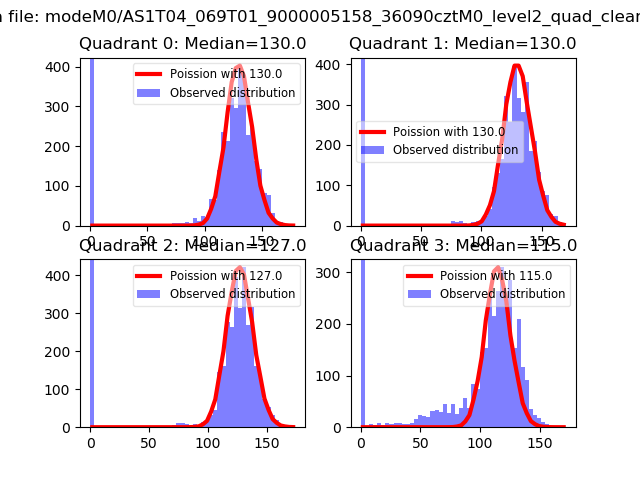 |
 |
| Quadrant-wise count rates Data is divided into 100 sec bins |
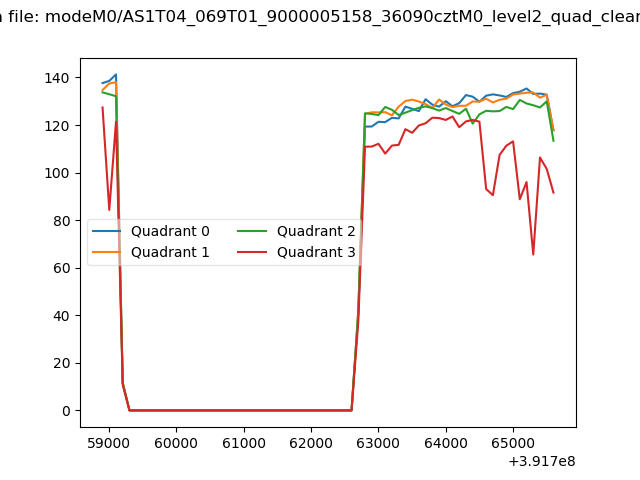 |
|
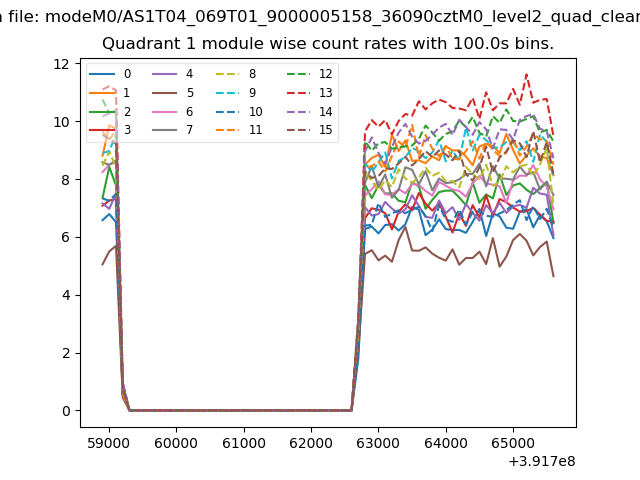
| Module-wise count rates for Quadrant A Data is divided into 100 sec bins |
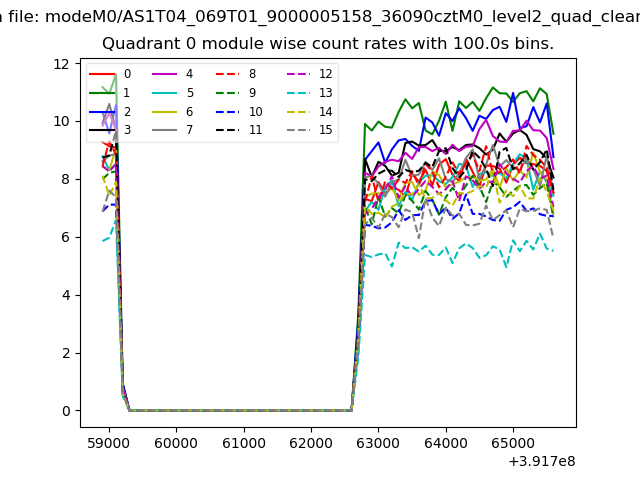 |
 |
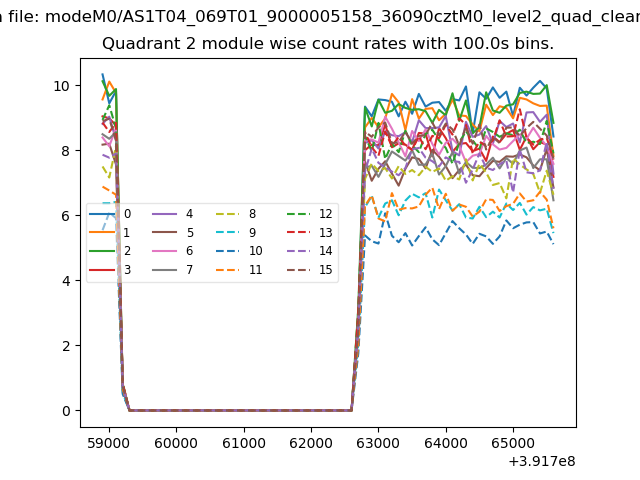
| Module-wise count rates for Quadrant B Data is divided into 100 sec bins |
 |
 |
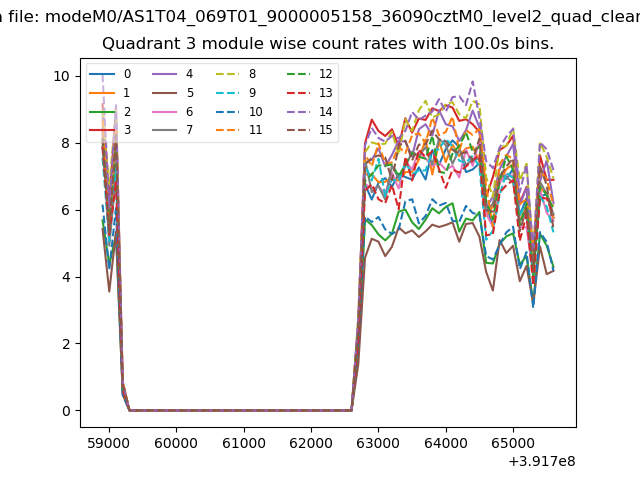
| Module-wise count rates for Quadrant C Data is divided into 100 sec bins |
 |
 |
| Module-wise count rates for Quadrant D Data is divided into 100 sec bins |
 |
 |
| Parameter | Plot |
|---|---|
| CZT HV Monitor | 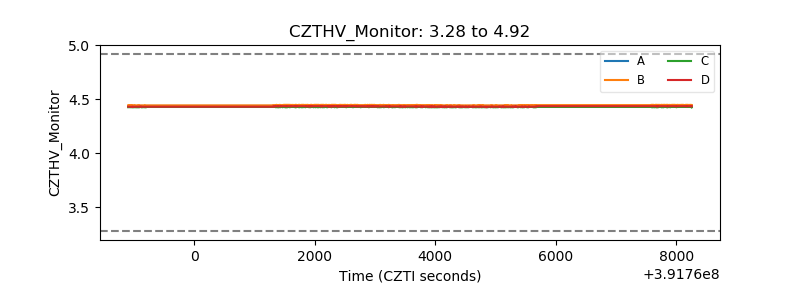 |
| D_VDD |  |
| Temperature 1 | 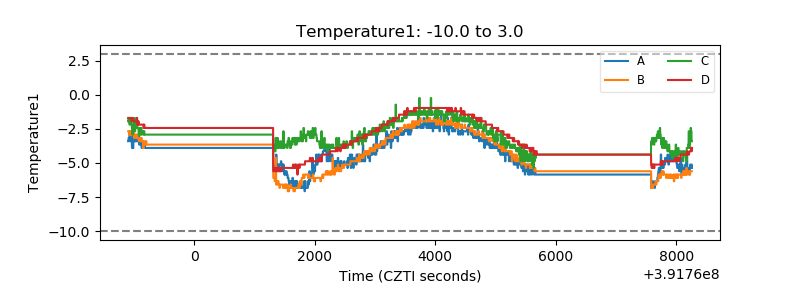 |
| Veto HV Monitor | 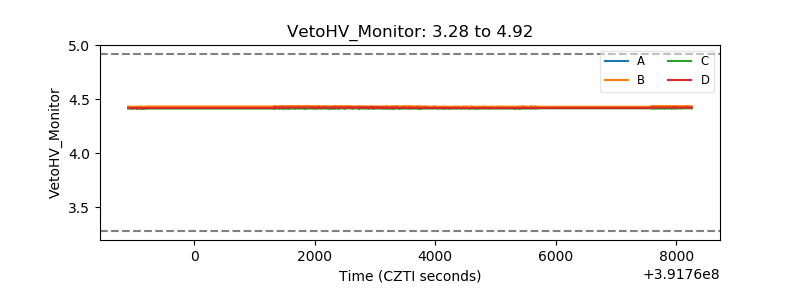 |
| Veto LLD |  |
| Alpha Counter | 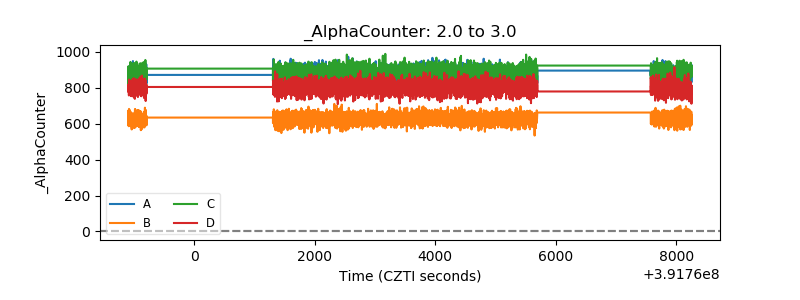 |
| _CPM_Rate | 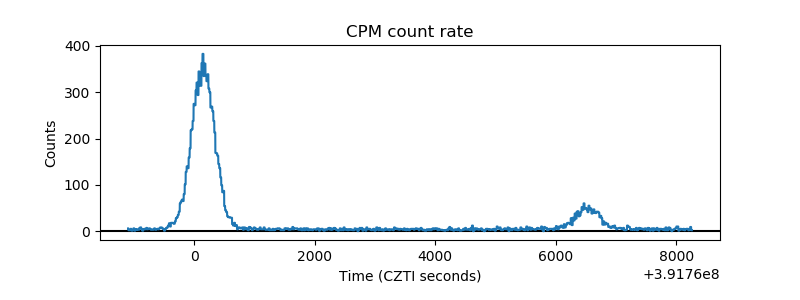 |
| CZT Counter | 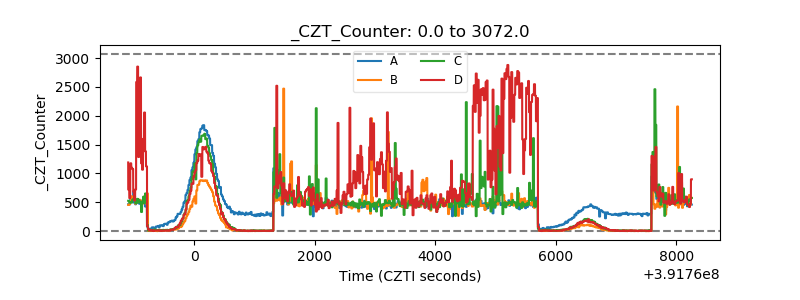 |
| +2.5 Volts monitor | 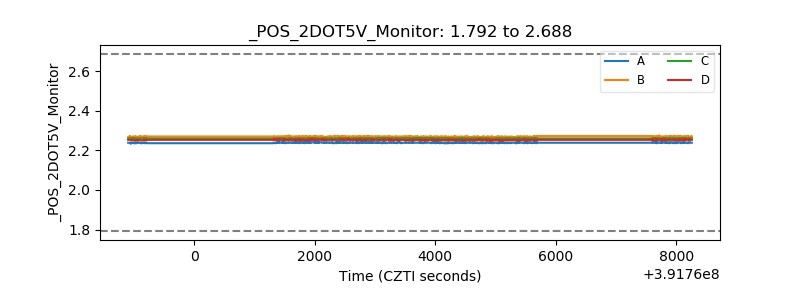 |
| +5 Volts monitor | 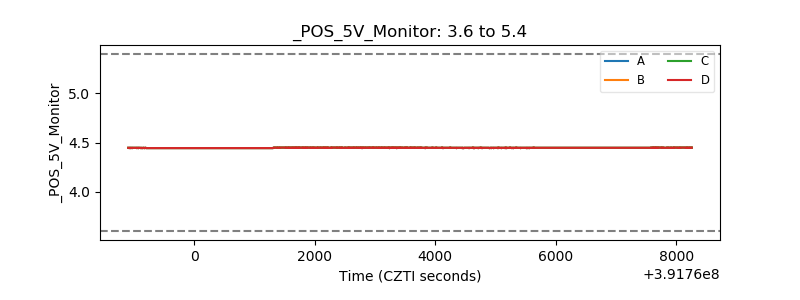 |
| _ROLL_ROT | 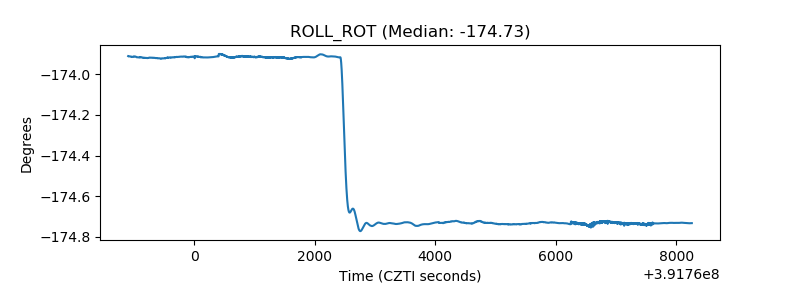 |
| _Roll_DEC | 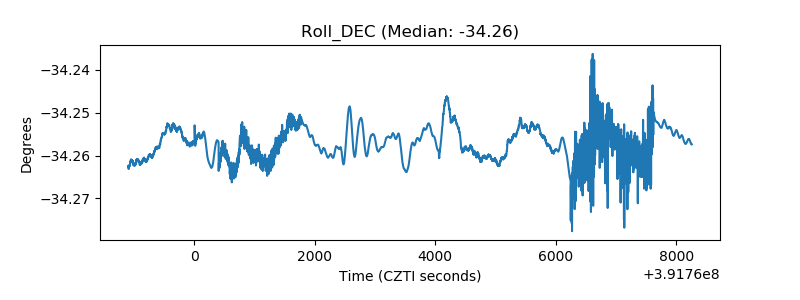 |
| _Roll_RA | 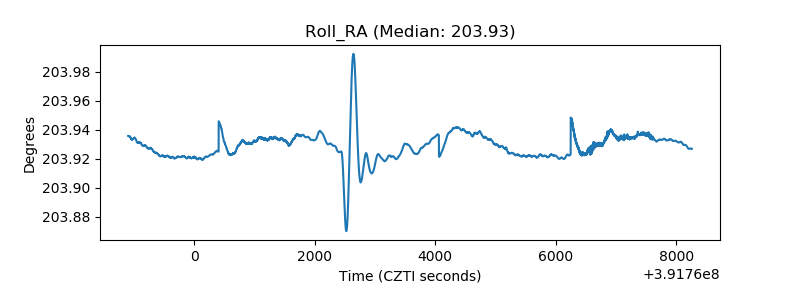 |
| Veto Counter | 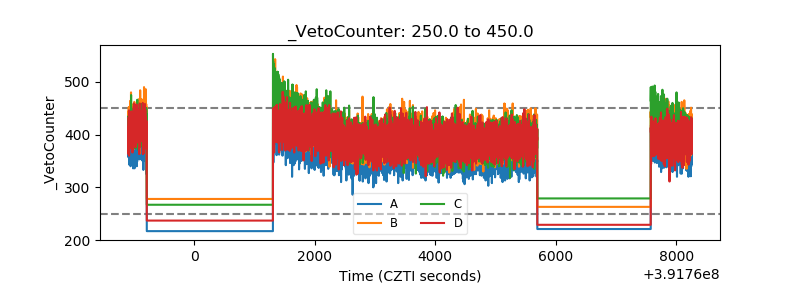 |