| Param | Original file | Final file |
|---|---|---|
| Filename | modeM0/AS1T04_069T01_9000005158_36087cztM0_level2.evt | modeM0/AS1T04_069T01_9000005158_36087cztM0_level2_quad_clean.evt |
| Size (bytes) | 432,918,720 | 50,777,280 |
| Size | 412.9 MB | 48.4 MB |
| Events in quadrant A | 2,692,486 | 298,382 |
| Events in quadrant B | 3,297,291 | 305,138 |
| Events in quadrant C | 3,014,570 | 287,193 |
| Events in quadrant D | 3,745,810 | 274,404 |
| Mode M0 | |||
|---|---|---|---|
| Quadrant | BADHDUFLAG | Total packets | Discarded packets |
| A | 0 | 11077 | 3 |
| B | 0 | 12909 | 2 |
| C | 0 | 11769 | 2 |
| D | 0 | 14484 | 2 |
| Mode M9 | |||
|---|---|---|---|
| Quadrant | BADHDUFLAG | Total packets | Discarded packets |
| A | 0 | 39 | 0 |
| B | 0 | 39 | 0 |
| C | 0 | 39 | 0 |
| D | 0 | 40 | 0 |
| Mode SS | |||
|---|---|---|---|
| Quadrant | BADHDUFLAG | Total packets | Discarded packets |
| A | 0 | 108 | 0 |
| B | 0 | 108 | 0 |
| C | 0 | 108 | 0 |
| D | 0 | 108 | 0 |
| Quadrant | Total seconds | Saturated seconds | Saturation percentage |
|---|---|---|---|
| A | 5313 | 8 | 0.150574% |
| B | 5313 | 174 | 3.274986% |
| C | 5313 | 109 | 2.051572% |
| D | 5313 | 225 | 4.234896% |
Noise dominated data is calculated using 1-second bins in cleaned event files. If a bin has >2000 counts, and if more than 50% of those come from <1% of pixels, then it is considered to be noise-dominated and hence unusable.
| Quadrant | # 1 sec bins | Bins with >0 counts | Bins with >2000 counts | High rate bins dominated by noise | Noise dominated (total time) | Noise dominated (detector-on time) | Marked lightcurve |
|---|---|---|---|---|---|---|---|
| A | 7407 | 5314 | 0 | 0 | 0.00% | 0.00% | 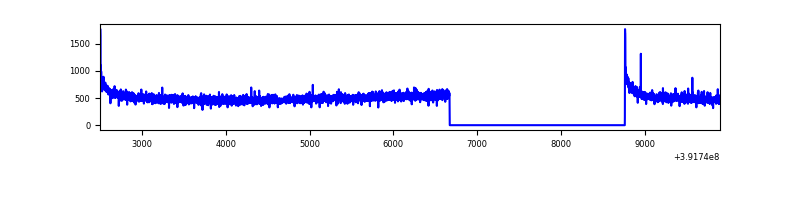 |
| B | 7407 | 5314 | 130 | 130 | 1.76% | 2.45% | 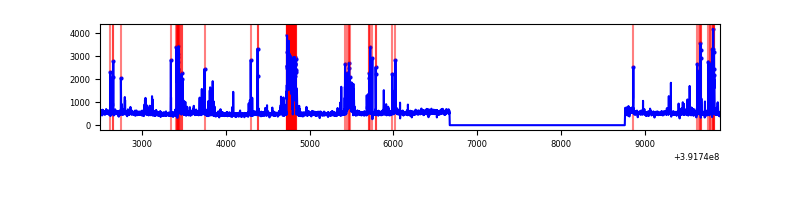 |
| C | 7407 | 5314 | 86 | 86 | 1.16% | 1.62% | 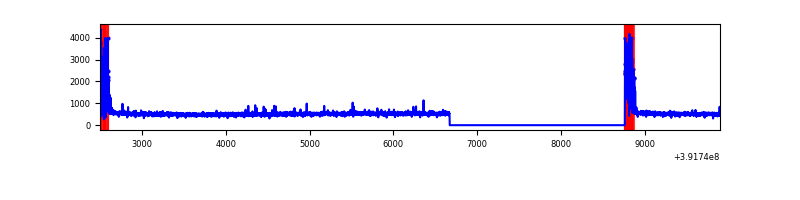 |
| D | 7407 | 5314 | 187 | 187 | 2.52% | 3.52% | 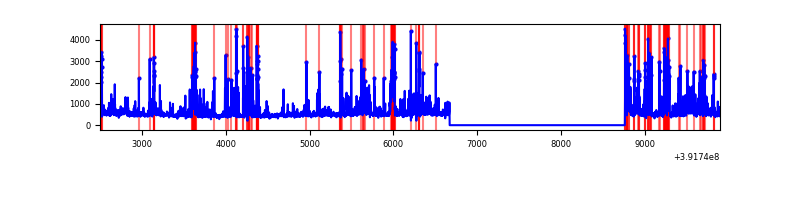 |
Top three noisy pixels from each quadrant. If the there are fewer than three noisy pixels in the level2.evt file, extra rows are filled as -1
| Pixel properties | Quadrant properties | ||||||
|---|---|---|---|---|---|---|---|
| Quadrant | DetID | PixID | Counts | Sigma | Mean | Median | Sigma |
| A | 10 | 83 | 168912 | 1281.15 | 650 | 639 | 131.3 |
| A | 13 | 6 | 12775 | 92.39 | 650 | 639 | 131.3 |
| A | 13 | 254 | 7851 | 54.91 | 650 | 639 | 131.3 |
| B | 5 | 172 | 604181 | 4917.81 | 644 | 626 | 122.7 |
| B | 0 | 190 | 73631 | 594.85 | 644 | 626 | 122.7 |
| B | 0 | 229 | 32597 | 260.5 | 644 | 626 | 122.7 |
| C | 0 | 10 | 327325 | 2238.81 | 629 | 637 | 145.9 |
| C | 15 | 214 | 220494 | 1506.69 | 629 | 637 | 145.9 |
| C | 9 | 187 | 6124 | 37.6 | 629 | 637 | 145.9 |
| D | 12 | 6 | 460579 | 3054.0 | 619 | 602 | 150.6 |
| D | 12 | 233 | 297612 | 1971.99 | 619 | 602 | 150.6 |
| D | 1 | 52 | 142550 | 942.46 | 619 | 602 | 150.6 |
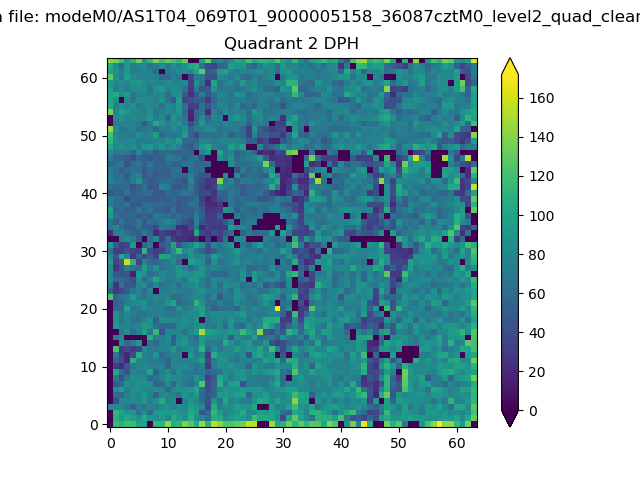
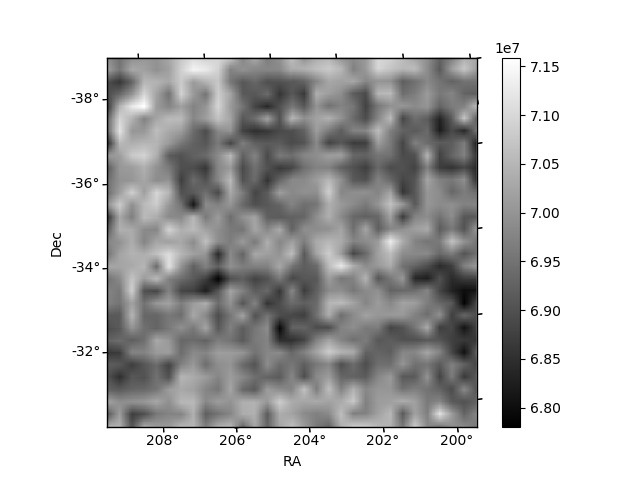
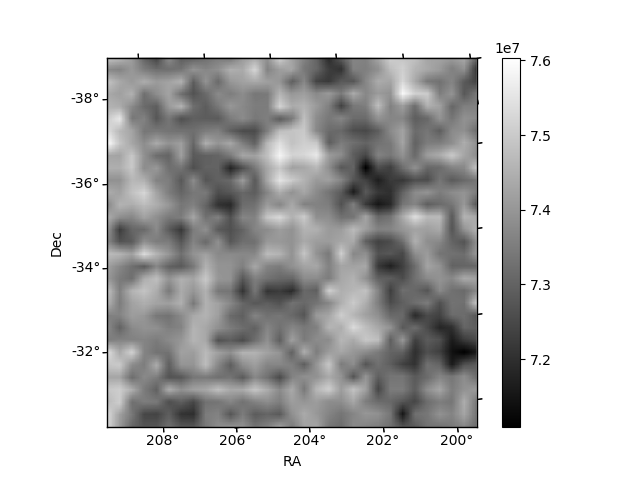
Histogram calculated using DETX and DETY for each event in the final _common_clean file
| Quadrant A | 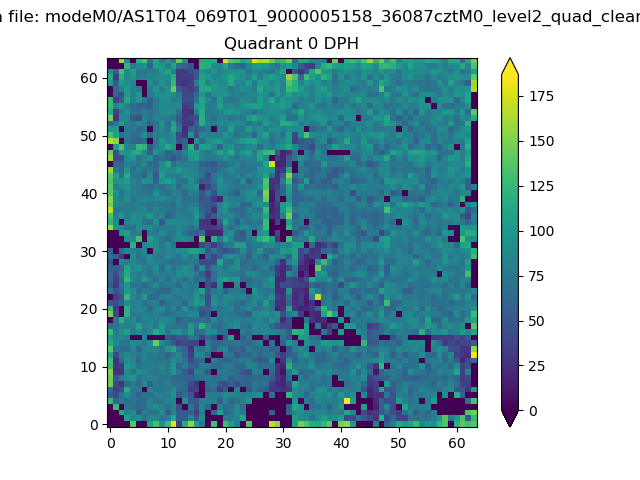 |
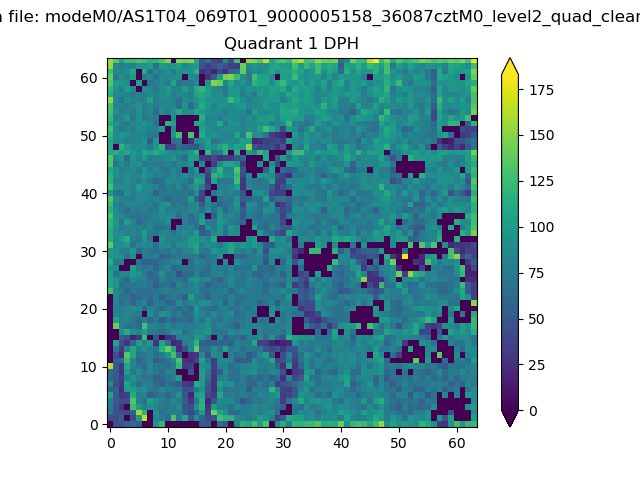 |
Quadrant B |
|---|---|---|---|
| Quadrant D | 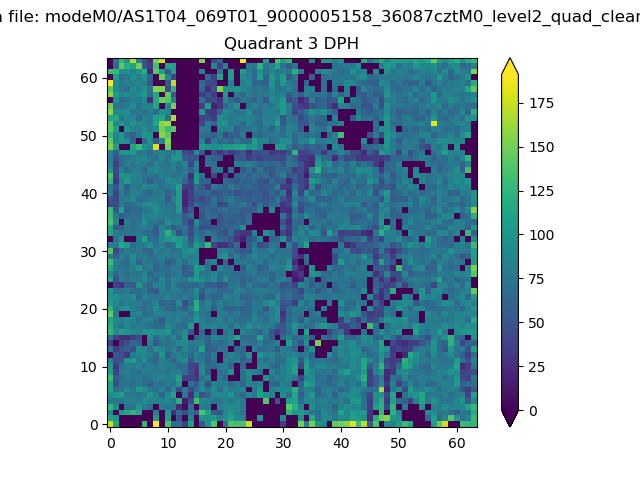 |
 |
Quadrant C |
| Plot type | Count rate plots | Images |
|---|---|---|
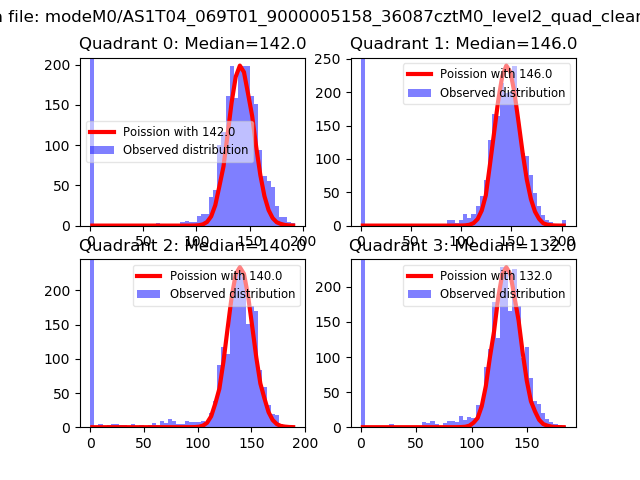
| Comparison with Poisson distribution Blue bars denote a histogram of data divided into 1 sec bins. Red curve is a Poisson curve with rate = median count rate of data. |
 |
 |
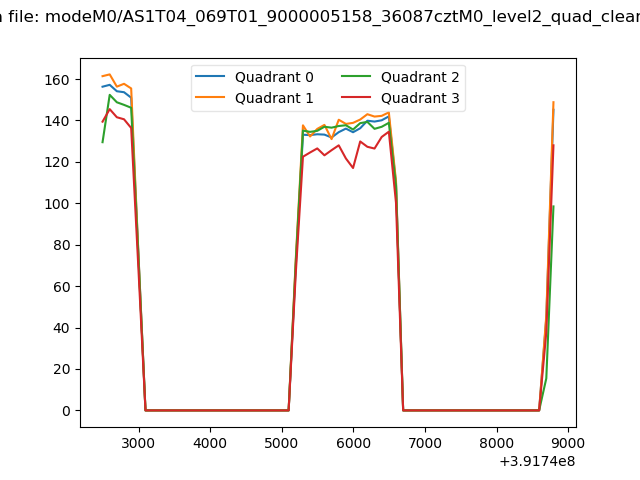
| Quadrant-wise count rates Data is divided into 100 sec bins |
 |
|
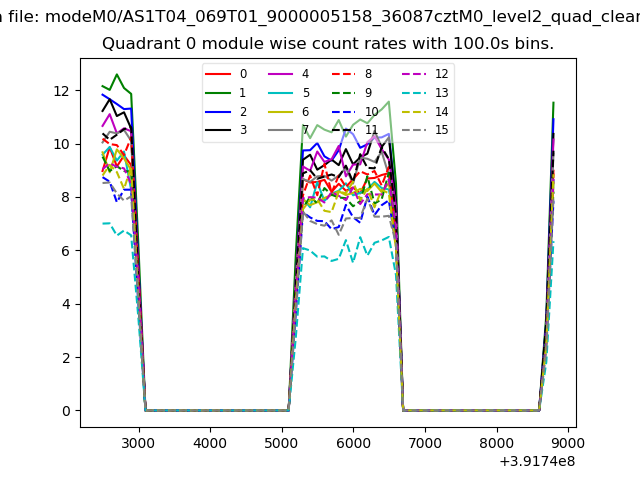
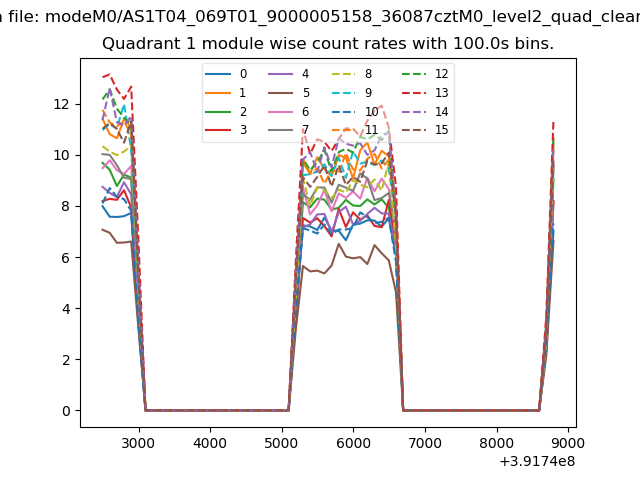
| Module-wise count rates for Quadrant A Data is divided into 100 sec bins |
 |
 |
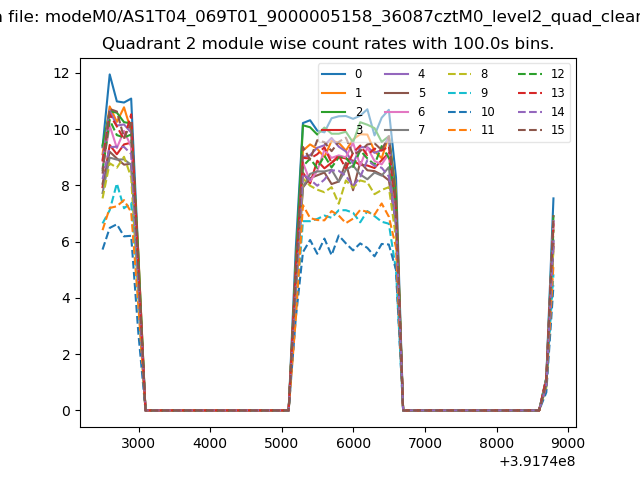
| Module-wise count rates for Quadrant B Data is divided into 100 sec bins |
 |
 |
| Module-wise count rates for Quadrant C Data is divided into 100 sec bins |
 |
 |
| Module-wise count rates for Quadrant D Data is divided into 100 sec bins |
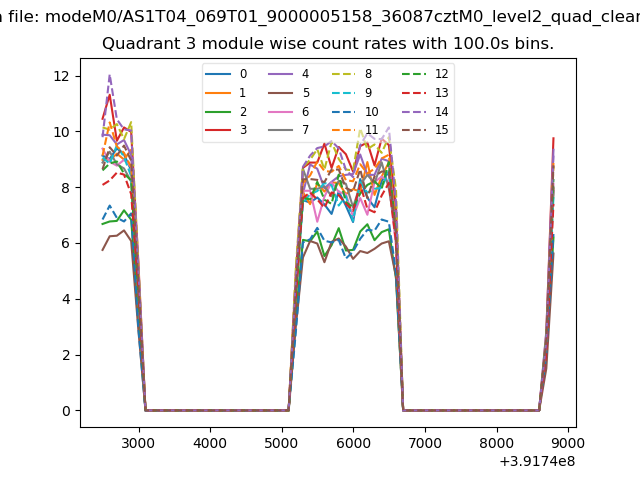 |
 |
| Parameter | Plot |
|---|---|
| CZT HV Monitor | 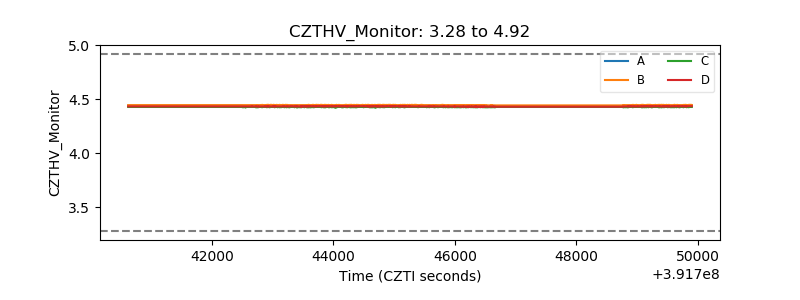 |
| D_VDD | 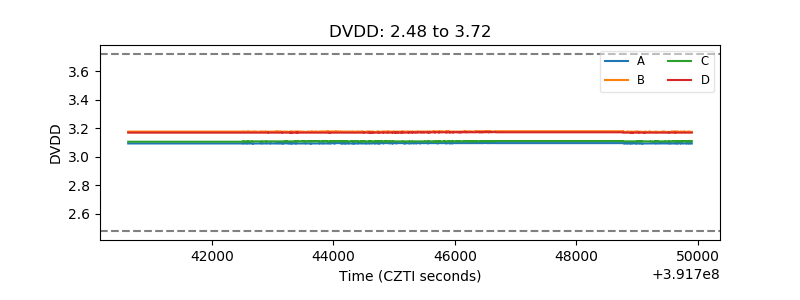 |
| Temperature 1 | 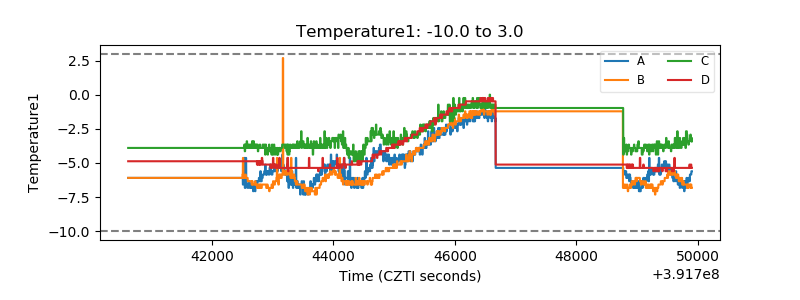 |
| Veto HV Monitor |  |
| Veto LLD | 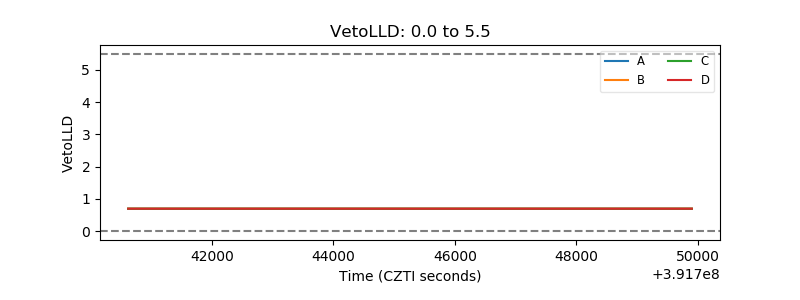 |
| Alpha Counter | 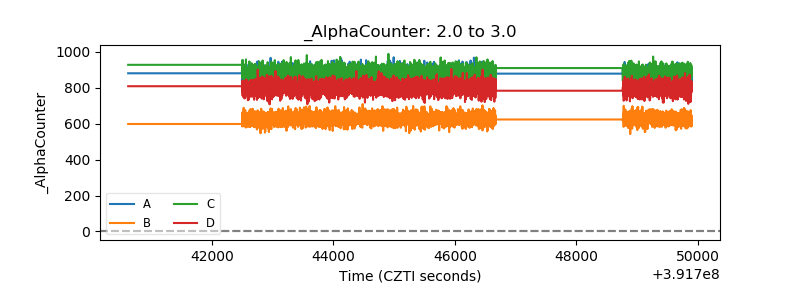 |
| _CPM_Rate | 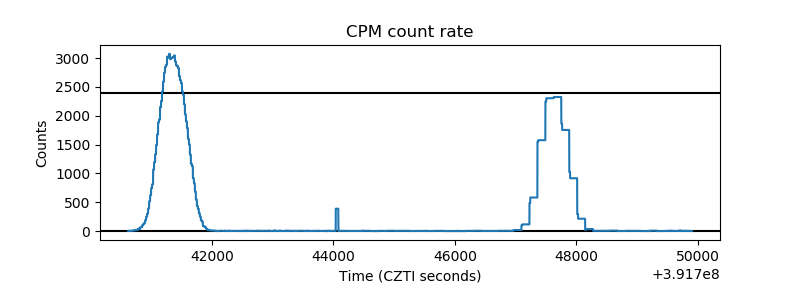 |
| CZT Counter | 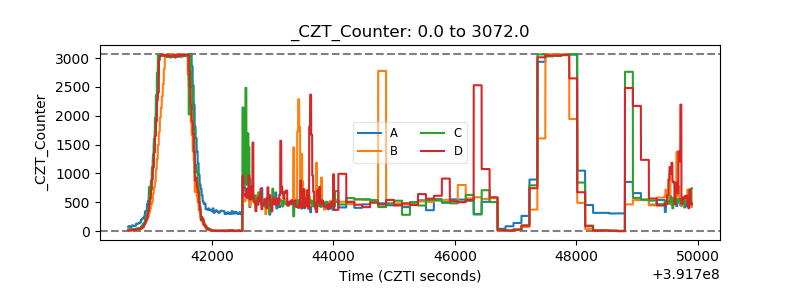 |
| +2.5 Volts monitor | 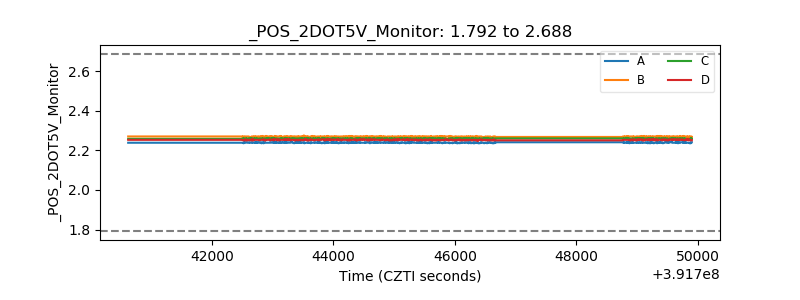 |
| +5 Volts monitor | 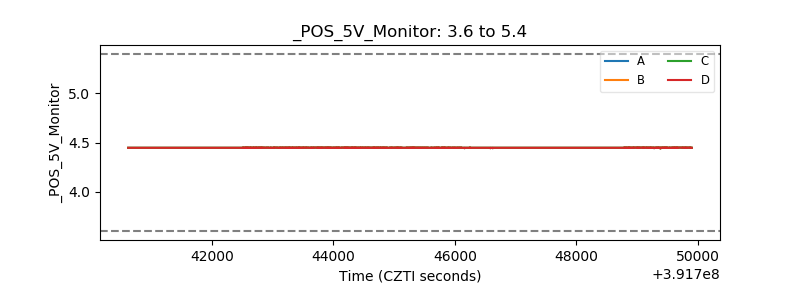 |
| _ROLL_ROT | 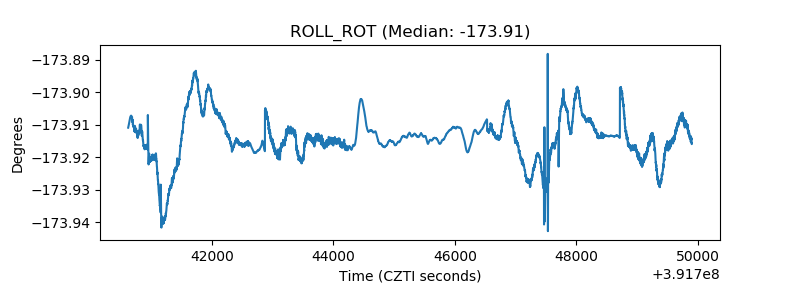 |
| _Roll_DEC | 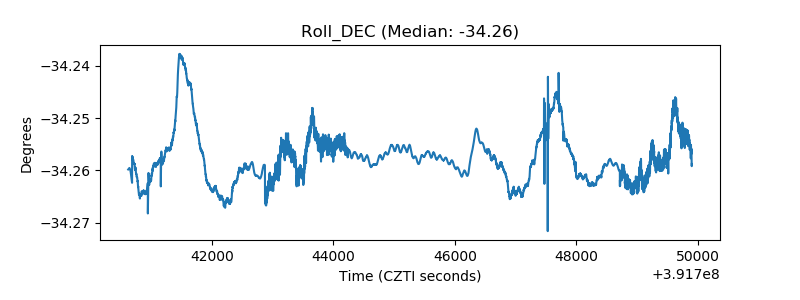 |
| _Roll_RA | 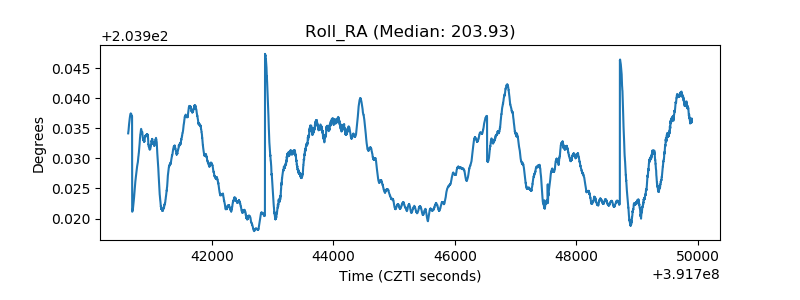 |
| Veto Counter | 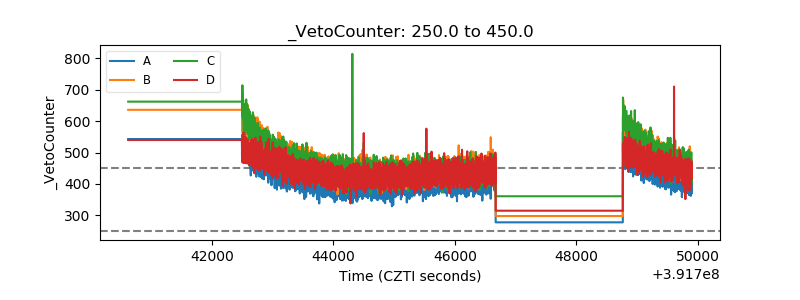 |