| Param | Original file | Final file |
|---|---|---|
| Filename | modeM0/AS1T04_069T01_9000005158_36085cztM0_level2.evt | modeM0/AS1T04_069T01_9000005158_36085cztM0_level2_quad_clean.evt |
| Size (bytes) | 451,926,720 | 63,368,640 |
| Size | 431.0 MB | 60.4 MB |
| Events in quadrant A | 2,531,453 | 403,963 |
| Events in quadrant B | 2,636,550 | 410,175 |
| Events in quadrant C | 4,532,841 | 372,045 |
| Events in quadrant D | 3,636,244 | 371,374 |
| Mode M0 | |||
|---|---|---|---|
| Quadrant | BADHDUFLAG | Total packets | Discarded packets |
| A | 0 | 10784 | 3 |
| B | 0 | 11012 | 2 |
| C | 0 | 16991 | 2 |
| D | 0 | 14164 | 2 |
| Mode M9 | |||
|---|---|---|---|
| Quadrant | BADHDUFLAG | Total packets | Discarded packets |
| A | 0 | 35 | 0 |
| B | 0 | 35 | 0 |
| C | 0 | 35 | 0 |
| D | 0 | 35 | 0 |
| Mode SS | |||
|---|---|---|---|
| Quadrant | BADHDUFLAG | Total packets | Discarded packets |
| A | 0 | 104 | 0 |
| B | 0 | 104 | 0 |
| C | 0 | 104 | 0 |
| D | 0 | 104 | 0 |
| Quadrant | Total seconds | Saturated seconds | Saturation percentage |
|---|---|---|---|
| A | 5154 | 9 | 0.174622% |
| B | 5154 | 26 | 0.504463% |
| C | 5154 | 414 | 8.032596% |
| D | 5154 | 227 | 4.404346% |
Noise dominated data is calculated using 1-second bins in cleaned event files. If a bin has >2000 counts, and if more than 50% of those come from <1% of pixels, then it is considered to be noise-dominated and hence unusable.
| Quadrant | # 1 sec bins | Bins with >0 counts | Bins with >2000 counts | High rate bins dominated by noise | Noise dominated (total time) | Noise dominated (detector-on time) | Marked lightcurve |
|---|---|---|---|---|---|---|---|
| A | 7036 | 5155 | 1 | 1 | 0.01% | 0.02% | 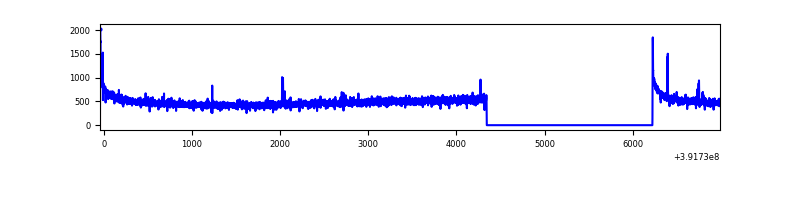 |
| B | 7036 | 5155 | 14 | 14 | 0.20% | 0.27% | 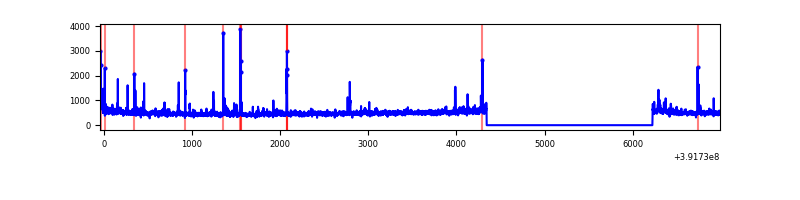 |
| C | 7036 | 5155 | 350 | 350 | 4.97% | 6.79% | 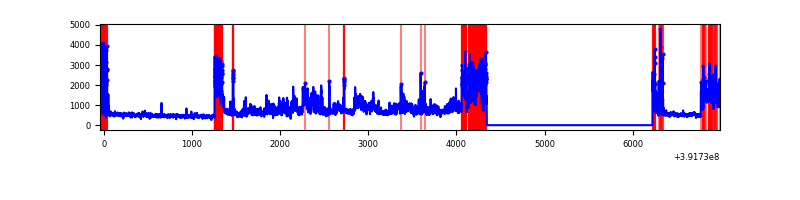 |
| D | 7036 | 5155 | 228 | 228 | 3.24% | 4.42% | 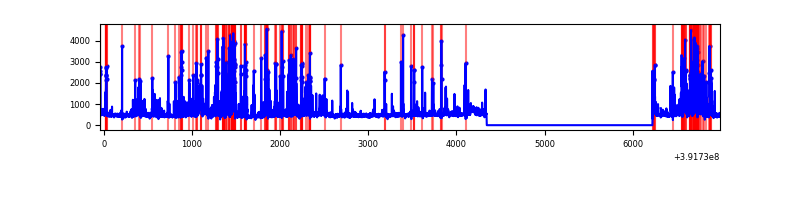 |
Top three noisy pixels from each quadrant. If the there are fewer than three noisy pixels in the level2.evt file, extra rows are filled as -1
| Pixel properties | Quadrant properties | ||||||
|---|---|---|---|---|---|---|---|
| Quadrant | DetID | PixID | Counts | Sigma | Mean | Median | Sigma |
| A | 10 | 83 | 168899 | 1387.27 | 604 | 594 | 121.3 |
| A | 13 | 6 | 10618 | 82.62 | 604 | 594 | 121.3 |
| A | 9 | 143 | 8137 | 62.17 | 604 | 594 | 121.3 |
| B | 0 | 190 | 77188 | 652.38 | 604 | 588 | 117.4 |
| B | 5 | 255 | 63411 | 535.05 | 604 | 588 | 117.4 |
| B | 5 | 172 | 41711 | 350.24 | 604 | 588 | 117.4 |
| C | 10 | 49 | 1732701 | 13020.1 | 570 | 576 | 133.0 |
| C | 0 | 10 | 247796 | 1858.31 | 570 | 576 | 133.0 |
| C | 15 | 214 | 209734 | 1572.21 | 570 | 576 | 133.0 |
| D | 12 | 233 | 510240 | 3633.03 | 571 | 554 | 140.3 |
| D | 12 | 6 | 493832 | 3516.07 | 571 | 554 | 140.3 |
| D | 10 | 118 | 160034 | 1136.77 | 571 | 554 | 140.3 |
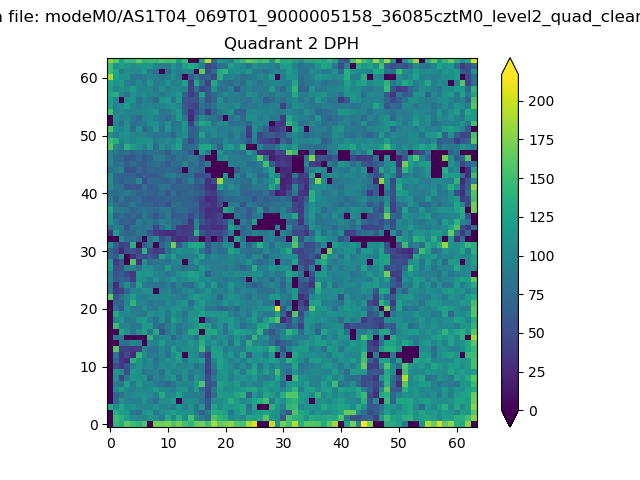
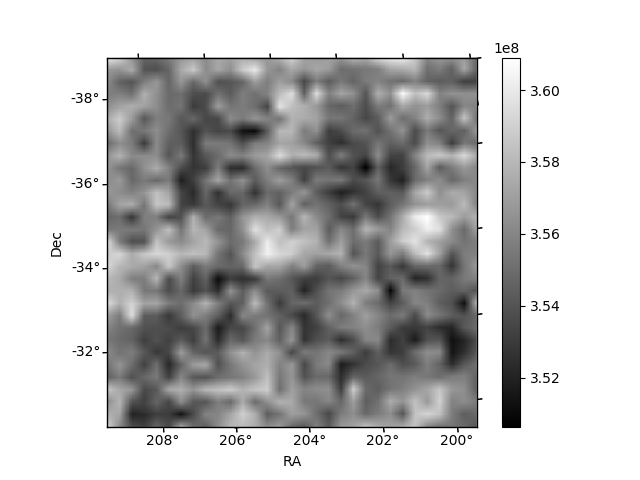
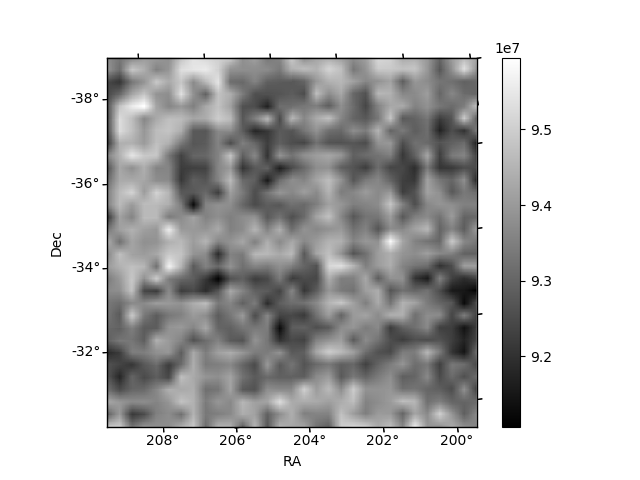
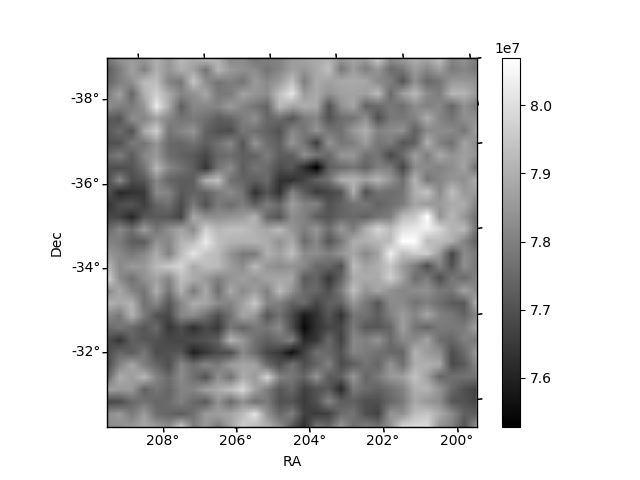
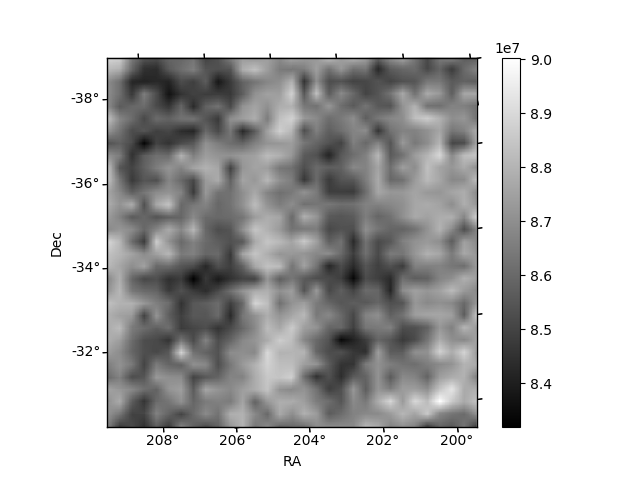
Histogram calculated using DETX and DETY for each event in the final _common_clean file
| Quadrant A | 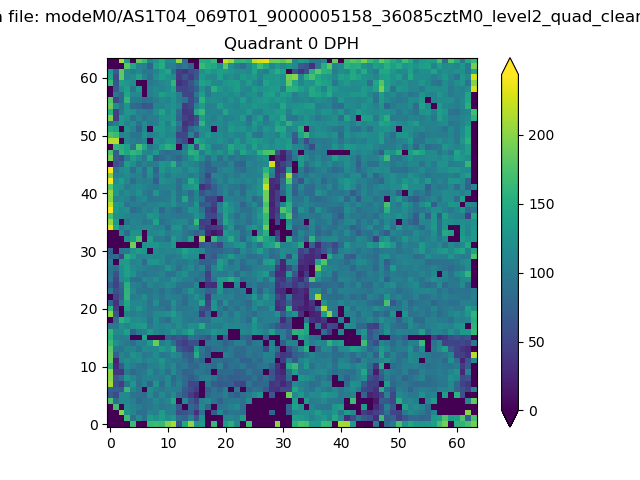 |
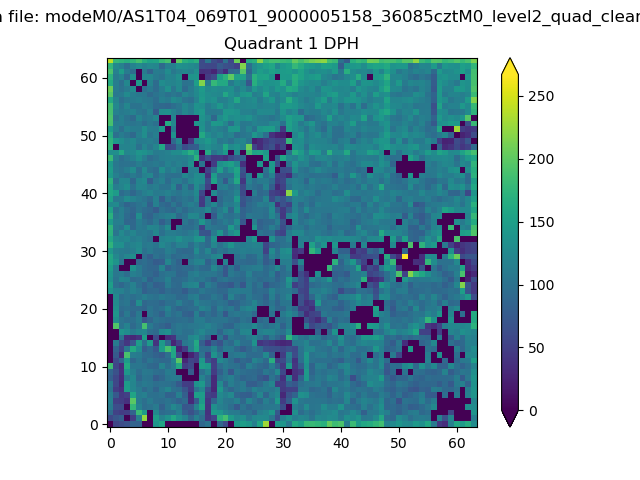 |
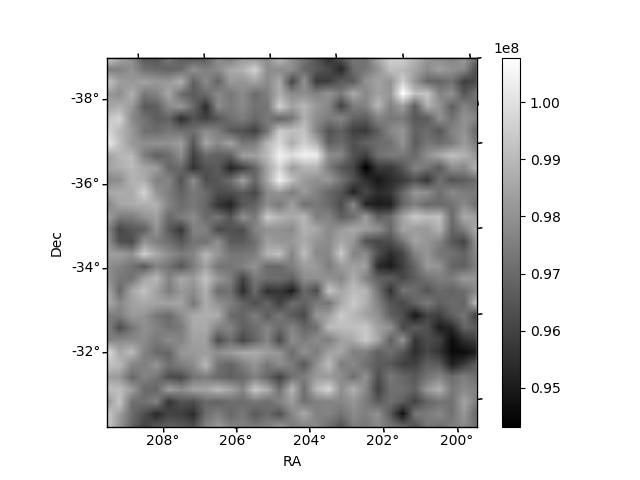
Quadrant B |
|---|---|---|---|
| Quadrant D | 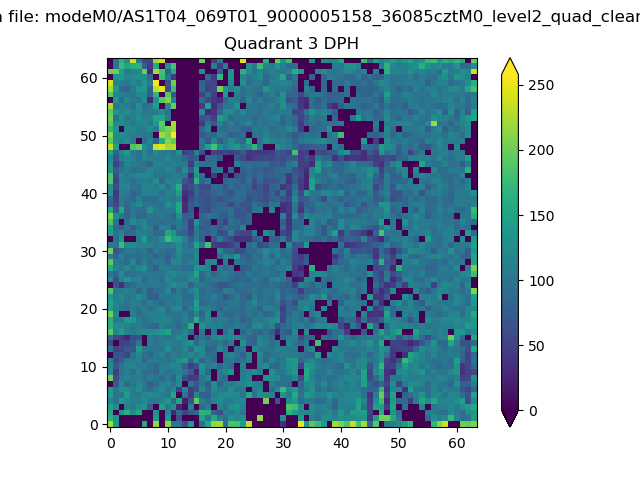 |
 |
Quadrant C |
| Plot type | Count rate plots | Images |
|---|---|---|
| Comparison with Poisson distribution Blue bars denote a histogram of data divided into 1 sec bins. Red curve is a Poisson curve with rate = median count rate of data. |
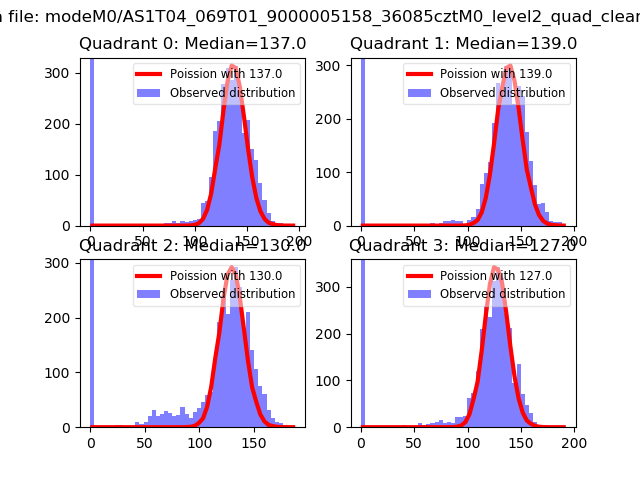 |
 |
| Quadrant-wise count rates Data is divided into 100 sec bins |
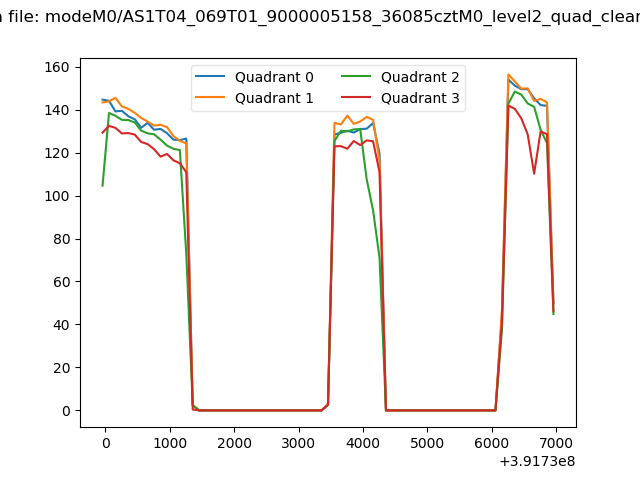 |
|
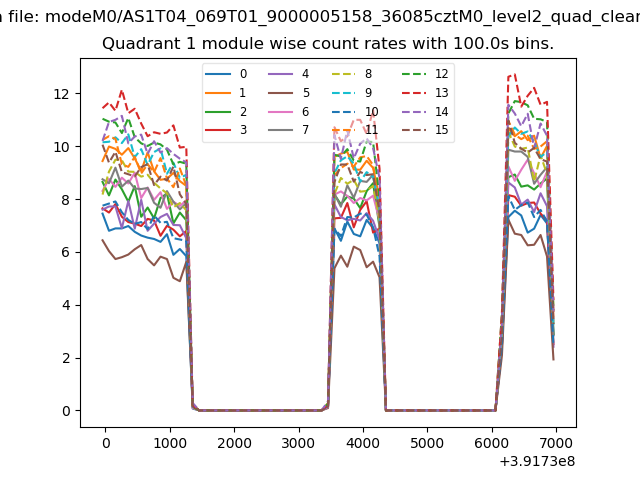
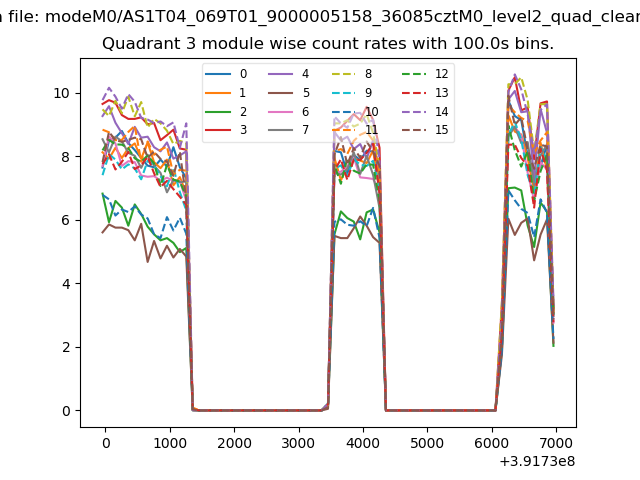
| Module-wise count rates for Quadrant A Data is divided into 100 sec bins |
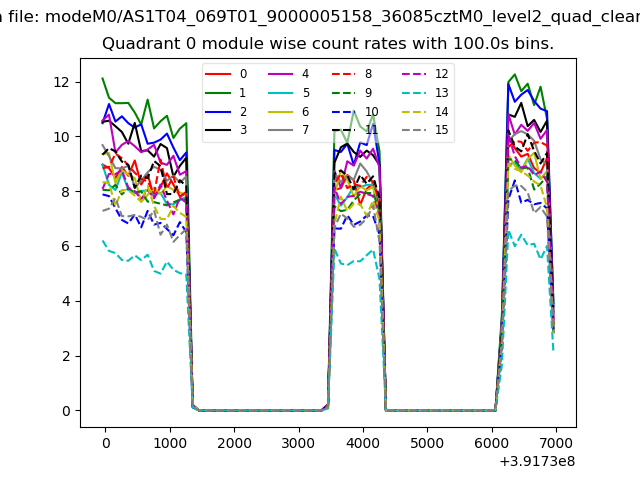 |
 |
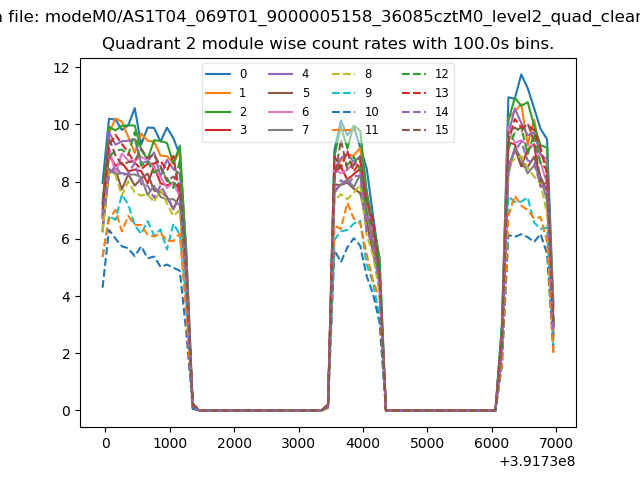
| Module-wise count rates for Quadrant B Data is divided into 100 sec bins |
 |
 |
| Module-wise count rates for Quadrant C Data is divided into 100 sec bins |
 |
 |
| Module-wise count rates for Quadrant D Data is divided into 100 sec bins |
 |
 |
| Parameter | Plot |
|---|---|
| CZT HV Monitor | 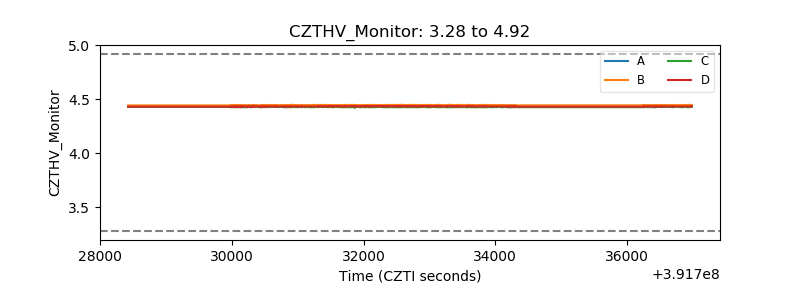 |
| D_VDD | 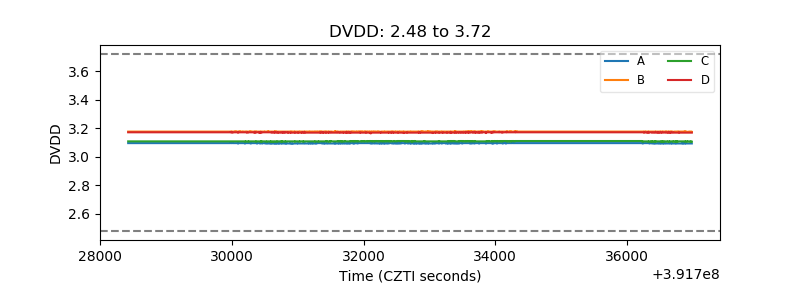 |
| Temperature 1 | 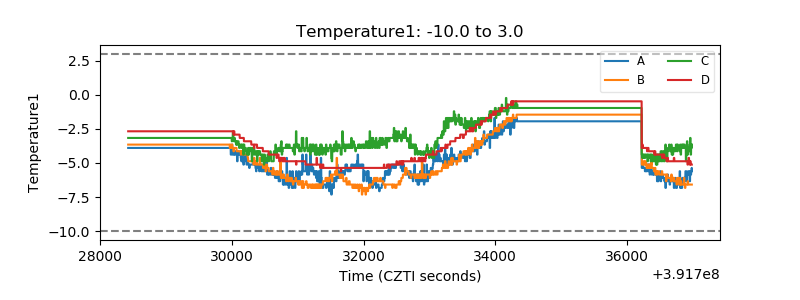 |
| Veto HV Monitor | 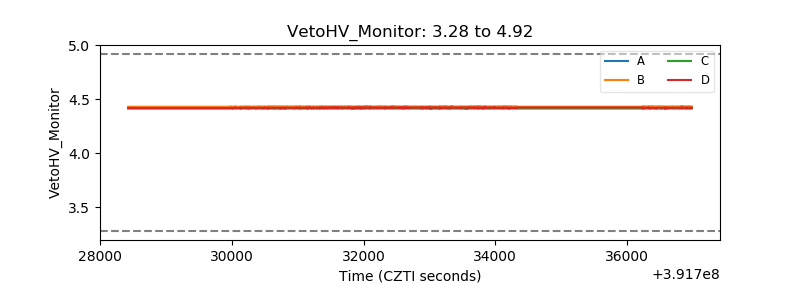 |
| Veto LLD | 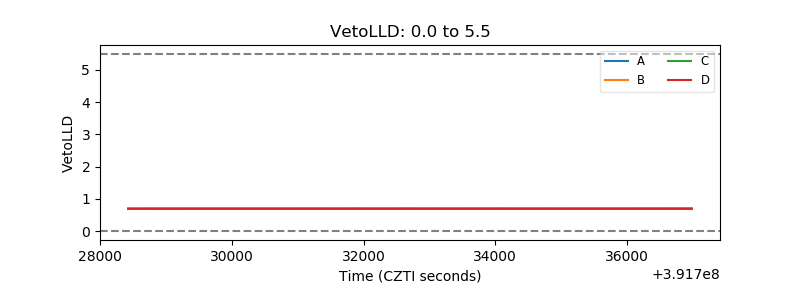 |
| Alpha Counter | 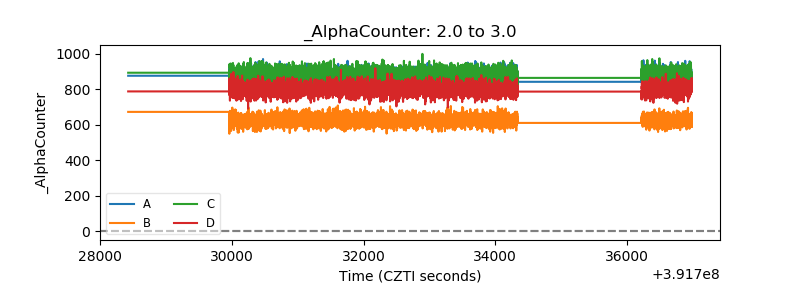 |
| _CPM_Rate | 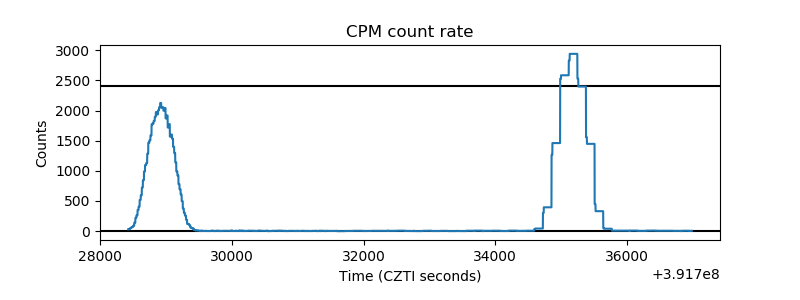 |
| CZT Counter | 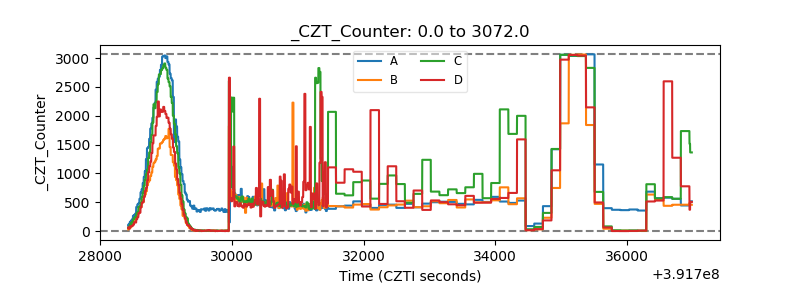 |
| +2.5 Volts monitor | 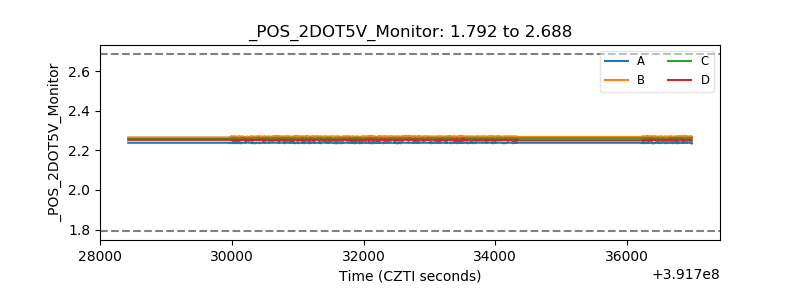 |
| +5 Volts monitor | 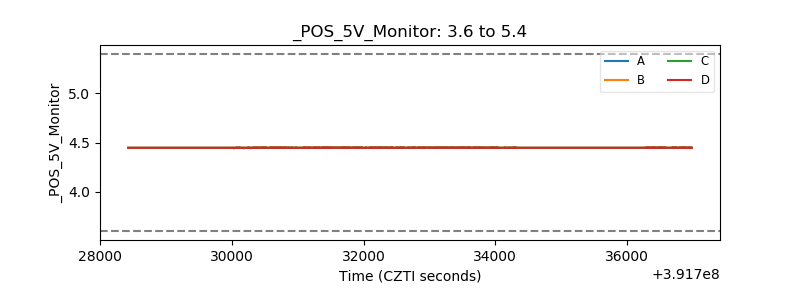 |
| _ROLL_ROT | 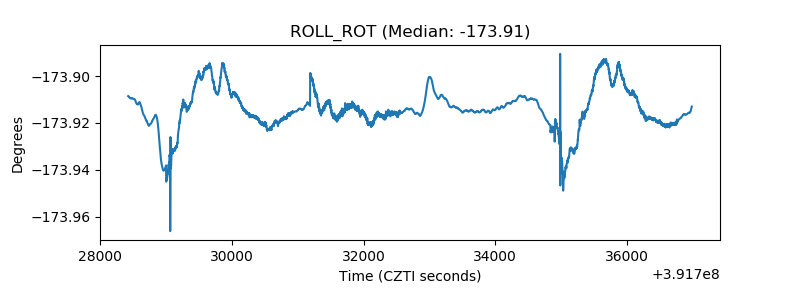 |
| _Roll_DEC | 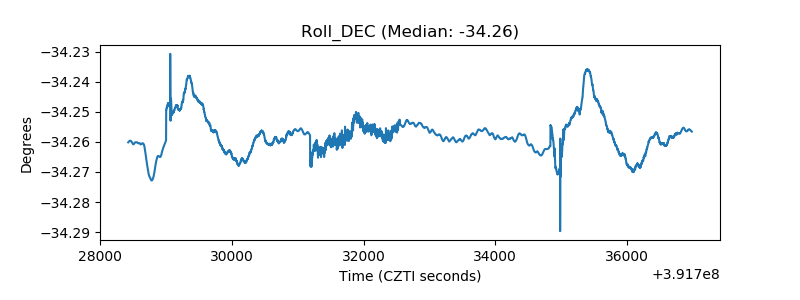 |
| _Roll_RA | 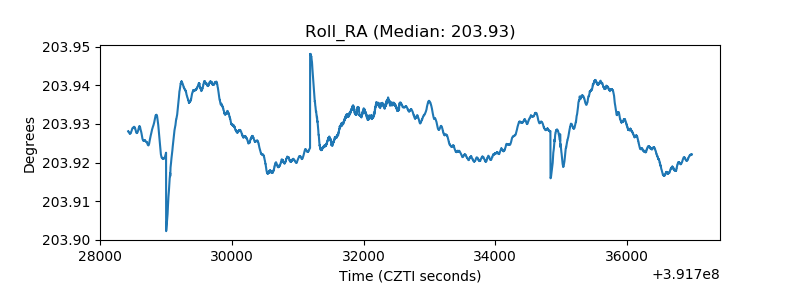 |
| Veto Counter | 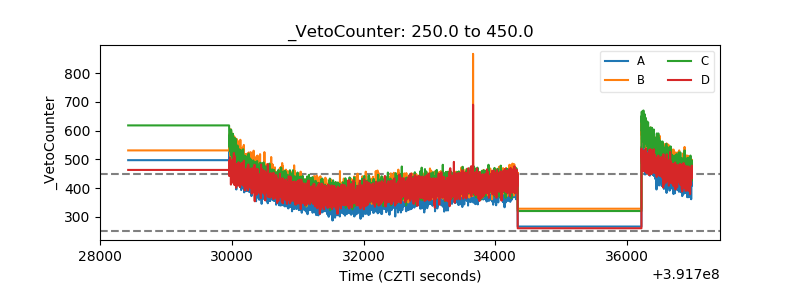 |