| Param | Original file | Final file |
|---|---|---|
| Filename | modeM0/AS1T04_069T01_9000005158_36084cztM0_level2.evt | modeM0/AS1T04_069T01_9000005158_36084cztM0_level2_quad_clean.evt |
| Size (bytes) | 1,330,750,080 | 239,823,360 |
| Size | 1.2 GB | 228.7 MB |
| Events in quadrant A | 8,178,339 | 1,580,721 |
| Events in quadrant B | 10,081,265 | 1,558,963 |
| Events in quadrant C | 9,034,934 | 1,524,462 |
| Events in quadrant D | 11,832,171 | 1,399,870 |
| Mode M0 | |||
|---|---|---|---|
| Quadrant | BADHDUFLAG | Total packets | Discarded packets |
| A | 0 | 35763 | 6 |
| B | 0 | 41115 | 4 |
| C | 0 | 38033 | 4 |
| D | 0 | 46901 | 4 |
| Mode M9 | |||
|---|---|---|---|
| Quadrant | BADHDUFLAG | Total packets | Discarded packets |
| A | 0 | 51 | 0 |
| B | 0 | 51 | 0 |
| C | 0 | 51 | 0 |
| D | 0 | 51 | 0 |
| Mode SS | |||
|---|---|---|---|
| Quadrant | BADHDUFLAG | Total packets | Discarded packets |
| A | 0 | 358 | 0 |
| B | 0 | 358 | 0 |
| C | 0 | 358 | 0 |
| D | 0 | 358 | 0 |
| Quadrant | Total seconds | Saturated seconds | Saturation percentage |
|---|---|---|---|
| A | 17384 | 22 | 0.126553% |
| B | 17384 | 537 | 3.089047% |
| C | 17384 | 209 | 1.202255% |
| D | 17384 | 1090 | 6.270133% |
Noise dominated data is calculated using 1-second bins in cleaned event files. If a bin has >2000 counts, and if more than 50% of those come from <1% of pixels, then it is considered to be noise-dominated and hence unusable.
| Quadrant | # 1 sec bins | Bins with >0 counts | Bins with >2000 counts | High rate bins dominated by noise | Noise dominated (total time) | Noise dominated (detector-on time) | Marked lightcurve |
|---|---|---|---|---|---|---|---|
| A | 37606 | 17388 | 2 | 2 | 0.01% | 0.01% | 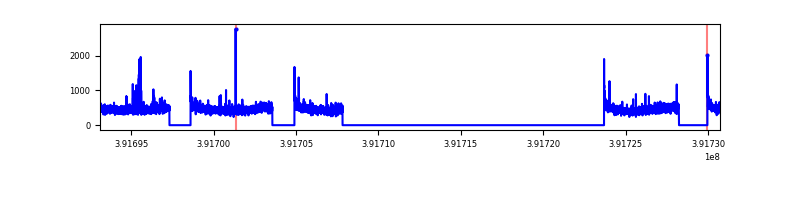 |
| B | 37606 | 17388 | 407 | 407 | 1.08% | 2.34% | 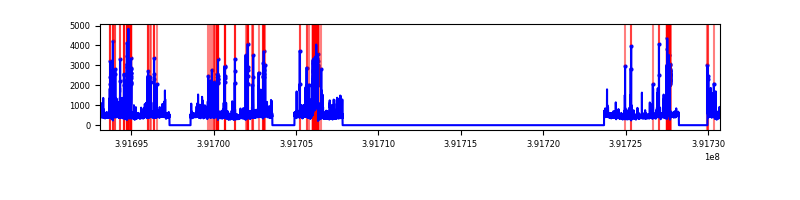 |
| C | 37606 | 17388 | 153 | 153 | 0.41% | 0.88% | 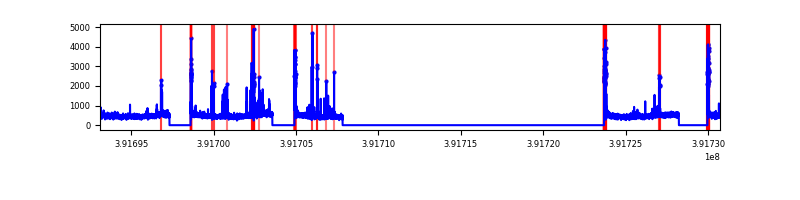 |
| D | 37606 | 17388 | 1002 | 1002 | 2.66% | 5.76% | 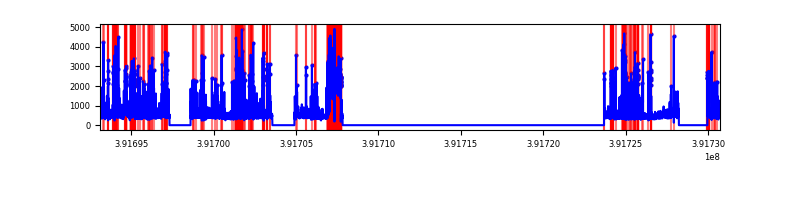 |
Top three noisy pixels from each quadrant. If the there are fewer than three noisy pixels in the level2.evt file, extra rows are filled as -1
| Pixel properties | Quadrant properties | ||||||
|---|---|---|---|---|---|---|---|
| Quadrant | DetID | PixID | Counts | Sigma | Mean | Median | Sigma |
| A | 10 | 83 | 469224 | 1181.55 | 1970 | 1930 | 395.5 |
| A | 9 | 143 | 64018 | 156.99 | 1970 | 1930 | 395.5 |
| A | 13 | 6 | 25451 | 59.47 | 1970 | 1930 | 395.5 |
| B | 5 | 172 | 1579344 | 4270.37 | 1929 | 1882 | 369.4 |
| B | 0 | 190 | 210514 | 564.79 | 1929 | 1882 | 369.4 |
| B | 5 | 255 | 175000 | 468.65 | 1929 | 1882 | 369.4 |
| C | 15 | 214 | 714539 | 1624.68 | 1880 | 1892 | 438.6 |
| C | 0 | 10 | 483010 | 1096.84 | 1880 | 1892 | 438.6 |
| C | 15 | 208 | 474886 | 1078.32 | 1880 | 1892 | 438.6 |
| D | 1 | 52 | 1981229 | 4426.66 | 1824 | 1774 | 447.2 |
| D | 12 | 227 | 715575 | 1596.27 | 1824 | 1774 | 447.2 |
| D | 12 | 6 | 625416 | 1394.65 | 1824 | 1774 | 447.2 |
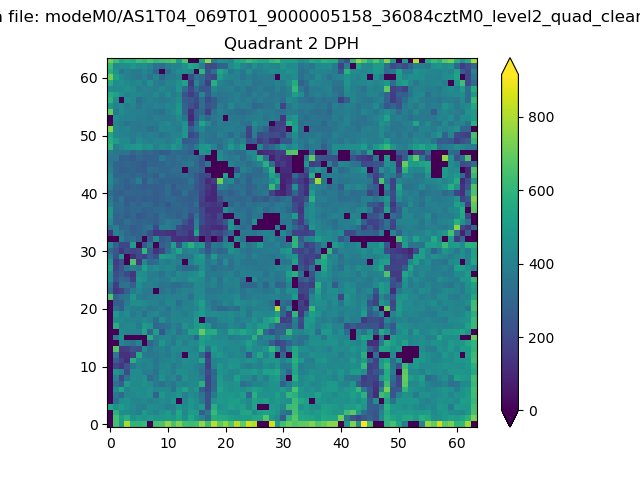
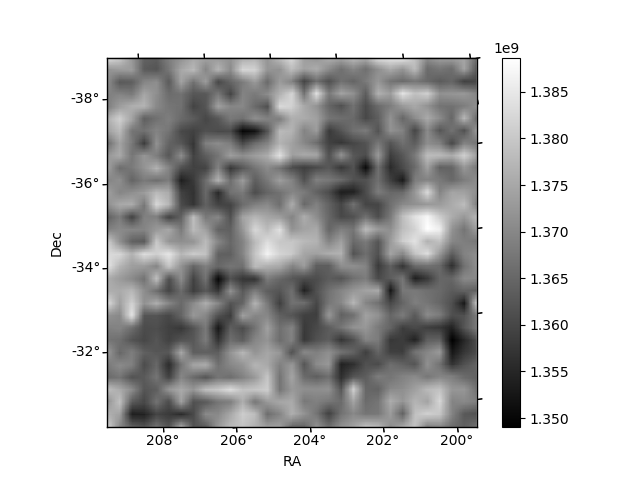
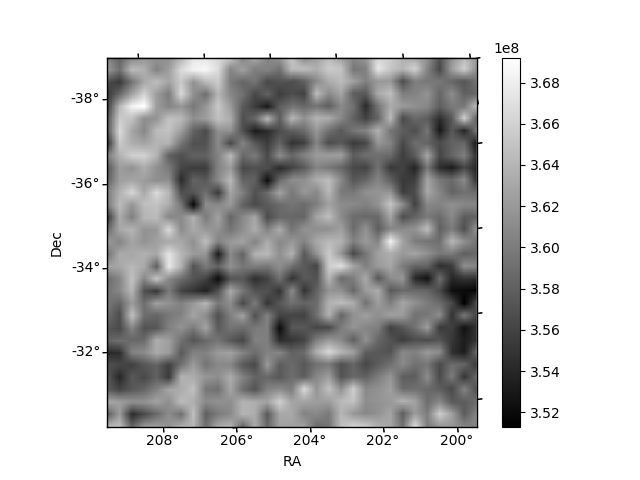
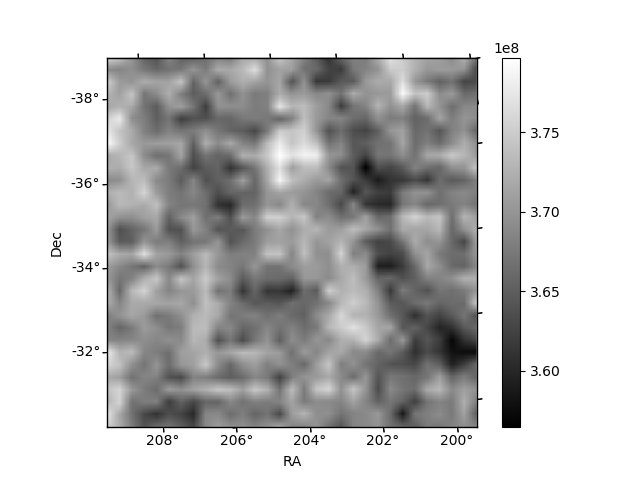
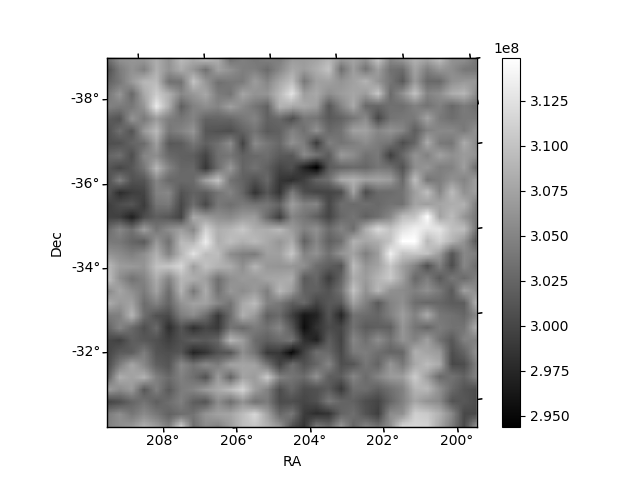
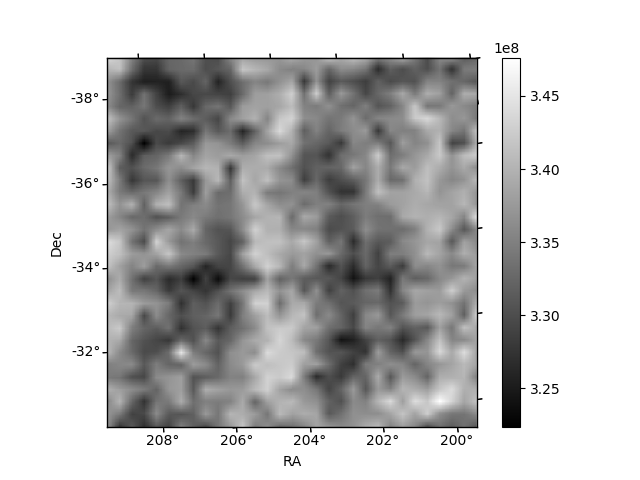
Histogram calculated using DETX and DETY for each event in the final _common_clean file
| Quadrant A | 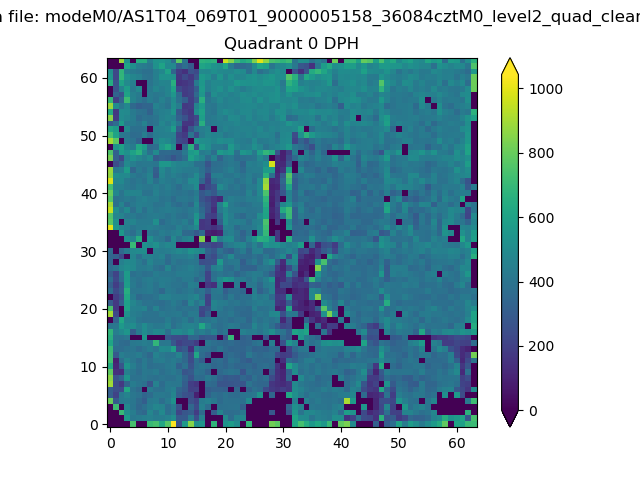 |
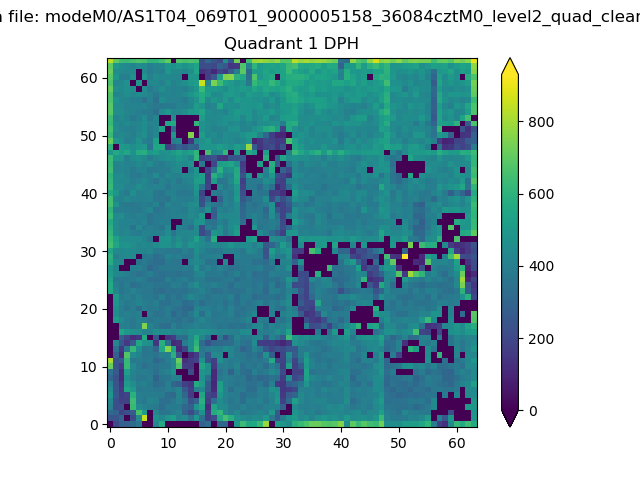 |
Quadrant B |
|---|---|---|---|
| Quadrant D | 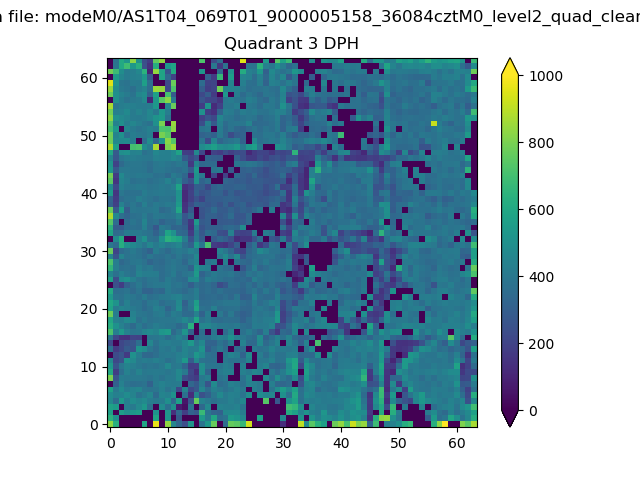 |
 |
Quadrant C |
| Plot type | Count rate plots | Images |
|---|---|---|
| Comparison with Poisson distribution Blue bars denote a histogram of data divided into 1 sec bins. Red curve is a Poisson curve with rate = median count rate of data. |
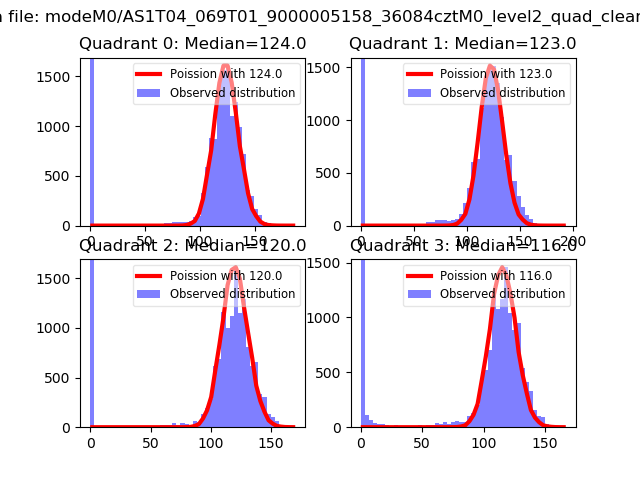 |
 |
| Quadrant-wise count rates Data is divided into 100 sec bins |
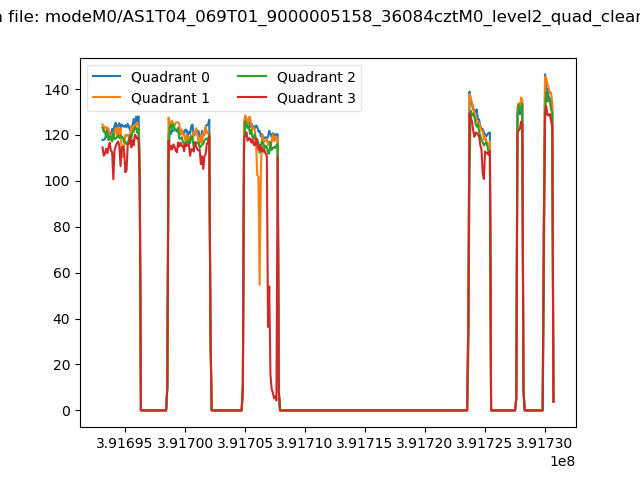 |
|
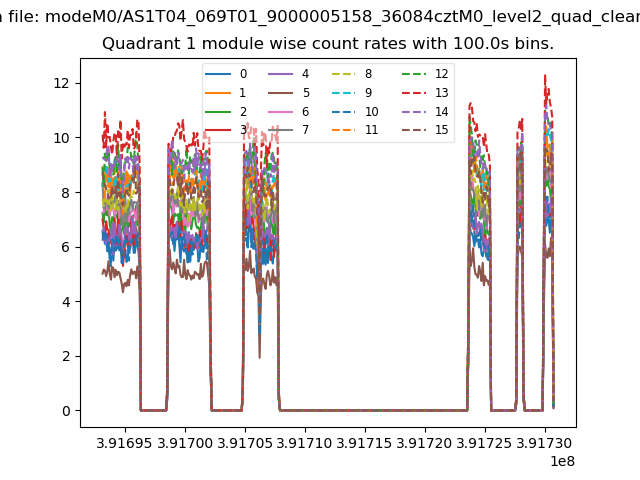
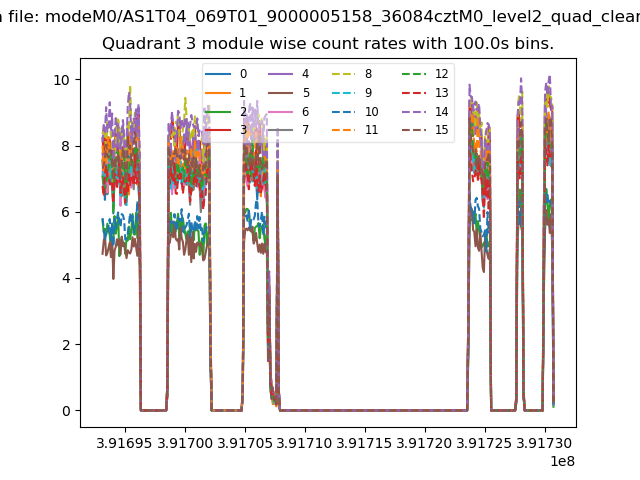
| Module-wise count rates for Quadrant A Data is divided into 100 sec bins |
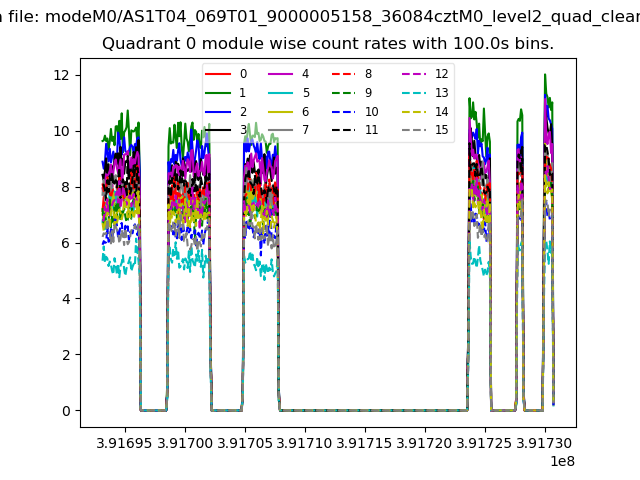 |
 |
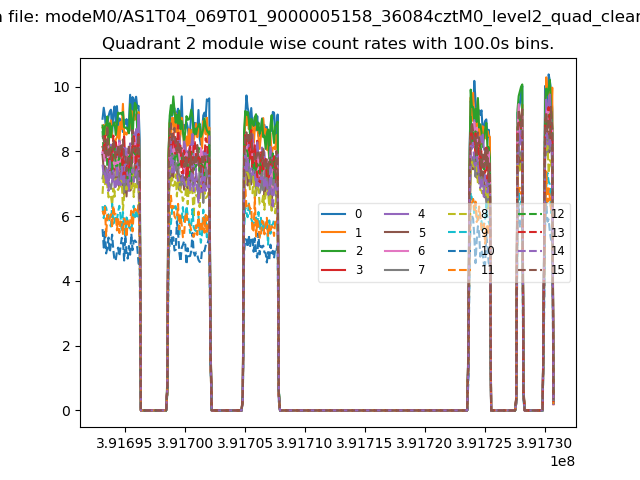
| Module-wise count rates for Quadrant B Data is divided into 100 sec bins |
 |
 |
| Module-wise count rates for Quadrant C Data is divided into 100 sec bins |
 |
 |
| Module-wise count rates for Quadrant D Data is divided into 100 sec bins |
 |
 |
| Parameter | Plot |
|---|---|
| CZT HV Monitor | 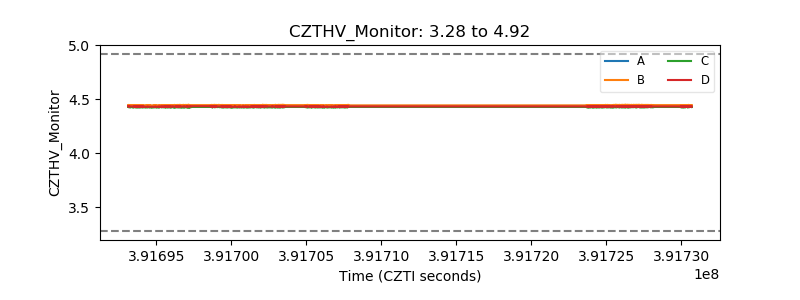 |
| D_VDD | 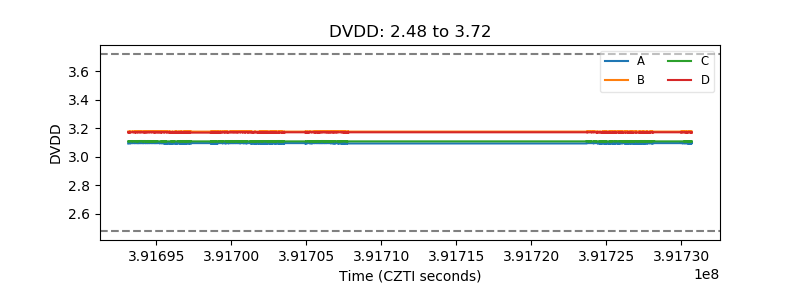 |
| Temperature 1 | 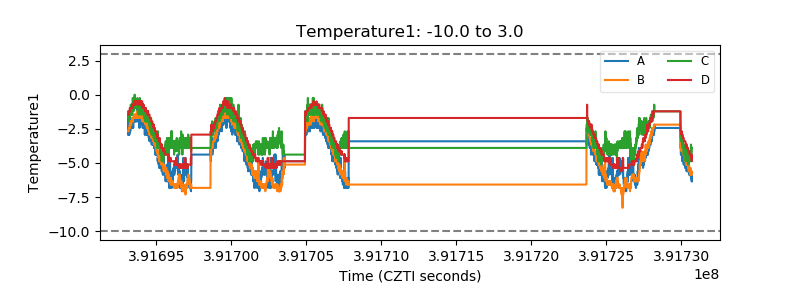 |
| Veto HV Monitor | 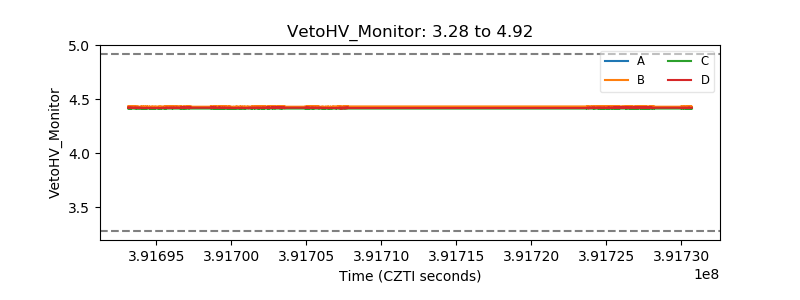 |
| Veto LLD | 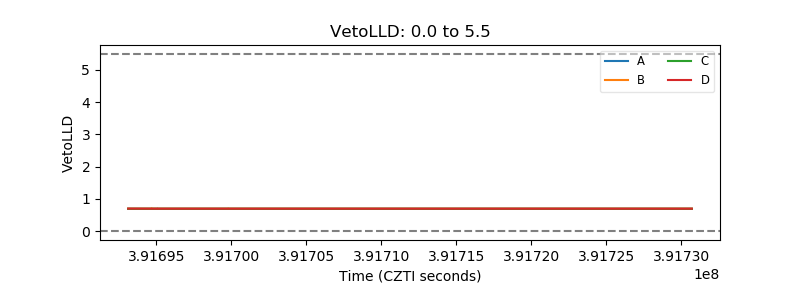 |
| Alpha Counter | 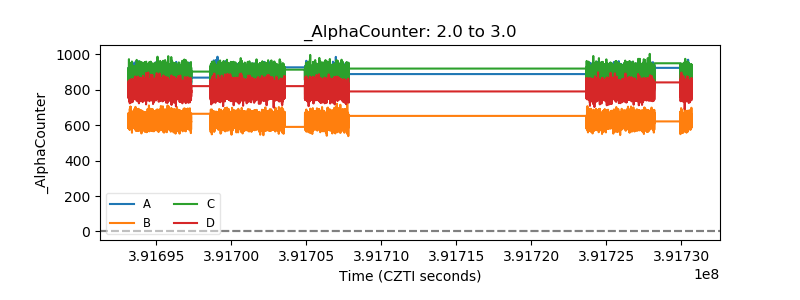 |
| _CPM_Rate | 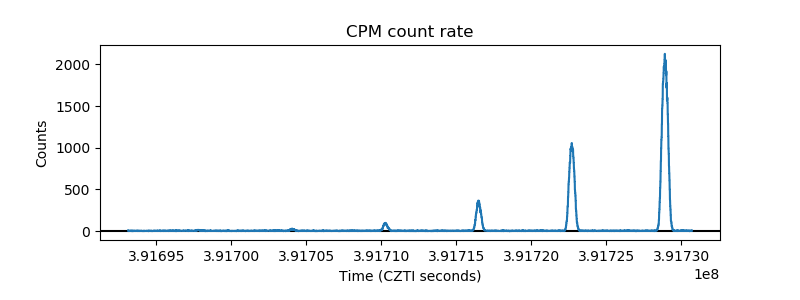 |
| CZT Counter | 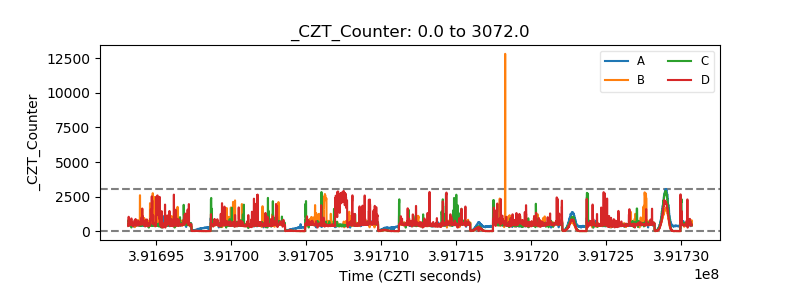 |
| +2.5 Volts monitor | 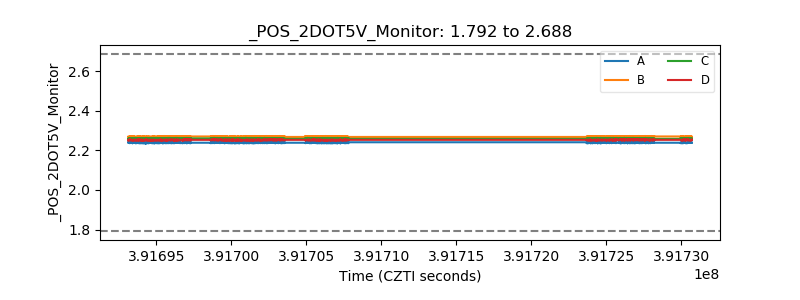 |
| +5 Volts monitor | 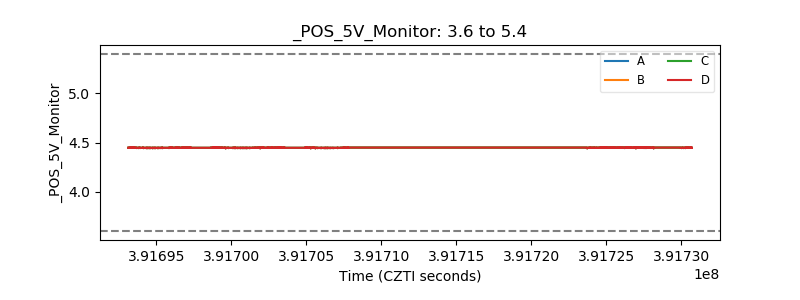 |
| _ROLL_ROT | 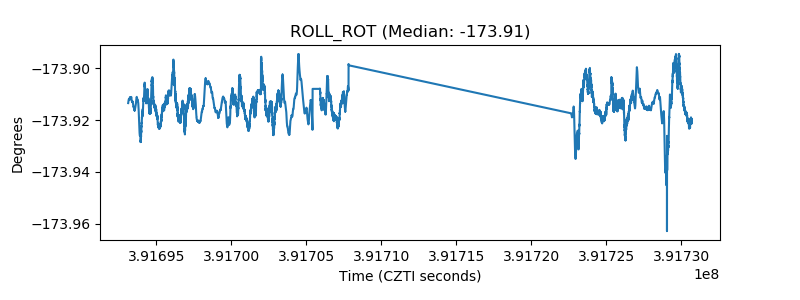 |
| _Roll_DEC | 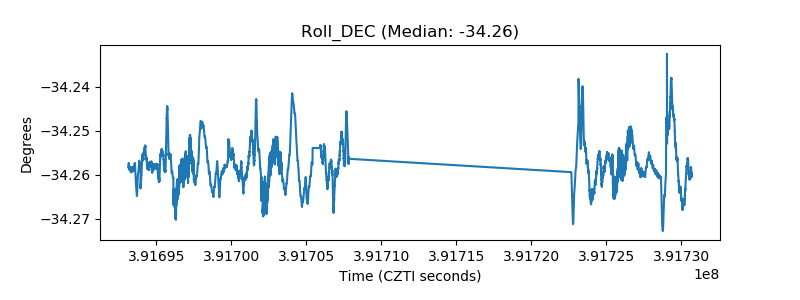 |
| _Roll_RA | 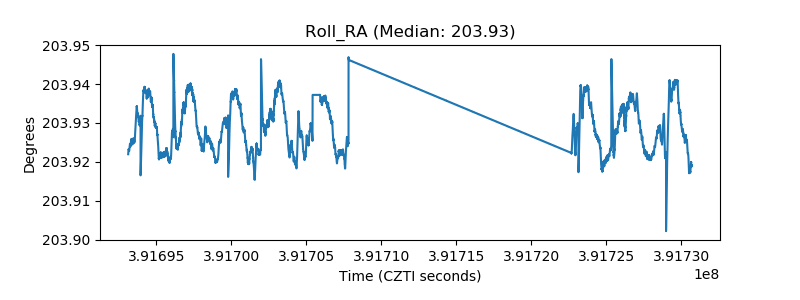 |
| Veto Counter | 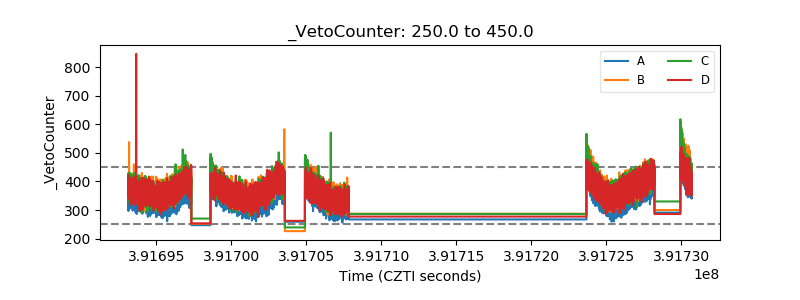 |