| Param | Original file | Final file |
|---|---|---|
| Filename | modeM0/AS1T04_069T01_9000005158_36077cztM0_level2.evt | modeM0/AS1T04_069T01_9000005158_36077cztM0_level2_quad_clean.evt |
| Size (bytes) | 492,670,080 | 78,690,240 |
| Size | 469.8 MB | 75.0 MB |
| Events in quadrant A | 2,738,078 | 521,278 |
| Events in quadrant B | 2,915,142 | 522,570 |
| Events in quadrant C | 2,921,240 | 512,625 |
| Events in quadrant D | 5,960,283 | 428,666 |
| Mode M0 | |||
|---|---|---|---|
| Quadrant | BADHDUFLAG | Total packets | Discarded packets |
| A | 0 | 11736 | 3 |
| B | 0 | 12047 | 2 |
| C | 0 | 12117 | 2 |
| D | 0 | 21492 | 2 |
| Mode M9 | |||
|---|---|---|---|
| Quadrant | BADHDUFLAG | Total packets | Discarded packets |
| A | 0 | 27 | 0 |
| B | 0 | 27 | 0 |
| C | 0 | 27 | 0 |
| D | 0 | 28 | 0 |
| Mode SS | |||
|---|---|---|---|
| Quadrant | BADHDUFLAG | Total packets | Discarded packets |
| A | 0 | 116 | 0 |
| B | 0 | 116 | 0 |
| C | 0 | 116 | 0 |
| D | 0 | 116 | 0 |
| Quadrant | Total seconds | Saturated seconds | Saturation percentage |
|---|---|---|---|
| A | 5682 | 10 | 0.175994% |
| B | 5682 | 29 | 0.510384% |
| C | 5682 | 13 | 0.228793% |
| D | 5682 | 1075 | 18.919395% |
Noise dominated data is calculated using 1-second bins in cleaned event files. If a bin has >2000 counts, and if more than 50% of those come from <1% of pixels, then it is considered to be noise-dominated and hence unusable.
| Quadrant | # 1 sec bins | Bins with >0 counts | Bins with >2000 counts | High rate bins dominated by noise | Noise dominated (total time) | Noise dominated (detector-on time) | Marked lightcurve |
|---|---|---|---|---|---|---|---|
| A | 7114 | 5683 | 1 | 1 | 0.01% | 0.02% | 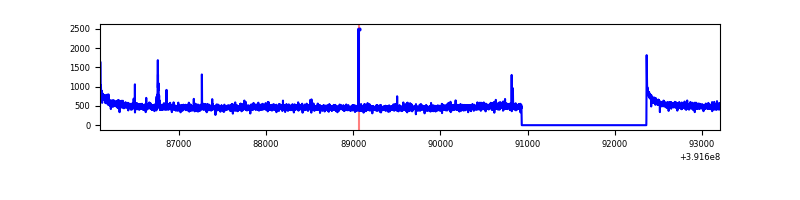 |
| B | 7114 | 5683 | 10 | 10 | 0.14% | 0.18% | 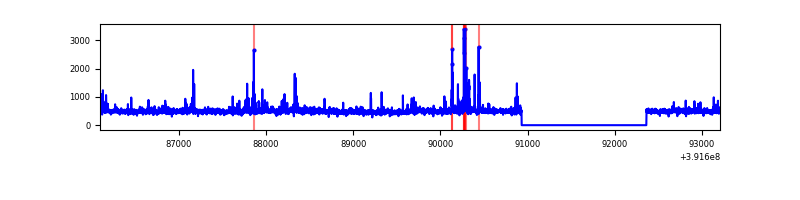 |
| C | 7114 | 5683 | 7 | 7 | 0.10% | 0.12% | 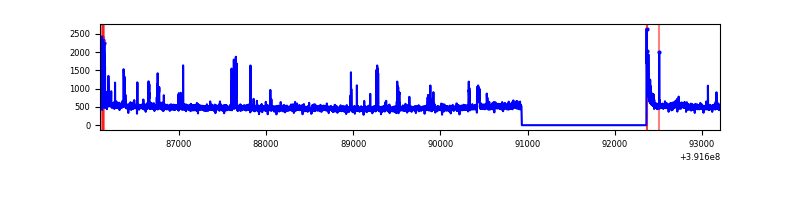 |
| D | 7114 | 5683 | 951 | 951 | 13.37% | 16.73% | 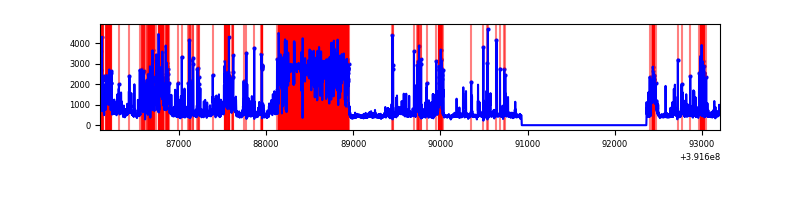 |
Top three noisy pixels from each quadrant. If the there are fewer than three noisy pixels in the level2.evt file, extra rows are filled as -1
| Pixel properties | Quadrant properties | ||||||
|---|---|---|---|---|---|---|---|
| Quadrant | DetID | PixID | Counts | Sigma | Mean | Median | Sigma |
| A | 10 | 83 | 179473 | 1354.18 | 652 | 639 | 132.1 |
| A | 9 | 143 | 20265 | 148.61 | 652 | 639 | 132.1 |
| A | 13 | 6 | 14583 | 105.59 | 652 | 639 | 132.1 |
| B | 0 | 190 | 90887 | 716.67 | 646 | 628 | 125.9 |
| B | 5 | 172 | 90752 | 715.6 | 646 | 628 | 125.9 |
| B | 5 | 255 | 67374 | 529.97 | 646 | 628 | 125.9 |
| C | 15 | 214 | 240133 | 1617.79 | 629 | 631 | 148.0 |
| C | 0 | 207 | 118426 | 795.68 | 629 | 631 | 148.0 |
| C | 0 | 10 | 74641 | 499.92 | 629 | 631 | 148.0 |
| D | 12 | 227 | 2711313 | 19206.01 | 574 | 558 | 141.1 |
| D | 12 | 6 | 369838 | 2616.39 | 574 | 558 | 141.1 |
| D | 1 | 52 | 327973 | 2319.77 | 574 | 558 | 141.1 |
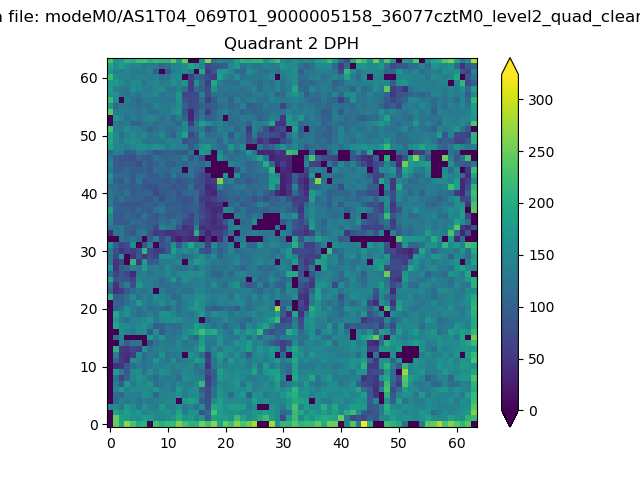
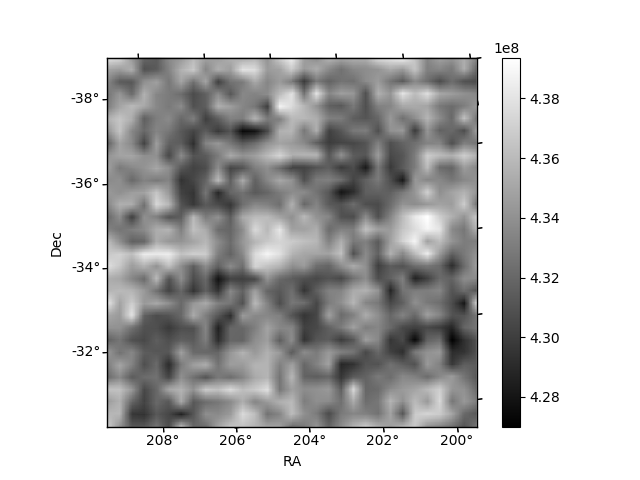
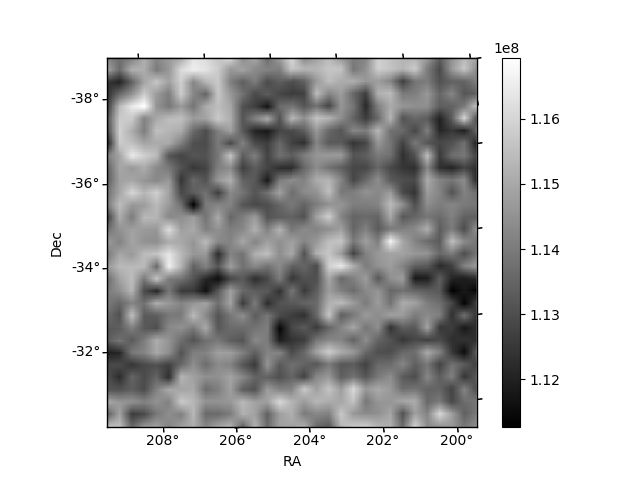
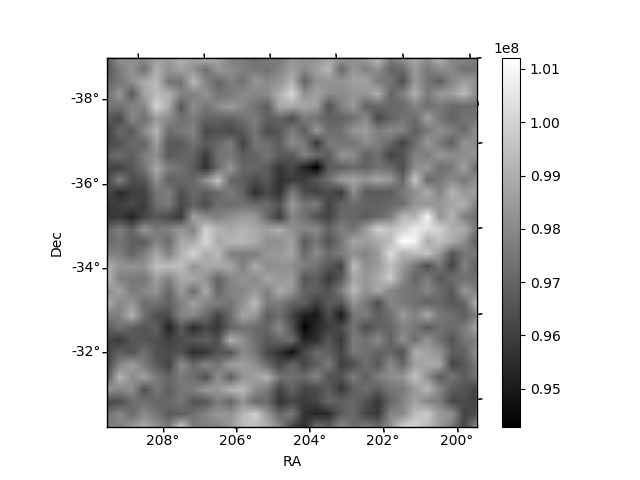
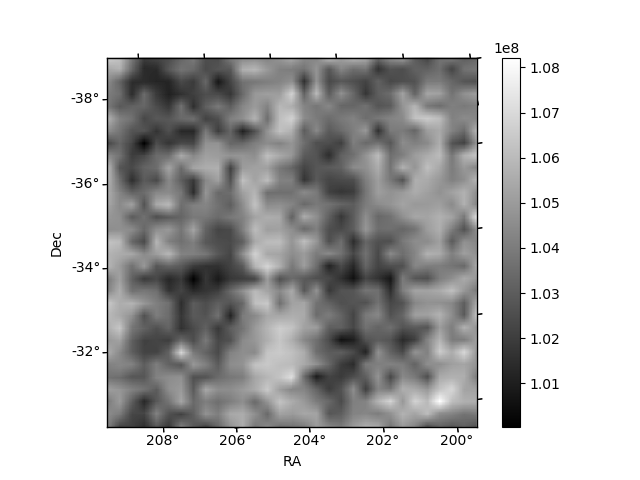
Histogram calculated using DETX and DETY for each event in the final _common_clean file
| Quadrant A | 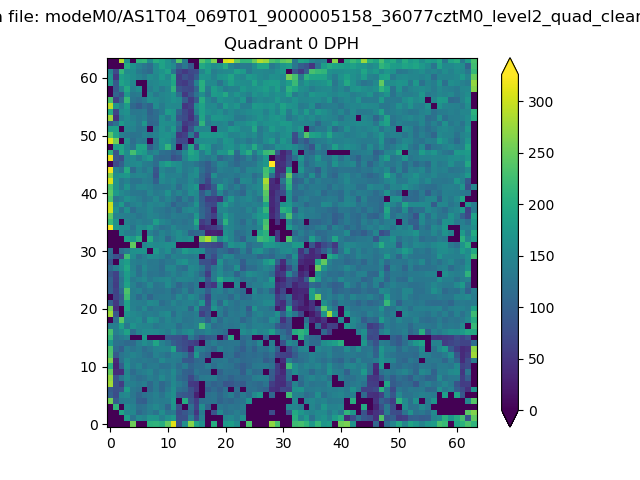 |
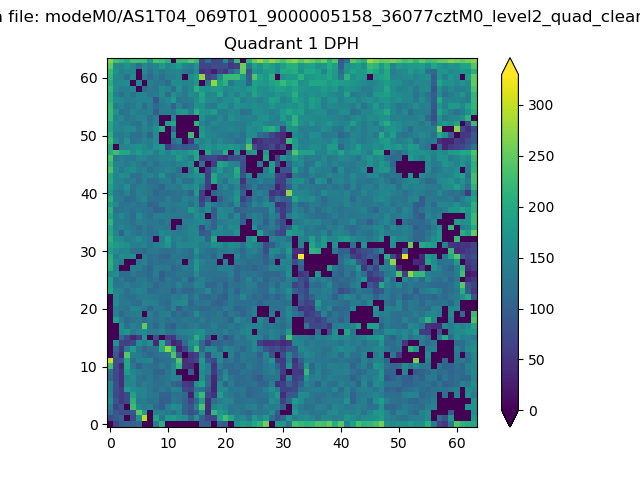 |
Quadrant B |
|---|---|---|---|
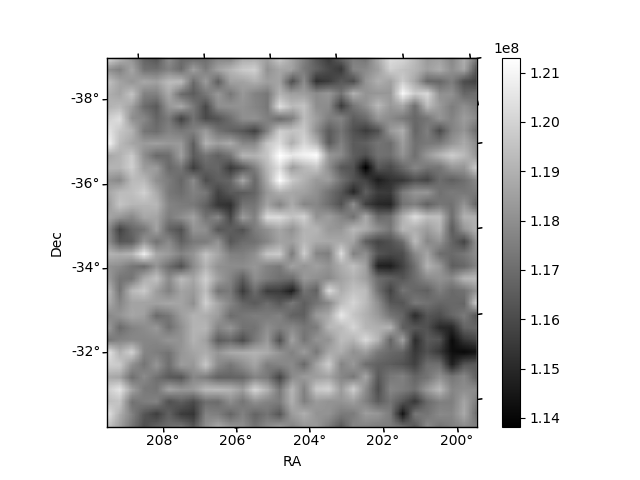
| Quadrant D | 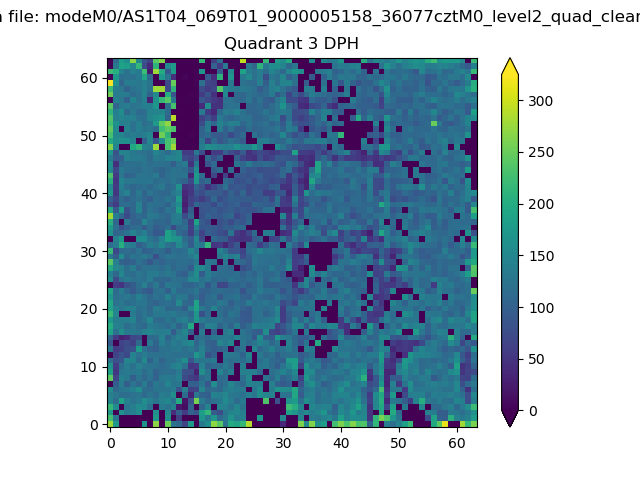 |
 |
Quadrant C |
| Plot type | Count rate plots | Images |
|---|---|---|
| Comparison with Poisson distribution Blue bars denote a histogram of data divided into 1 sec bins. Red curve is a Poisson curve with rate = median count rate of data. |
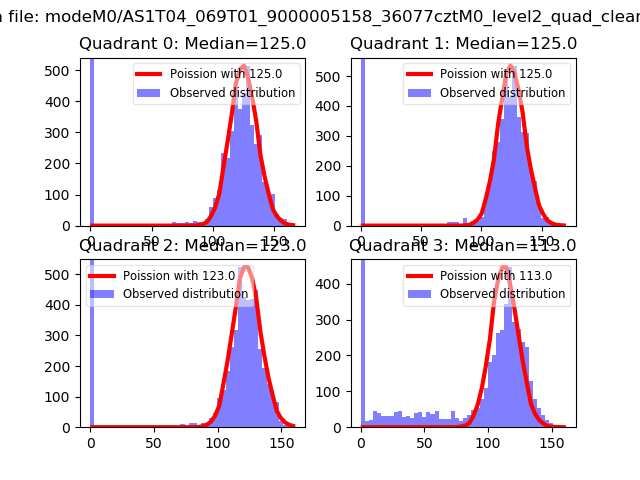 |
 |
| Quadrant-wise count rates Data is divided into 100 sec bins |
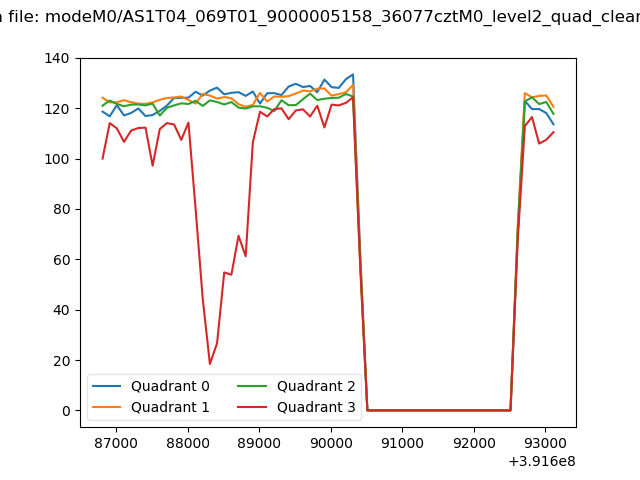 |
|
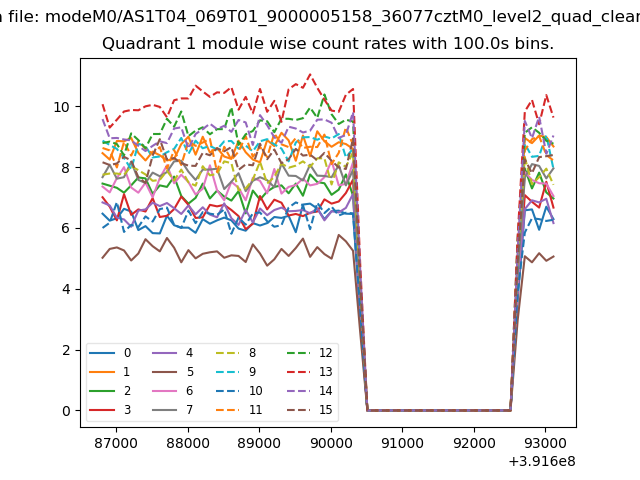
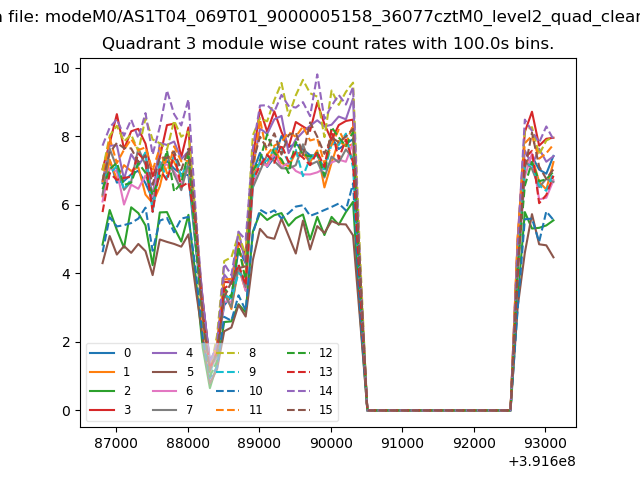
| Module-wise count rates for Quadrant A Data is divided into 100 sec bins |
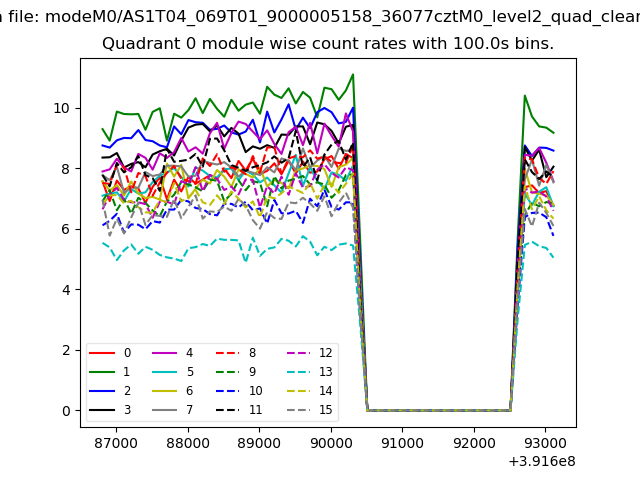 |
 |
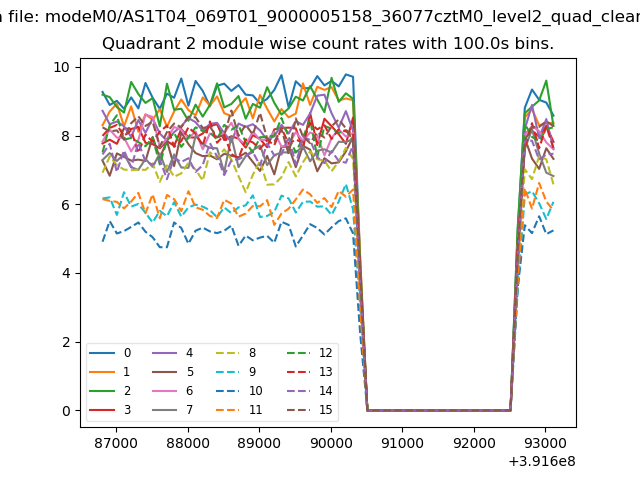
| Module-wise count rates for Quadrant B Data is divided into 100 sec bins |
 |
 |
| Module-wise count rates for Quadrant C Data is divided into 100 sec bins |
 |
 |
| Module-wise count rates for Quadrant D Data is divided into 100 sec bins |
 |
 |
| Parameter | Plot |
|---|---|
| CZT HV Monitor | 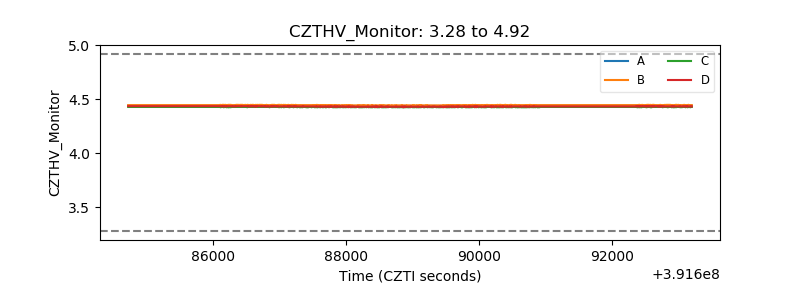 |
| D_VDD | 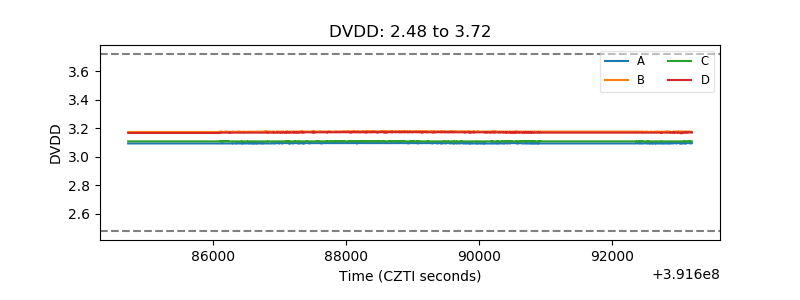 |
| Temperature 1 | 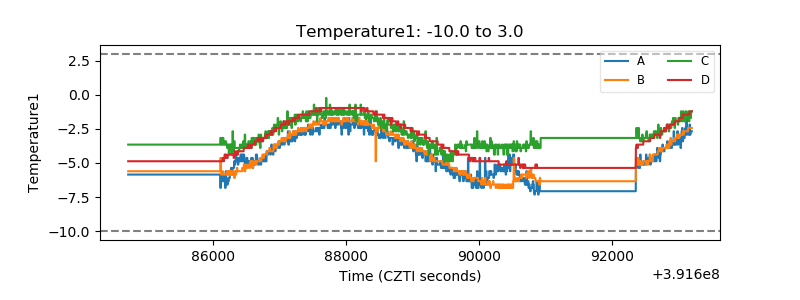 |
| Veto HV Monitor | 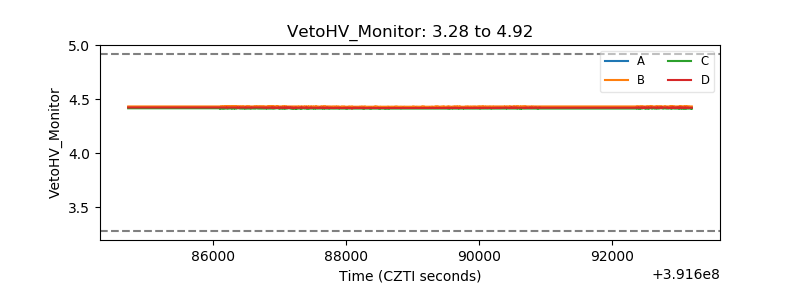 |
| Veto LLD | 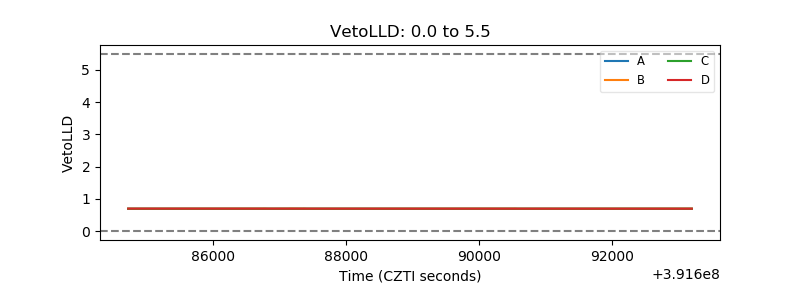 |
| Alpha Counter | 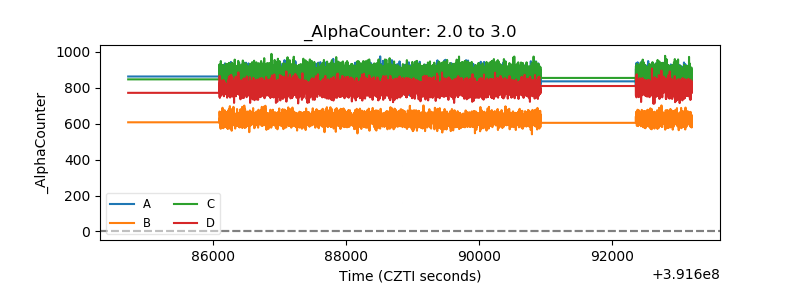 |
| _CPM_Rate | 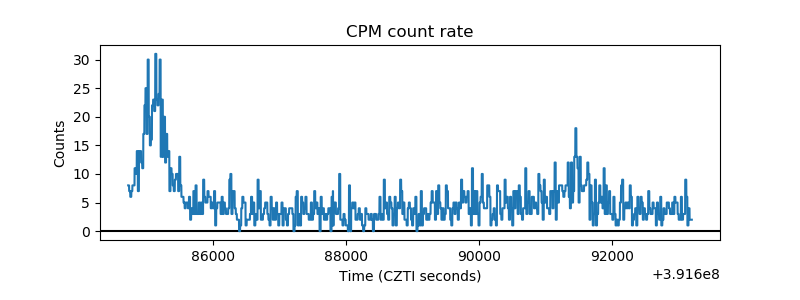 |
| CZT Counter | 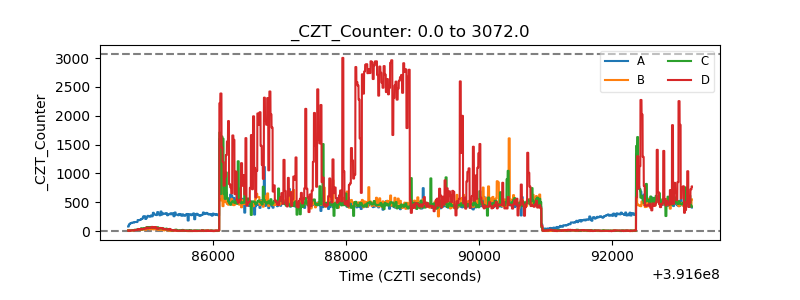 |
| +2.5 Volts monitor | 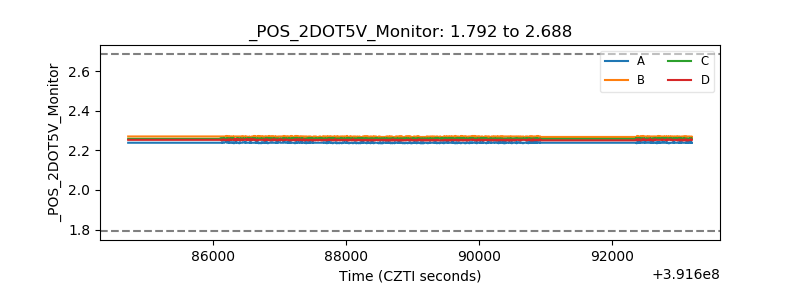 |
| +5 Volts monitor | 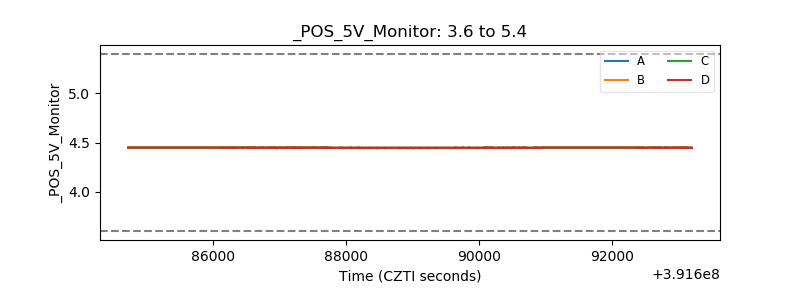 |
| _ROLL_ROT | 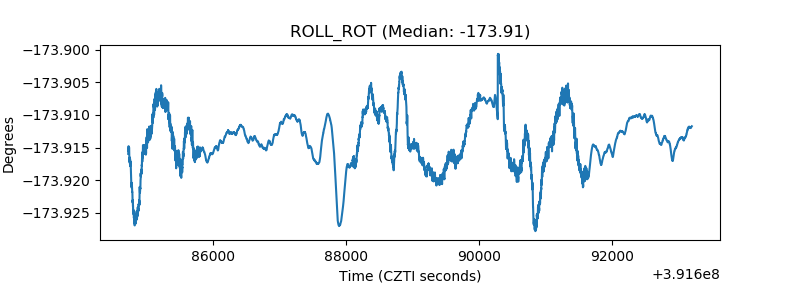 |
| _Roll_DEC | 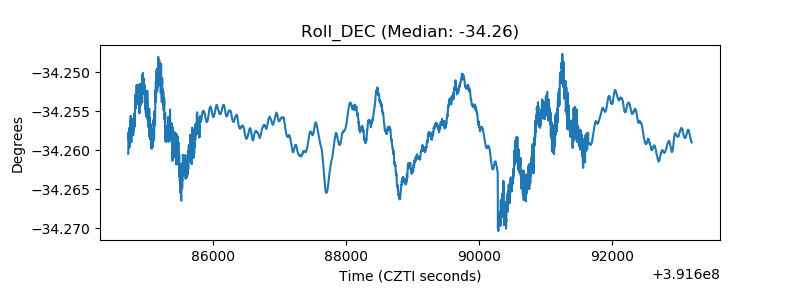 |
| _Roll_RA | 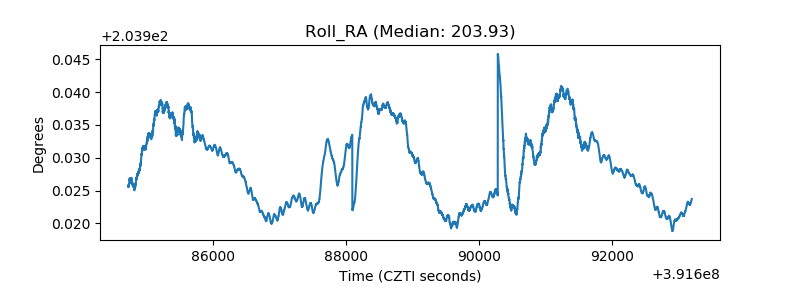 |
| Veto Counter | 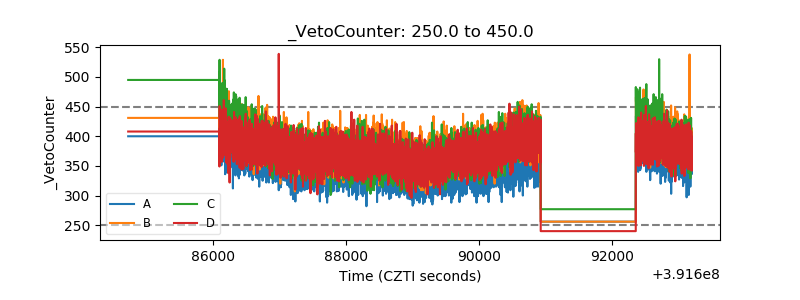 |