| Param | Original file | Final file |
|---|---|---|
| Filename | modeM0/AS1T04_069T01_9000005158_36076cztM0_level2.evt | modeM0/AS1T04_069T01_9000005158_36076cztM0_level2_quad_clean.evt |
| Size (bytes) | 483,894,720 | 75,911,040 |
| Size | 461.5 MB | 72.4 MB |
| Events in quadrant A | 2,788,412 | 496,759 |
| Events in quadrant B | 2,920,171 | 497,050 |
| Events in quadrant C | 4,192,045 | 445,546 |
| Events in quadrant D | 4,363,389 | 456,565 |
| Mode M0 | |||
|---|---|---|---|
| Quadrant | BADHDUFLAG | Total packets | Discarded packets |
| A | 0 | 11859 | 3 |
| B | 0 | 12117 | 2 |
| C | 0 | 15936 | 2 |
| D | 0 | 16778 | 2 |
| Mode M9 | |||
|---|---|---|---|
| Quadrant | BADHDUFLAG | Total packets | Discarded packets |
| A | 0 | 38 | 0 |
| B | 0 | 38 | 0 |
| C | 0 | 38 | 0 |
| D | 0 | 38 | 0 |
| Mode SS | |||
|---|---|---|---|
| Quadrant | BADHDUFLAG | Total packets | Discarded packets |
| A | 0 | 120 | 0 |
| B | 0 | 120 | 0 |
| C | 0 | 120 | 0 |
| D | 0 | 120 | 0 |
| Quadrant | Total seconds | Saturated seconds | Saturation percentage |
|---|---|---|---|
| A | 5751 | 10 | 0.173883% |
| B | 5751 | 24 | 0.417319% |
| C | 5751 | 601 | 10.450356% |
| D | 5751 | 358 | 6.225004% |
Noise dominated data is calculated using 1-second bins in cleaned event files. If a bin has >2000 counts, and if more than 50% of those come from <1% of pixels, then it is considered to be noise-dominated and hence unusable.
| Quadrant | # 1 sec bins | Bins with >0 counts | Bins with >2000 counts | High rate bins dominated by noise | Noise dominated (total time) | Noise dominated (detector-on time) | Marked lightcurve |
|---|---|---|---|---|---|---|---|
| A | 9516 | 5753 | 0 | 0 | 0.00% | 0.00% | 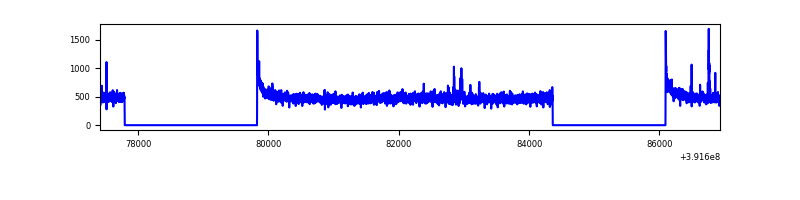 |
| B | 9516 | 5753 | 12 | 12 | 0.13% | 0.21% | 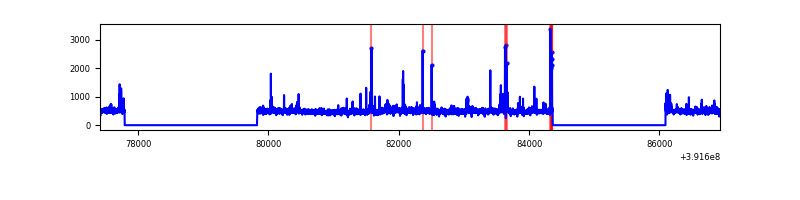 |
| C | 9516 | 5753 | 482 | 482 | 5.07% | 8.38% | 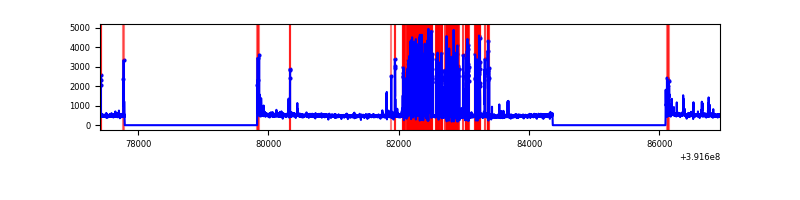 |
| D | 9516 | 5753 | 290 | 290 | 3.05% | 5.04% | 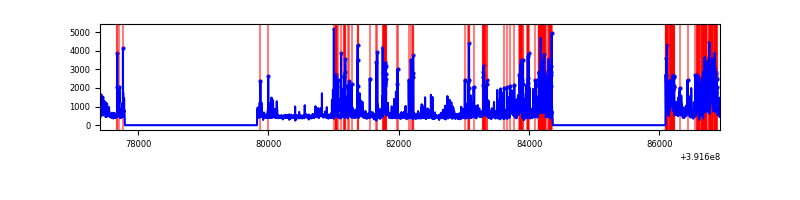 |
Top three noisy pixels from each quadrant. If the there are fewer than three noisy pixels in the level2.evt file, extra rows are filled as -1
| Pixel properties | Quadrant properties | ||||||
|---|---|---|---|---|---|---|---|
| Quadrant | DetID | PixID | Counts | Sigma | Mean | Median | Sigma |
| A | 10 | 83 | 185396 | 1378.41 | 663 | 652 | 134.0 |
| A | 9 | 143 | 27333 | 199.07 | 663 | 652 | 134.0 |
| A | 13 | 254 | 9343 | 64.85 | 663 | 652 | 134.0 |
| B | 0 | 190 | 104176 | 813.15 | 658 | 640 | 127.3 |
| B | 5 | 255 | 77581 | 604.28 | 658 | 640 | 127.3 |
| B | 0 | 229 | 55455 | 430.51 | 658 | 640 | 127.3 |
| C | 15 | 208 | 1474411 | 10305.72 | 611 | 612 | 143.0 |
| C | 15 | 214 | 231721 | 1616.06 | 611 | 612 | 143.0 |
| C | 0 | 10 | 78554 | 545.02 | 611 | 612 | 143.0 |
| D | 12 | 227 | 840033 | 5453.01 | 627 | 611 | 153.9 |
| D | 1 | 52 | 358479 | 2324.76 | 627 | 611 | 153.9 |
| D | 12 | 17 | 249387 | 1616.08 | 627 | 611 | 153.9 |
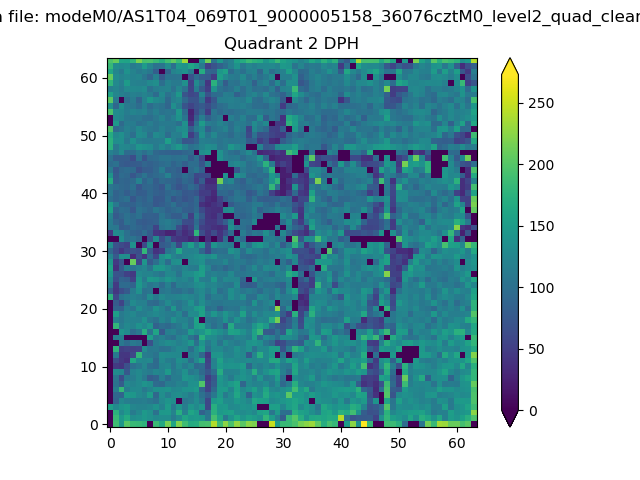
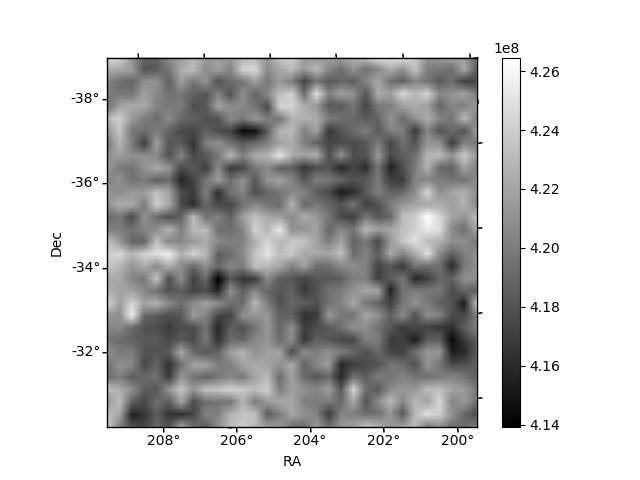
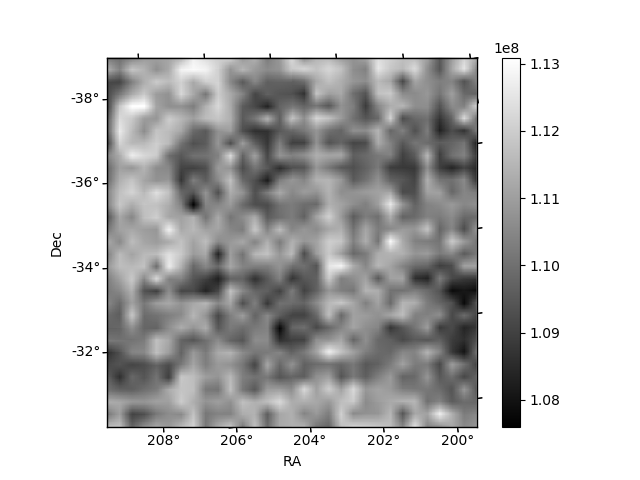
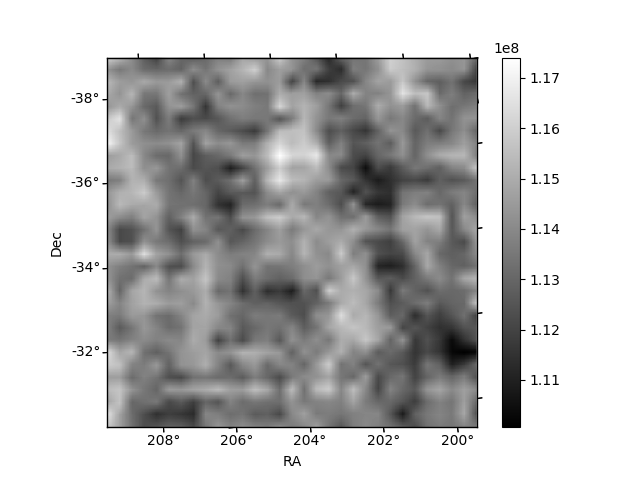
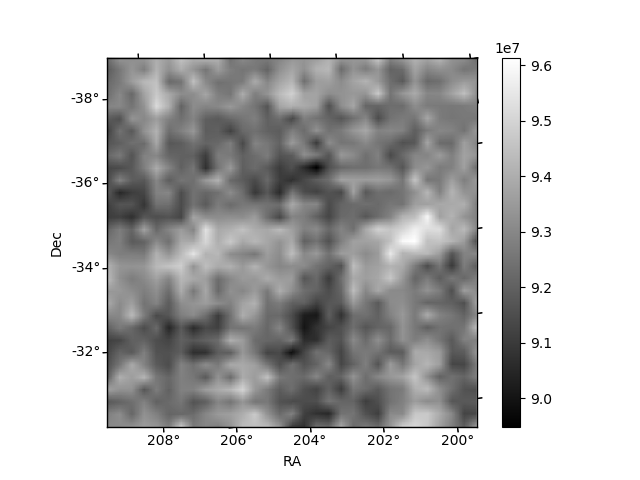
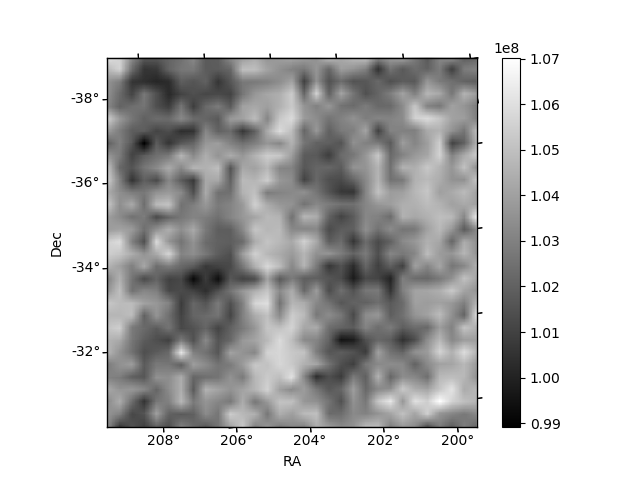
Histogram calculated using DETX and DETY for each event in the final _common_clean file
| Quadrant A | 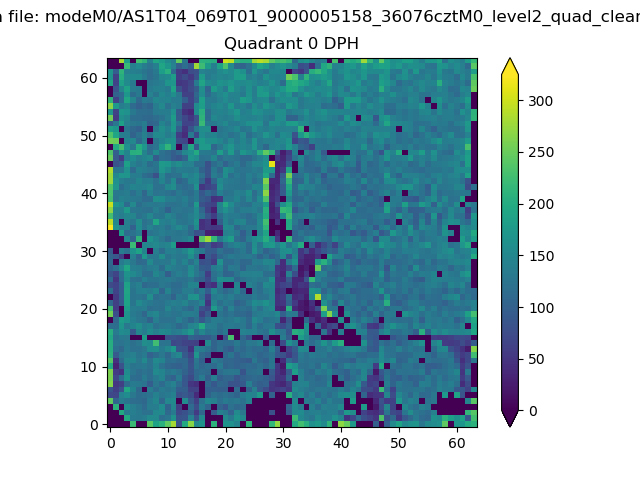 |
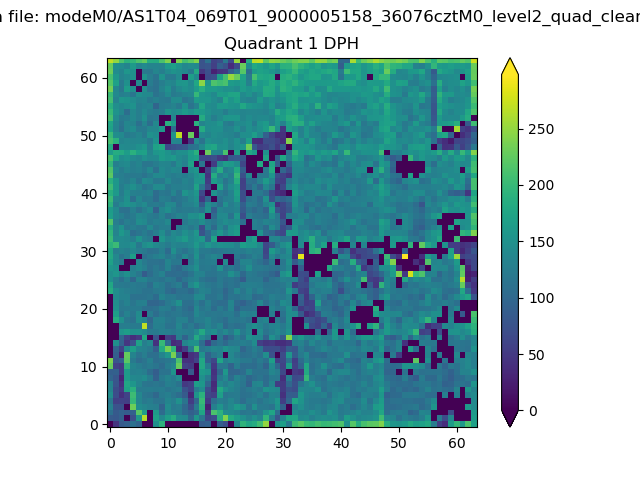 |
Quadrant B |
|---|---|---|---|
| Quadrant D | 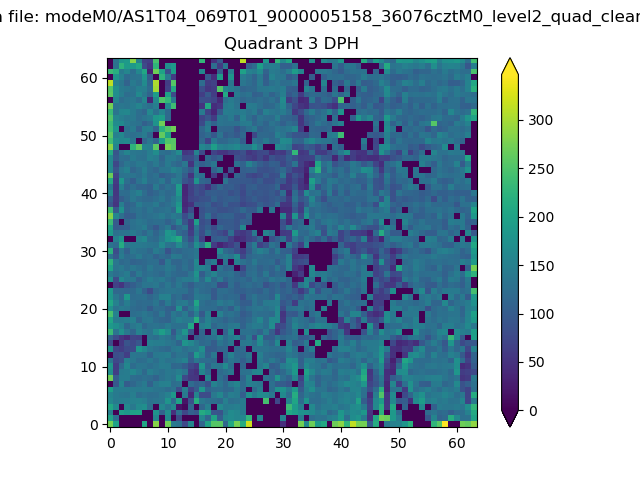 |
 |
Quadrant C |
| Plot type | Count rate plots | Images |
|---|---|---|
| Comparison with Poisson distribution Blue bars denote a histogram of data divided into 1 sec bins. Red curve is a Poisson curve with rate = median count rate of data. |
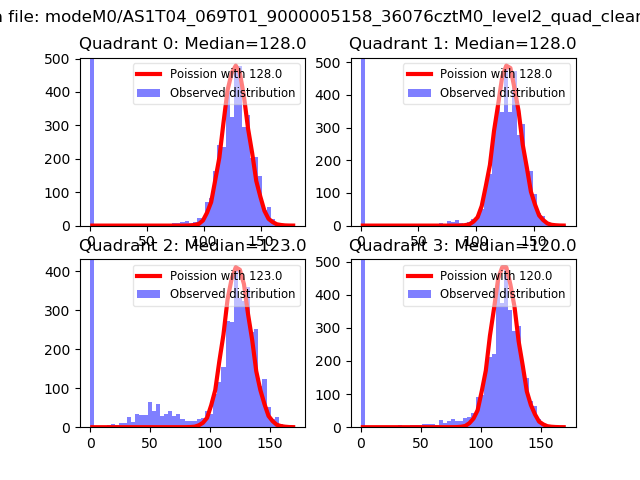 |
 |
| Quadrant-wise count rates Data is divided into 100 sec bins |
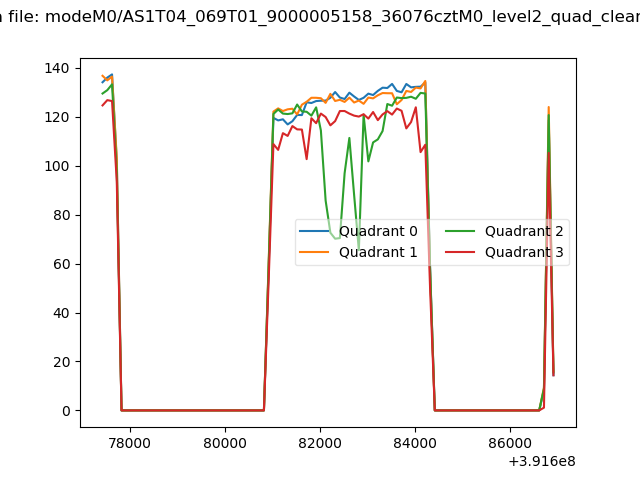 |
|
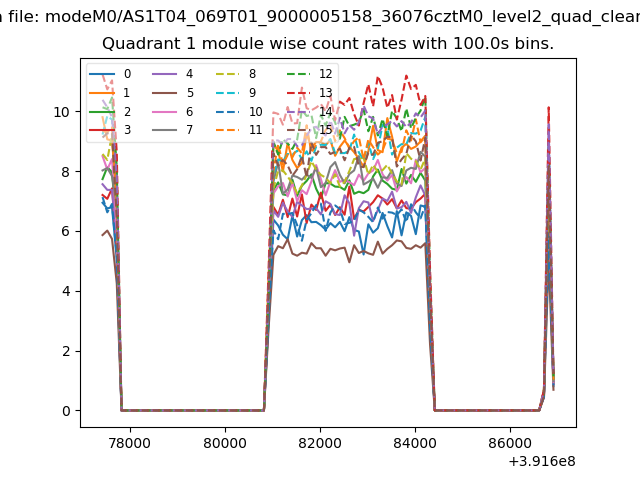
| Module-wise count rates for Quadrant A Data is divided into 100 sec bins |
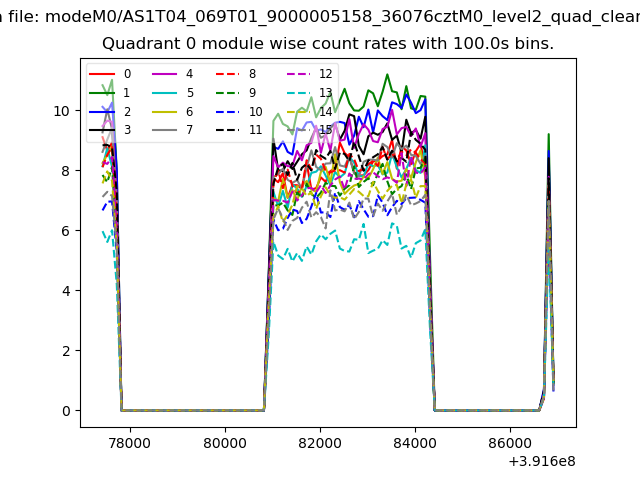 |
 |
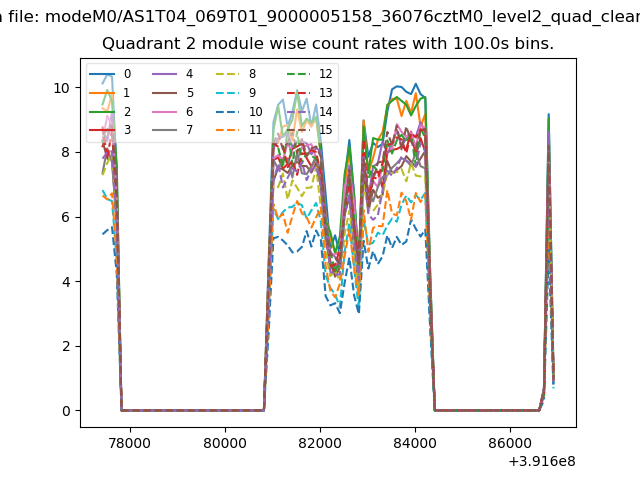
| Module-wise count rates for Quadrant B Data is divided into 100 sec bins |
 |
 |
| Module-wise count rates for Quadrant C Data is divided into 100 sec bins |
 |
 |
| Module-wise count rates for Quadrant D Data is divided into 100 sec bins |
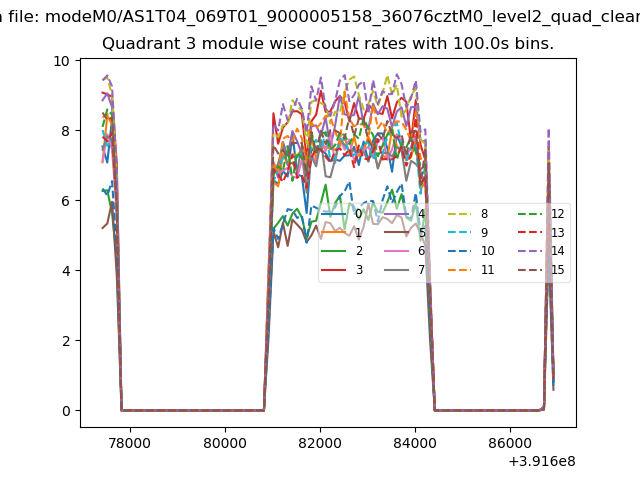 |
 |
| Parameter | Plot |
|---|---|
| CZT HV Monitor | 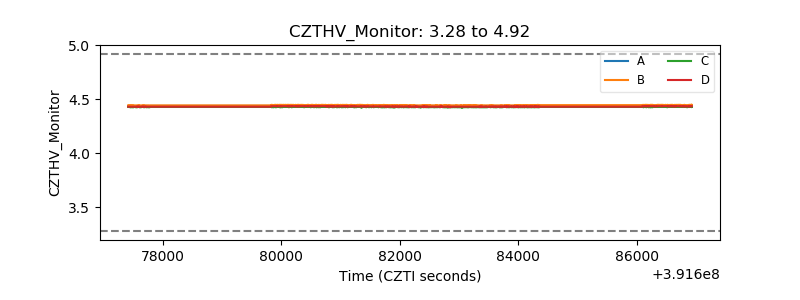 |
| D_VDD | 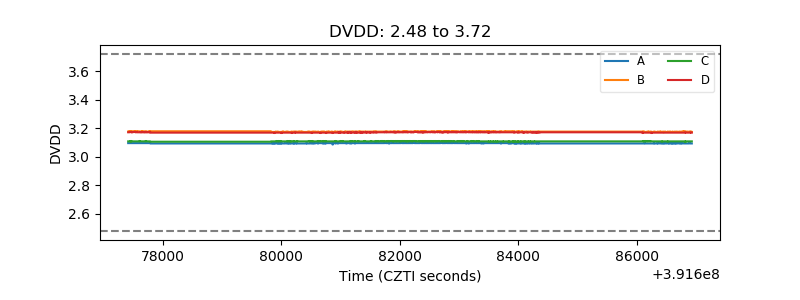 |
| Temperature 1 | 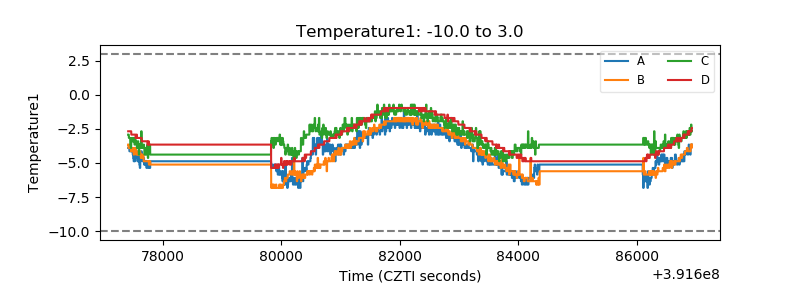 |
| Veto HV Monitor | 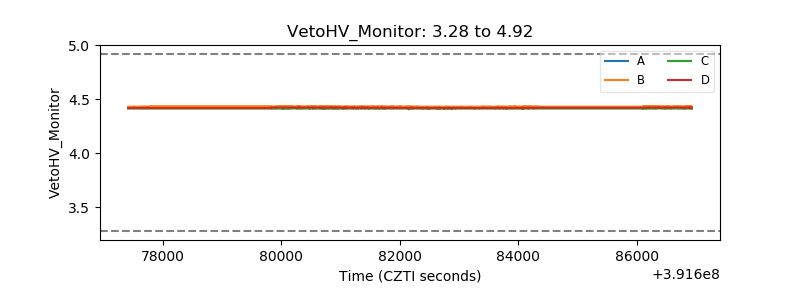 |
| Veto LLD | 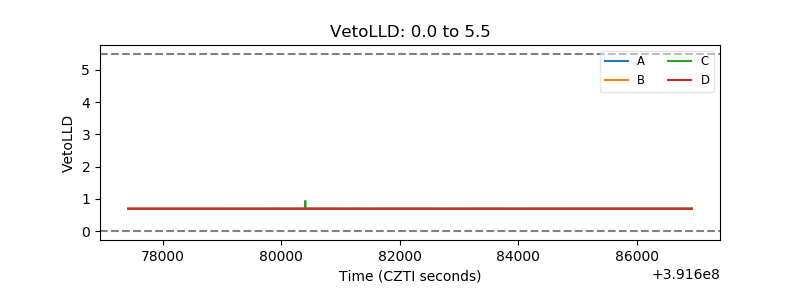 |
| Alpha Counter | 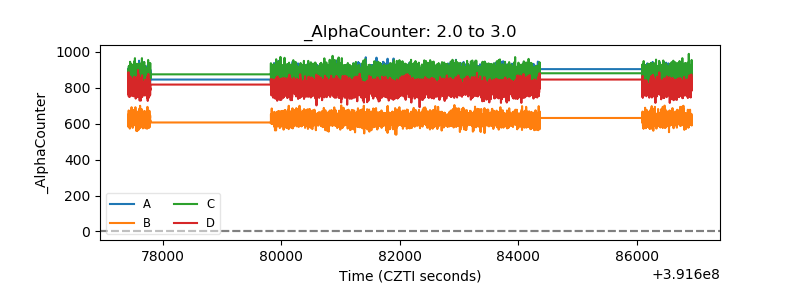 |
| _CPM_Rate | 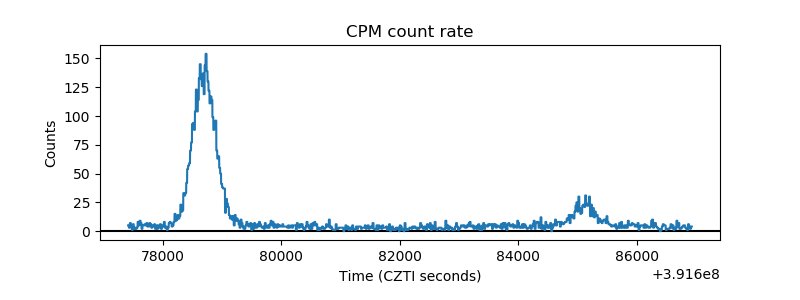 |
| CZT Counter | 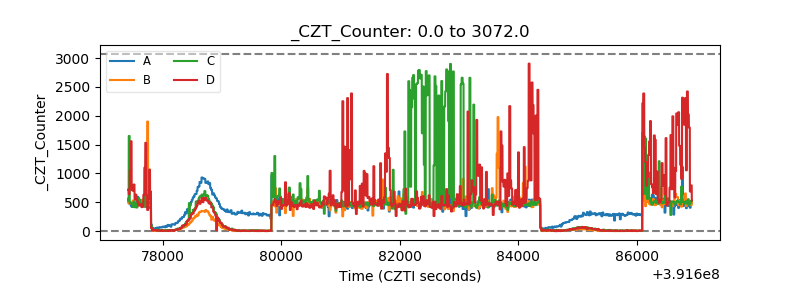 |
| +2.5 Volts monitor | 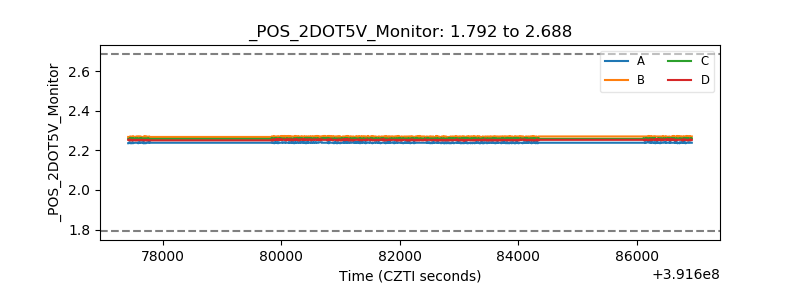 |
| +5 Volts monitor | 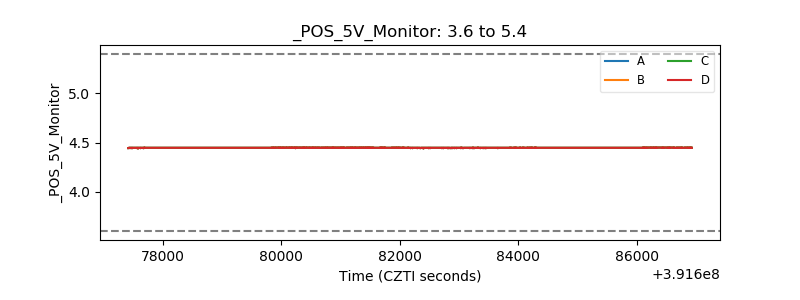 |
| _ROLL_ROT | 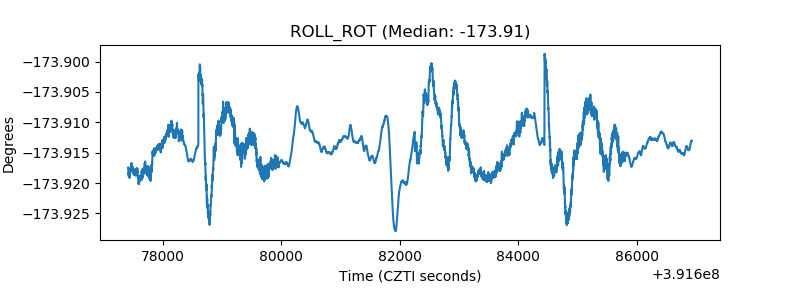 |
| _Roll_DEC | 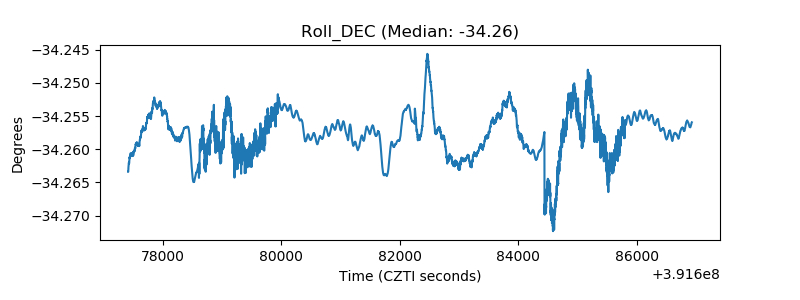 |
| _Roll_RA | 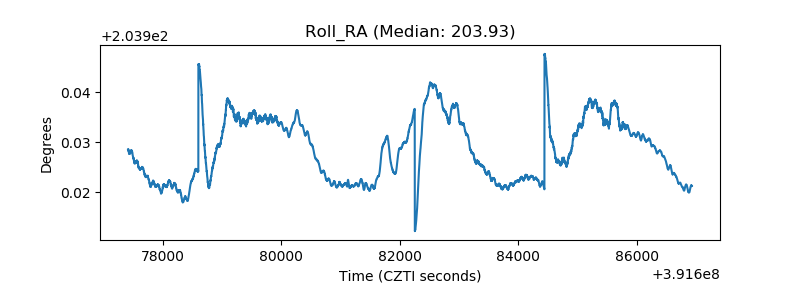 |
| Veto Counter | 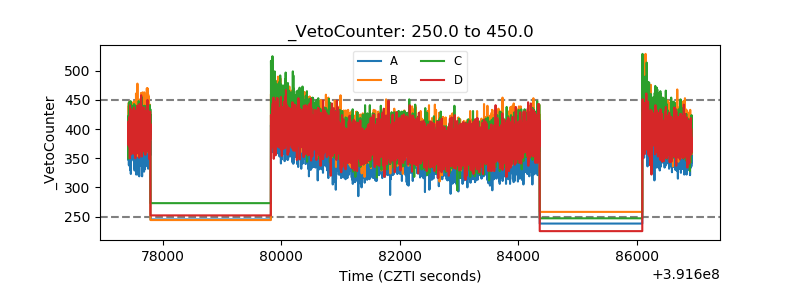 |