| Param | Original file | Final file |
|---|---|---|
| Filename | modeM0/AS1T04_069T01_9000005158_36075cztM0_level2.evt | modeM0/AS1T04_069T01_9000005158_36075cztM0_level2_quad_clean.evt |
| Size (bytes) | 408,263,040 | 56,482,560 |
| Size | 389.3 MB | 53.9 MB |
| Events in quadrant A | 3,057,790 | 344,092 |
| Events in quadrant B | 2,597,817 | 351,910 |
| Events in quadrant C | 2,666,554 | 344,576 |
| Events in quadrant D | 3,698,409 | 314,789 |
| Mode M0 | |||
|---|---|---|---|
| Quadrant | BADHDUFLAG | Total packets | Discarded packets |
| A | 0 | 12298 | 3 |
| B | 0 | 10789 | 2 |
| C | 0 | 10785 | 2 |
| D | 0 | 14366 | 2 |
| Mode M9 | |||
|---|---|---|---|
| Quadrant | BADHDUFLAG | Total packets | Discarded packets |
| A | 0 | 33 | 0 |
| B | 0 | 33 | 0 |
| C | 0 | 33 | 0 |
| D | 0 | 34 | 0 |
| Mode SS | |||
|---|---|---|---|
| Quadrant | BADHDUFLAG | Total packets | Discarded packets |
| A | 0 | 102 | 0 |
| B | 0 | 102 | 0 |
| C | 0 | 102 | 0 |
| D | 0 | 102 | 0 |
| Quadrant | Total seconds | Saturated seconds | Saturation percentage |
|---|---|---|---|
| A | 5061 | 87 | 1.719028% |
| B | 5061 | 32 | 0.632286% |
| C | 5061 | 29 | 0.573009% |
| D | 5061 | 248 | 4.900217% |
Noise dominated data is calculated using 1-second bins in cleaned event files. If a bin has >2000 counts, and if more than 50% of those come from <1% of pixels, then it is considered to be noise-dominated and hence unusable.
| Quadrant | # 1 sec bins | Bins with >0 counts | Bins with >2000 counts | High rate bins dominated by noise | Noise dominated (total time) | Noise dominated (detector-on time) | Marked lightcurve |
|---|---|---|---|---|---|---|---|
| A | 7094 | 5062 | 72 | 72 | 1.01% | 1.42% | 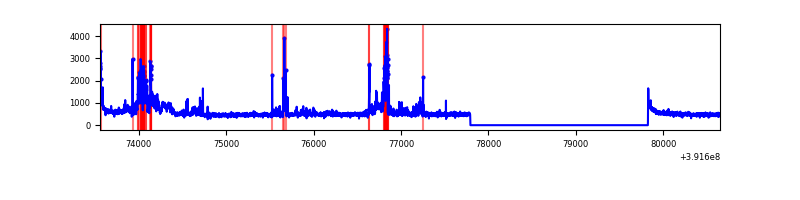 |
| B | 7094 | 5062 | 24 | 24 | 0.34% | 0.47% | 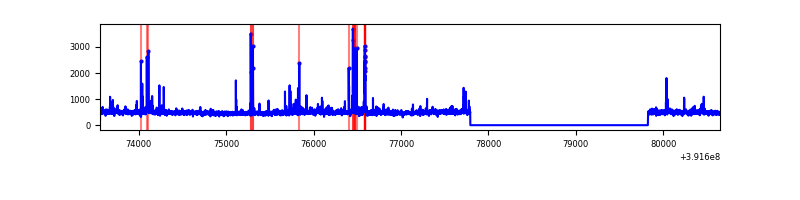 |
| C | 7094 | 5062 | 23 | 23 | 0.32% | 0.45% | 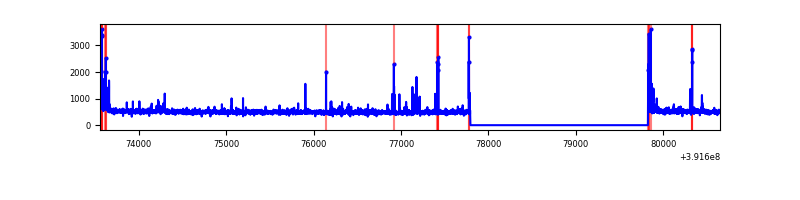 |
| D | 7094 | 5062 | 226 | 226 | 3.19% | 4.46% | 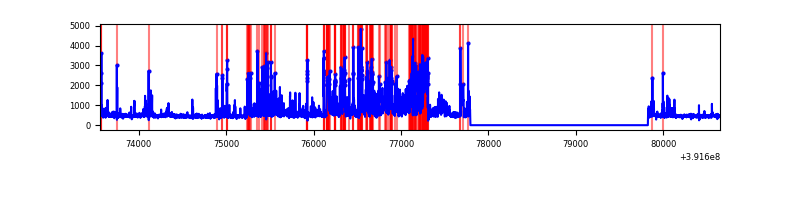 |
Top three noisy pixels from each quadrant. If the there are fewer than three noisy pixels in the level2.evt file, extra rows are filled as -1
| Pixel properties | Quadrant properties | ||||||
|---|---|---|---|---|---|---|---|
| Quadrant | DetID | PixID | Counts | Sigma | Mean | Median | Sigma |
| A | 0 | 8 | 382775 | 3186.32 | 592 | 580 | 119.9 |
| A | 9 | 143 | 195666 | 1626.41 | 592 | 580 | 119.9 |
| A | 10 | 83 | 164741 | 1368.59 | 592 | 580 | 119.9 |
| B | 5 | 255 | 140669 | 1228.26 | 591 | 576 | 114.1 |
| B | 0 | 190 | 50226 | 435.3 | 591 | 576 | 114.1 |
| B | 5 | 172 | 37901 | 327.25 | 591 | 576 | 114.1 |
| C | 15 | 214 | 214410 | 1582.81 | 580 | 584 | 135.1 |
| C | 0 | 10 | 93146 | 685.18 | 580 | 584 | 135.1 |
| C | 15 | 208 | 88524 | 650.96 | 580 | 584 | 135.1 |
| D | 12 | 227 | 605324 | 4395.61 | 568 | 553 | 137.6 |
| D | 1 | 52 | 264987 | 1921.96 | 568 | 553 | 137.6 |
| D | 12 | 17 | 131569 | 952.25 | 568 | 553 | 137.6 |
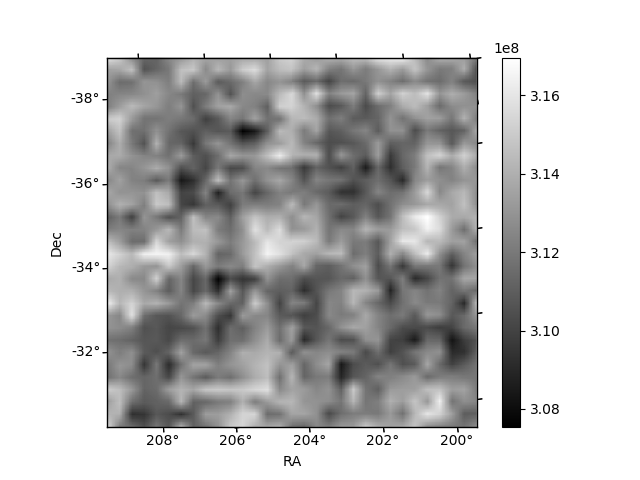
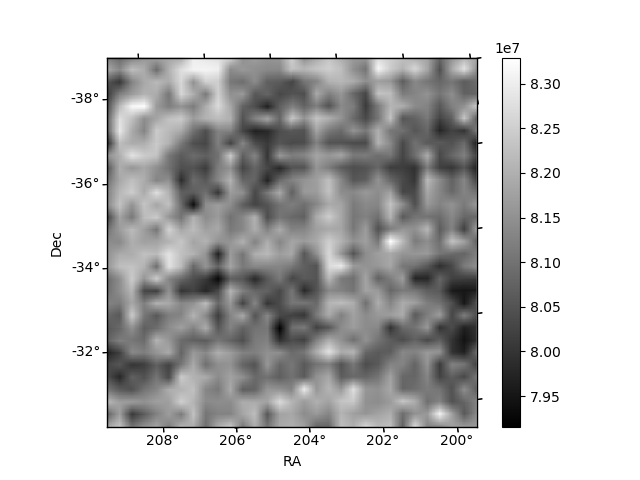
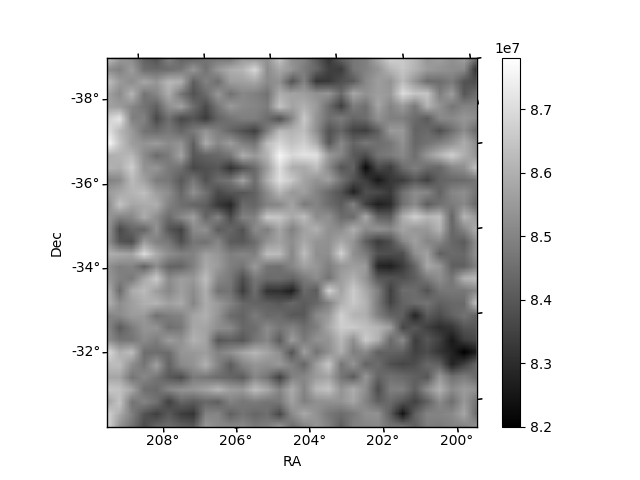
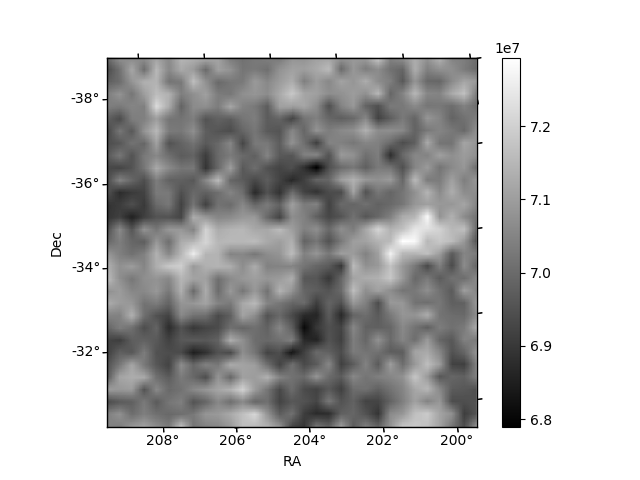
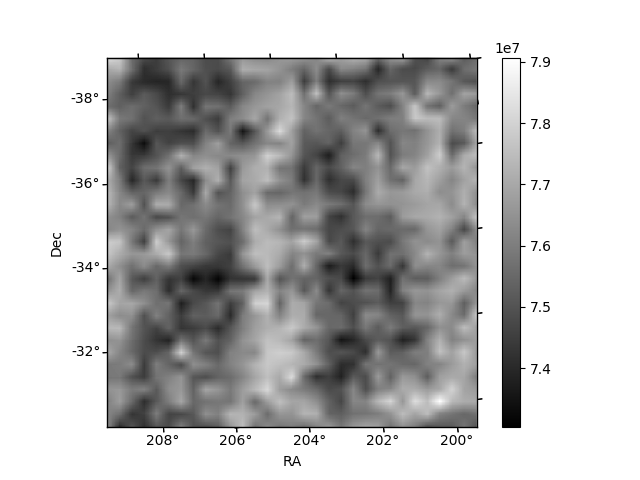
Histogram calculated using DETX and DETY for each event in the final _common_clean file
| Quadrant A | 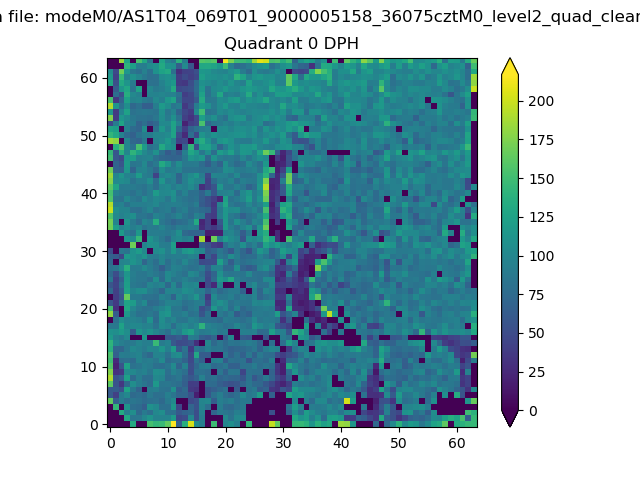 |
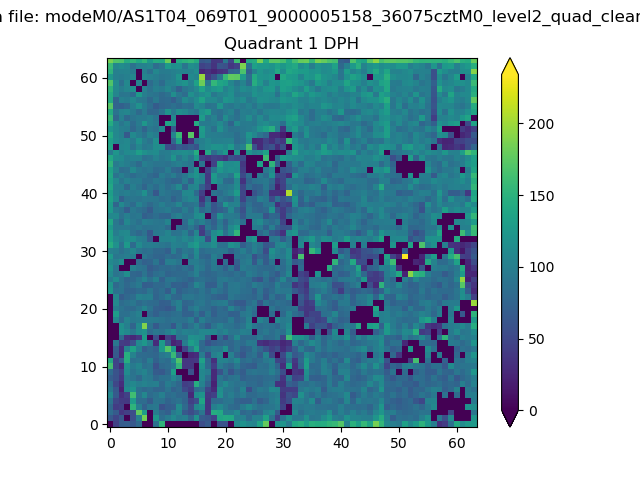 |
Quadrant B |
|---|---|---|---|
| Quadrant D | 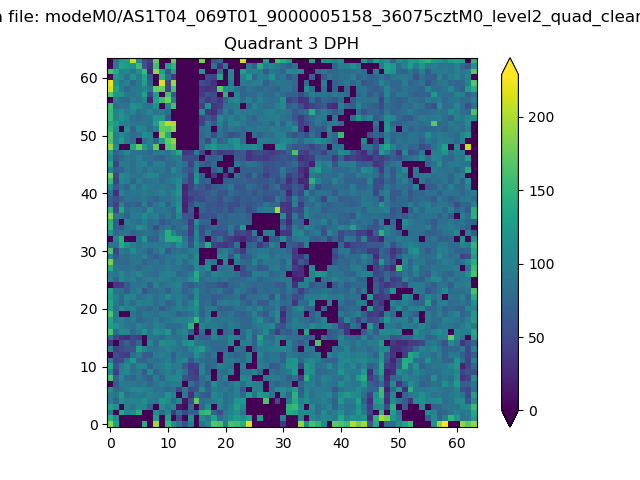 |
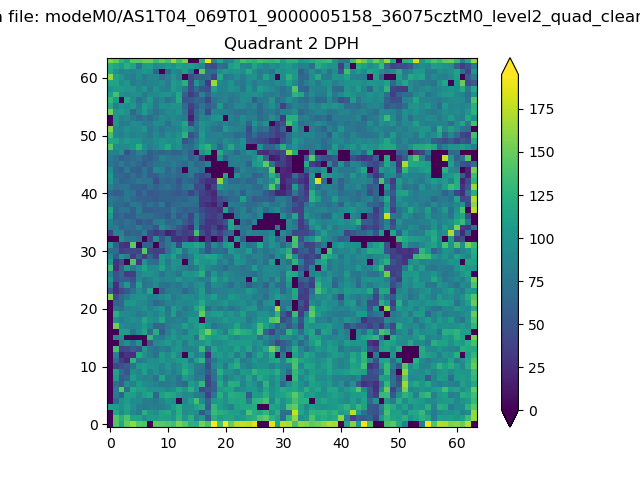 |
Quadrant C |
| Plot type | Count rate plots | Images |
|---|---|---|
| Comparison with Poisson distribution Blue bars denote a histogram of data divided into 1 sec bins. Red curve is a Poisson curve with rate = median count rate of data. |
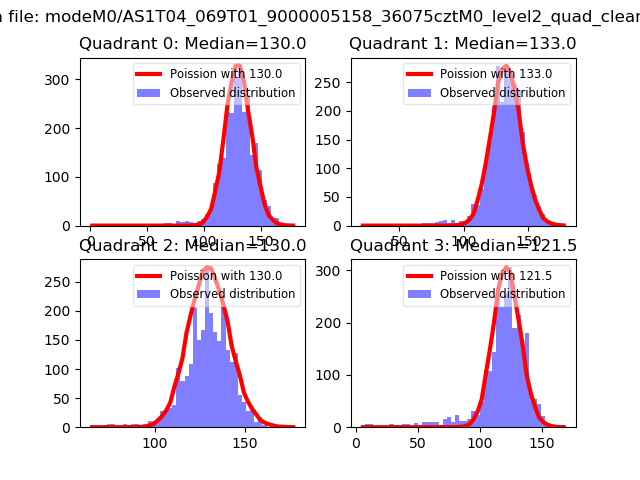 |
 |
| Quadrant-wise count rates Data is divided into 100 sec bins |
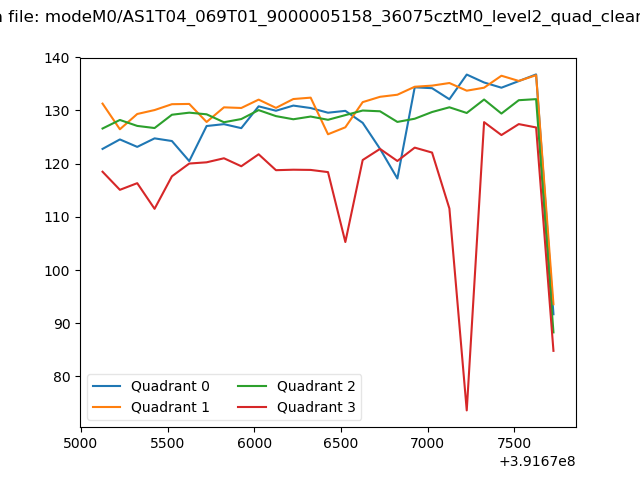 |
|
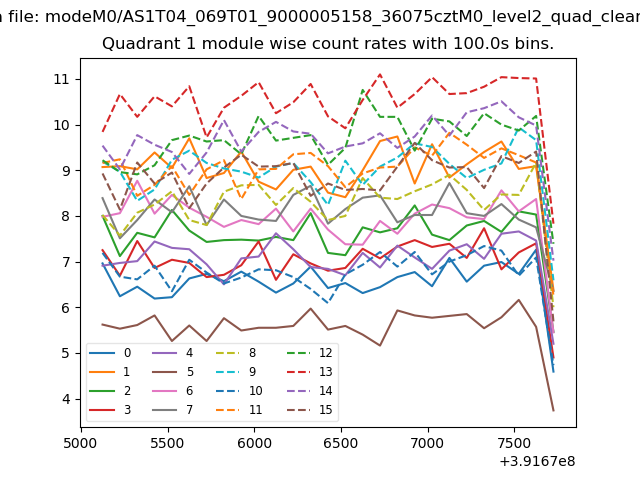
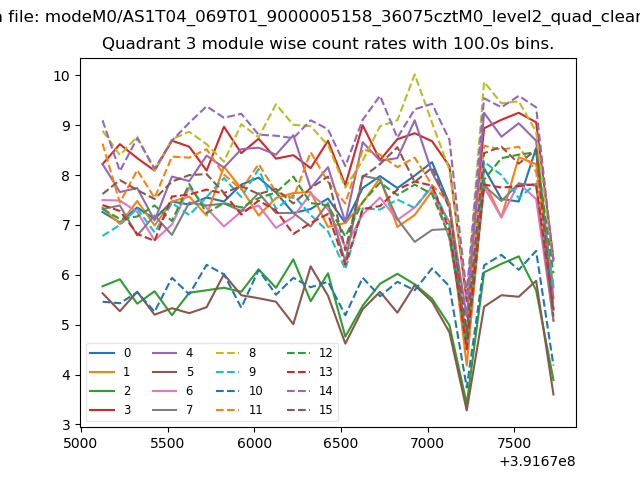
| Module-wise count rates for Quadrant A Data is divided into 100 sec bins |
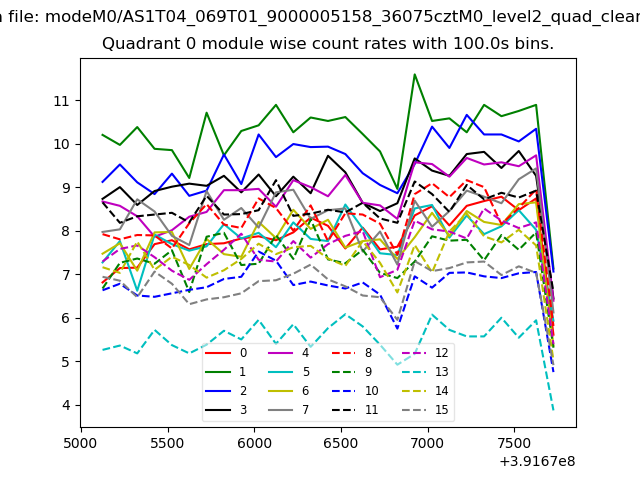 |
 |
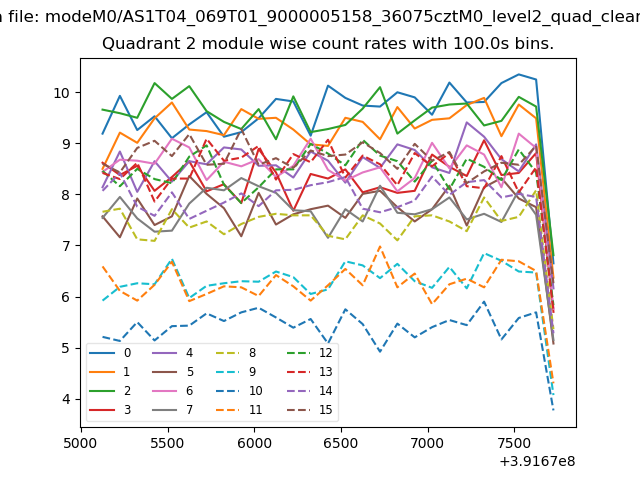
| Module-wise count rates for Quadrant B Data is divided into 100 sec bins |
 |
 |
| Module-wise count rates for Quadrant C Data is divided into 100 sec bins |
 |
 |
| Module-wise count rates for Quadrant D Data is divided into 100 sec bins |
 |
 |
| Parameter | Plot |
|---|---|
| CZT HV Monitor | 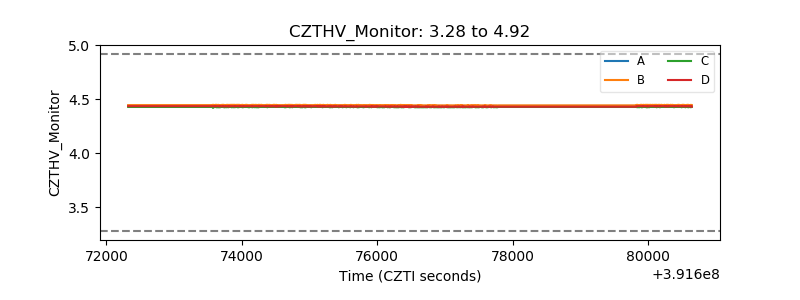 |
| D_VDD | 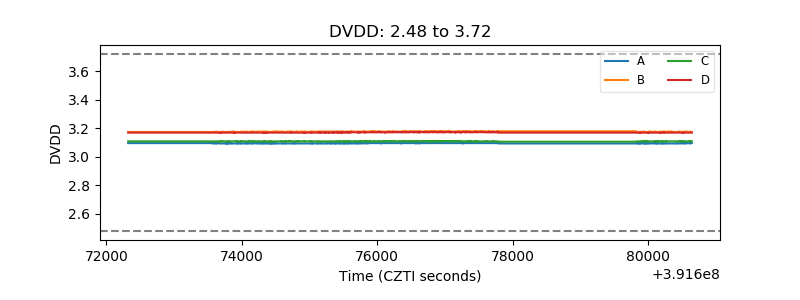 |
| Temperature 1 | 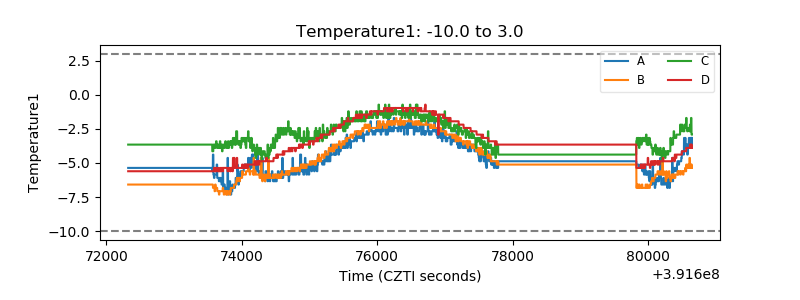 |
| Veto HV Monitor | 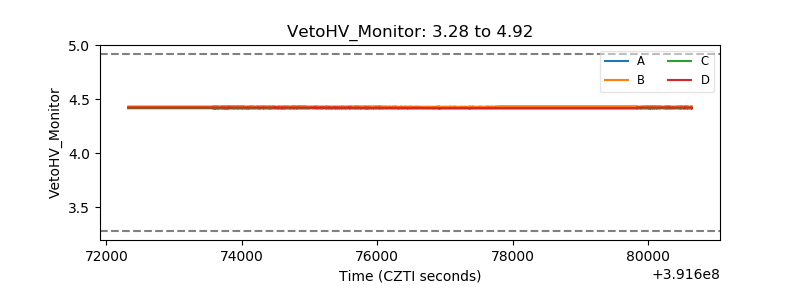 |
| Veto LLD | 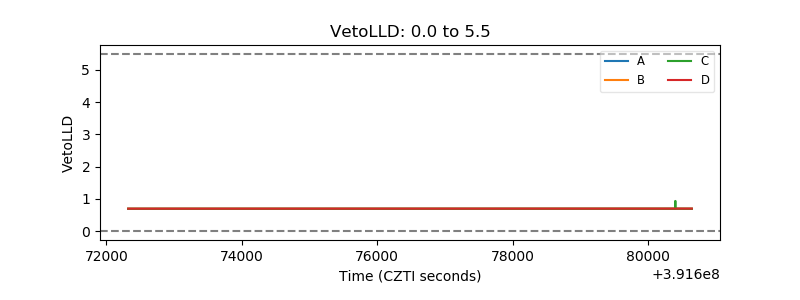 |
| Alpha Counter | 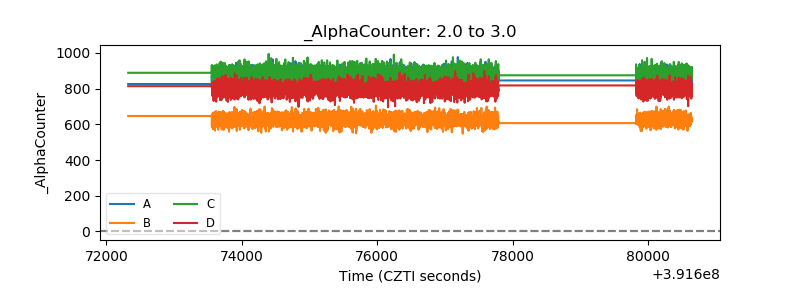 |
| _CPM_Rate | 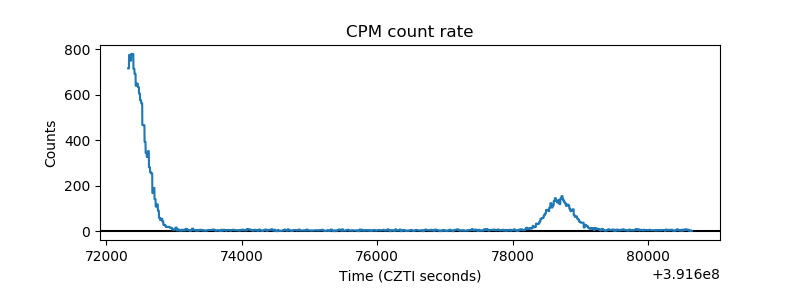 |
| CZT Counter | 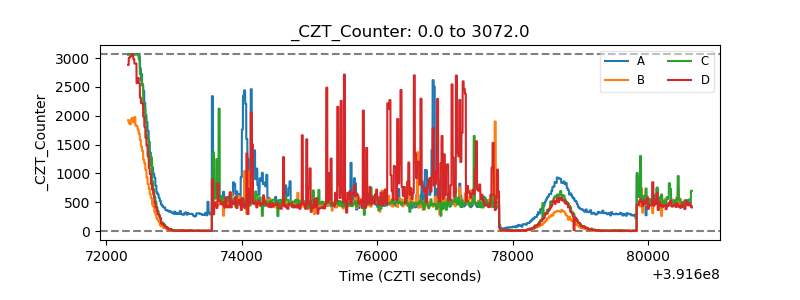 |
| +2.5 Volts monitor | 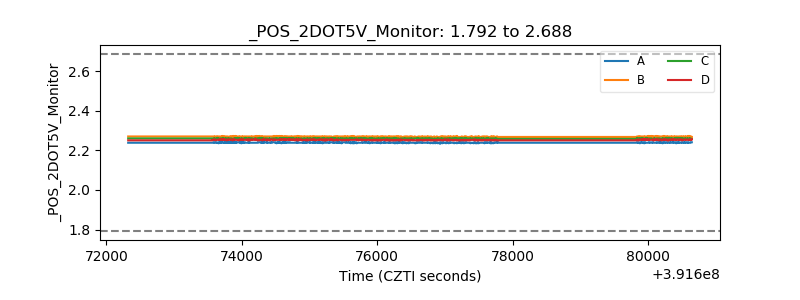 |
| +5 Volts monitor | 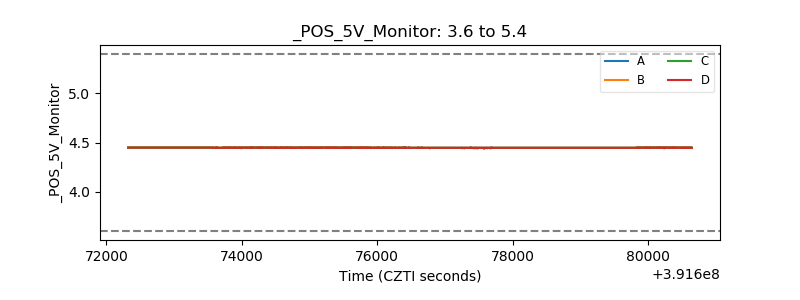 |
| _ROLL_ROT | 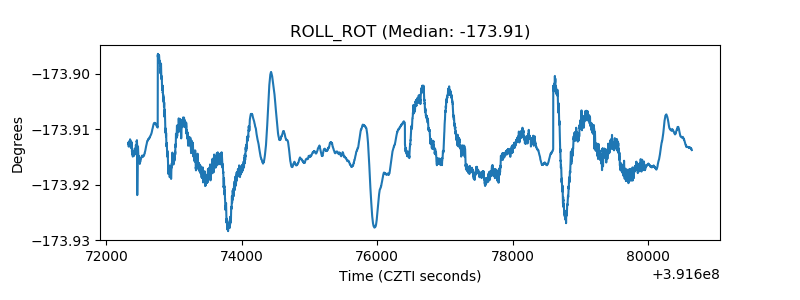 |
| _Roll_DEC | 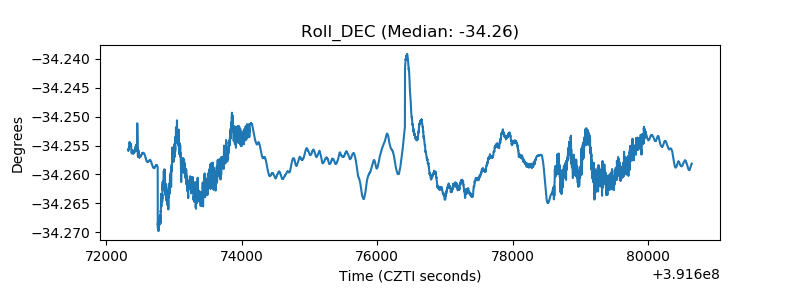 |
| _Roll_RA | 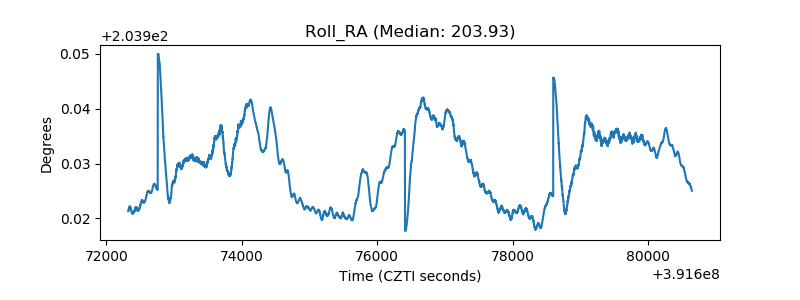 |
| Veto Counter | 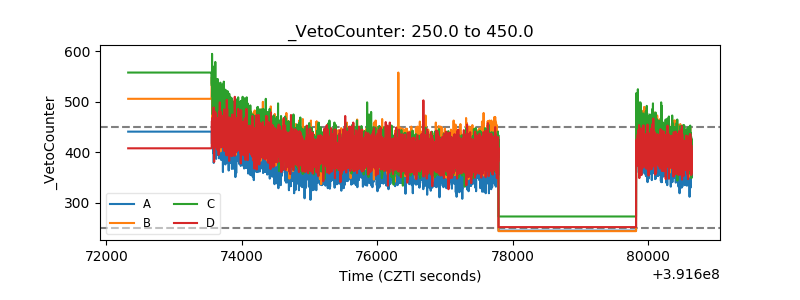 |