| Param | Original file | Final file |
|---|---|---|
| Filename | modeM0/AS1T04_069T01_9000005158_36074cztM0_level2.evt | modeM0/AS1T04_069T01_9000005158_36074cztM0_level2_quad_clean.evt |
| Size (bytes) | 440,962,560 | 47,882,880 |
| Size | 420.5 MB | 45.7 MB |
| Events in quadrant A | 2,908,070 | 287,173 |
| Events in quadrant B | 3,070,983 | 283,464 |
| Events in quadrant C | 2,897,921 | 284,844 |
| Events in quadrant D | 4,130,513 | 235,528 |
| Mode M0 | |||
|---|---|---|---|
| Quadrant | BADHDUFLAG | Total packets | Discarded packets |
| A | 0 | 11703 | 3 |
| B | 0 | 12113 | 2 |
| C | 0 | 11373 | 2 |
| D | 0 | 15563 | 2 |
| Mode M9 | |||
|---|---|---|---|
| Quadrant | BADHDUFLAG | Total packets | Discarded packets |
| A | 0 | 38 | 0 |
| B | 0 | 38 | 0 |
| C | 0 | 38 | 0 |
| D | 0 | 39 | 0 |
| Mode SS | |||
|---|---|---|---|
| Quadrant | BADHDUFLAG | Total packets | Discarded packets |
| A | 0 | 104 | 0 |
| B | 0 | 104 | 0 |
| C | 0 | 104 | 0 |
| D | 0 | 104 | 0 |
| Quadrant | Total seconds | Saturated seconds | Saturation percentage |
|---|---|---|---|
| A | 5111 | 48 | 0.939151% |
| B | 5111 | 144 | 2.817453% |
| C | 5111 | 73 | 1.428292% |
| D | 5111 | 462 | 9.039327% |
Noise dominated data is calculated using 1-second bins in cleaned event files. If a bin has >2000 counts, and if more than 50% of those come from <1% of pixels, then it is considered to be noise-dominated and hence unusable.
| Quadrant | # 1 sec bins | Bins with >0 counts | Bins with >2000 counts | High rate bins dominated by noise | Noise dominated (total time) | Noise dominated (detector-on time) | Marked lightcurve |
|---|---|---|---|---|---|---|---|
| A | 7264 | 5112 | 41 | 41 | 0.56% | 0.80% | 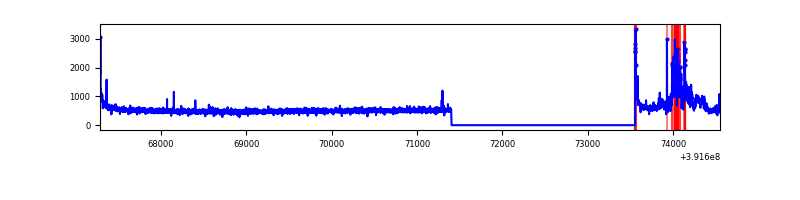 |
| B | 7264 | 5112 | 101 | 101 | 1.39% | 1.98% | 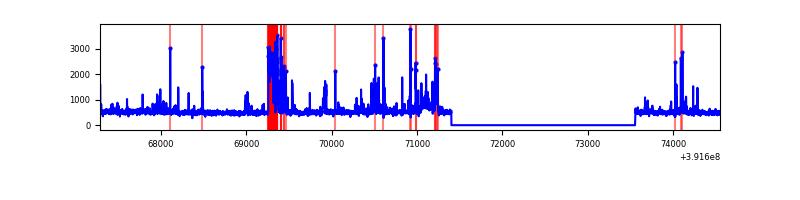 |
| C | 7264 | 5112 | 55 | 55 | 0.76% | 1.08% | 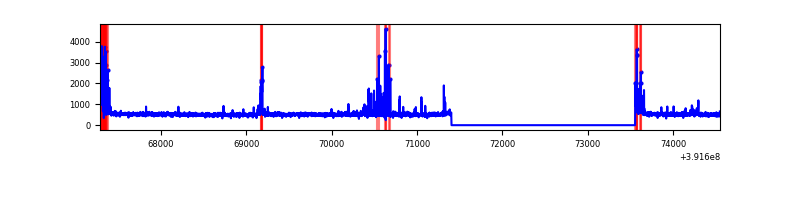 |
| D | 7264 | 5111 | 423 | 423 | 5.82% | 8.28% | 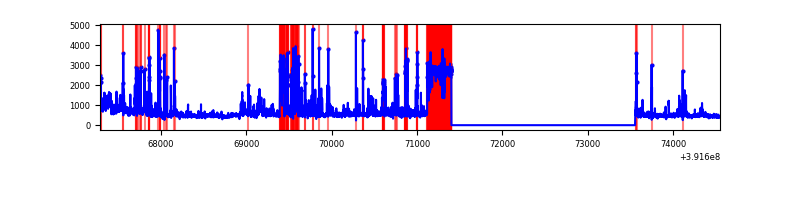 |
Top three noisy pixels from each quadrant. If the there are fewer than three noisy pixels in the level2.evt file, extra rows are filled as -1
| Pixel properties | Quadrant properties | ||||||
|---|---|---|---|---|---|---|---|
| Quadrant | DetID | PixID | Counts | Sigma | Mean | Median | Sigma |
| A | 0 | 8 | 326779 | 2614.94 | 618 | 605 | 124.7 |
| A | 10 | 83 | 167053 | 1334.41 | 618 | 605 | 124.7 |
| A | 9 | 143 | 10985 | 83.21 | 618 | 605 | 124.7 |
| B | 5 | 172 | 425368 | 3686.3 | 610 | 598 | 115.2 |
| B | 0 | 190 | 86790 | 748.0 | 610 | 598 | 115.2 |
| B | 5 | 255 | 86422 | 744.81 | 610 | 598 | 115.2 |
| C | 15 | 214 | 215334 | 1549.24 | 602 | 606 | 138.6 |
| C | 0 | 10 | 179028 | 1287.29 | 602 | 606 | 138.6 |
| C | 15 | 208 | 149205 | 1072.12 | 602 | 606 | 138.6 |
| D | 12 | 227 | 787589 | 5573.05 | 574 | 558 | 141.2 |
| D | 1 | 52 | 383131 | 2709.04 | 574 | 558 | 141.2 |
| D | 12 | 6 | 187009 | 1320.28 | 574 | 558 | 141.2 |
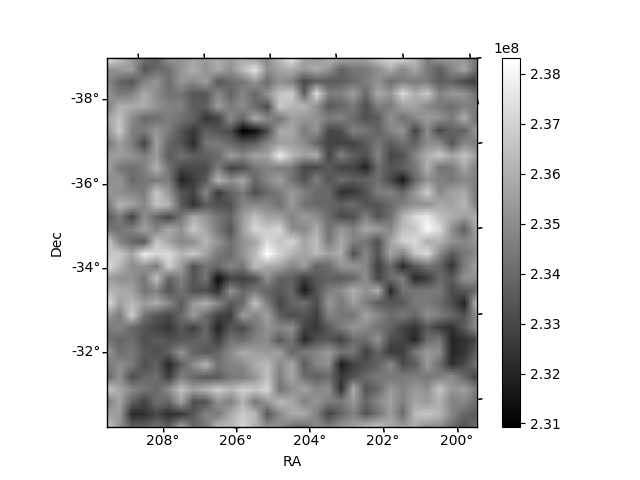
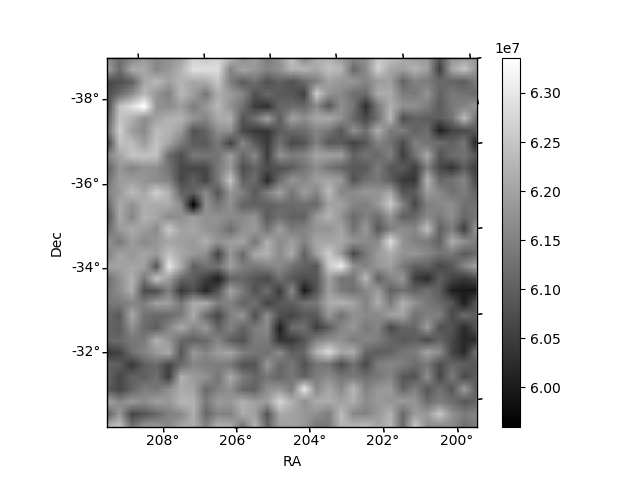
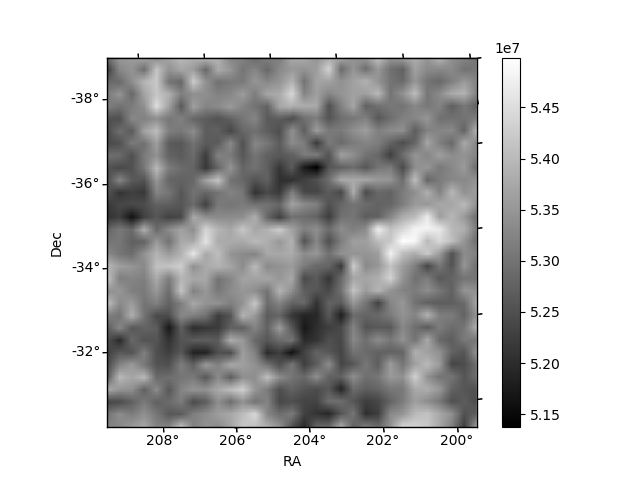
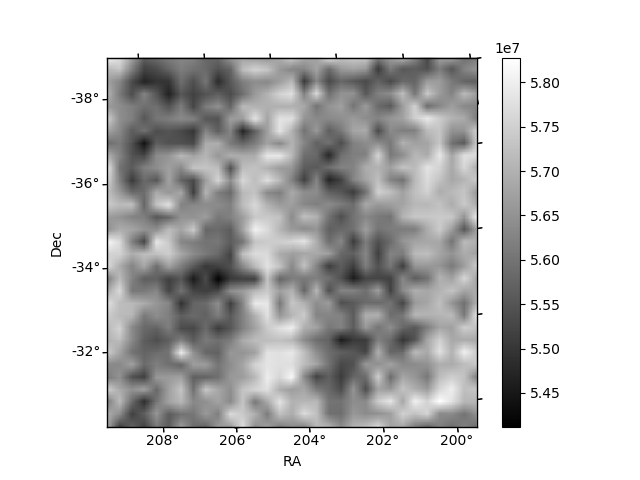
Histogram calculated using DETX and DETY for each event in the final _common_clean file
| Quadrant A | 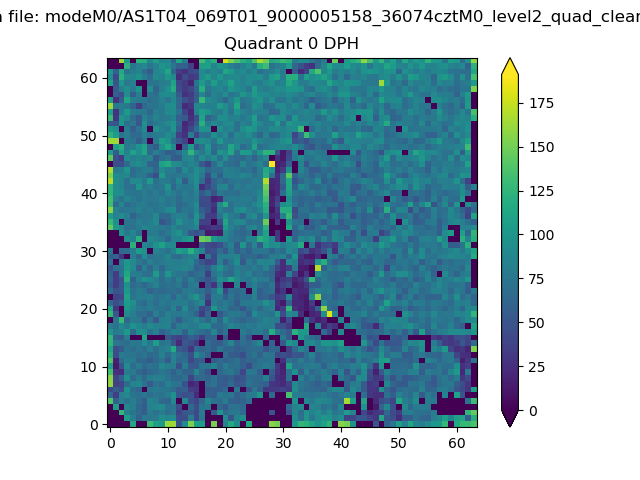 |
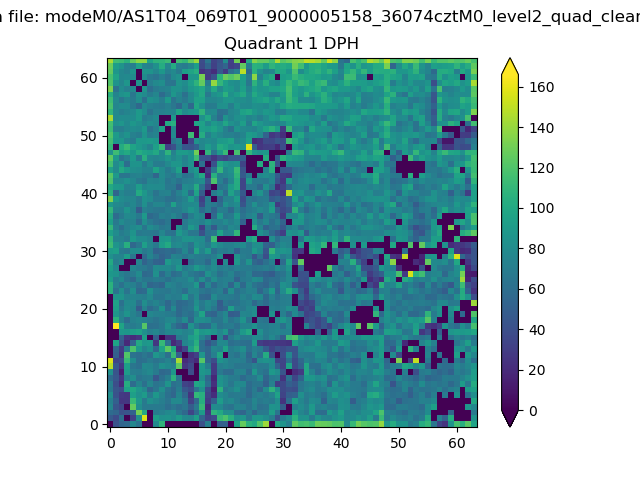 |
Quadrant B |
|---|---|---|---|
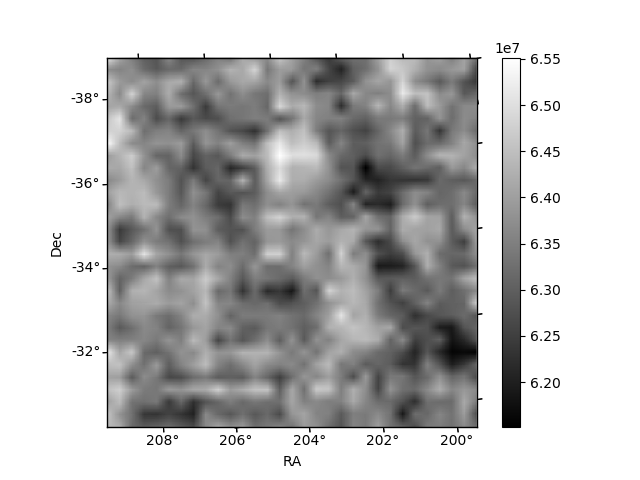
| Quadrant D | 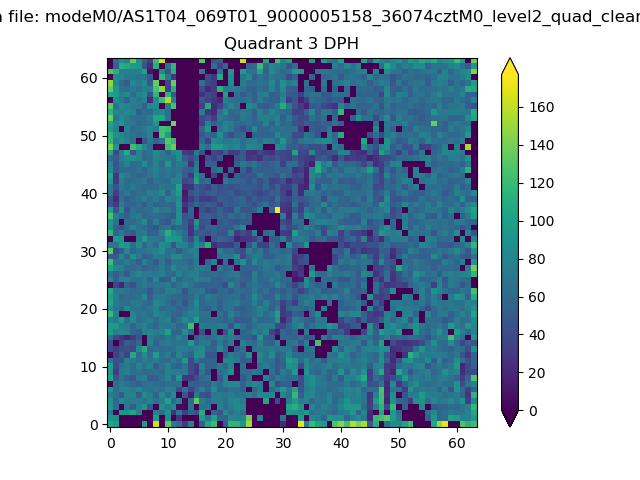 |
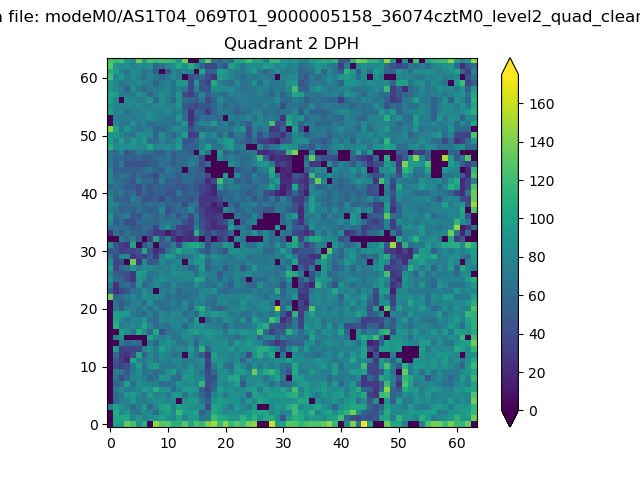 |
Quadrant C |
| Plot type | Count rate plots | Images |
|---|---|---|
| Comparison with Poisson distribution Blue bars denote a histogram of data divided into 1 sec bins. Red curve is a Poisson curve with rate = median count rate of data. |
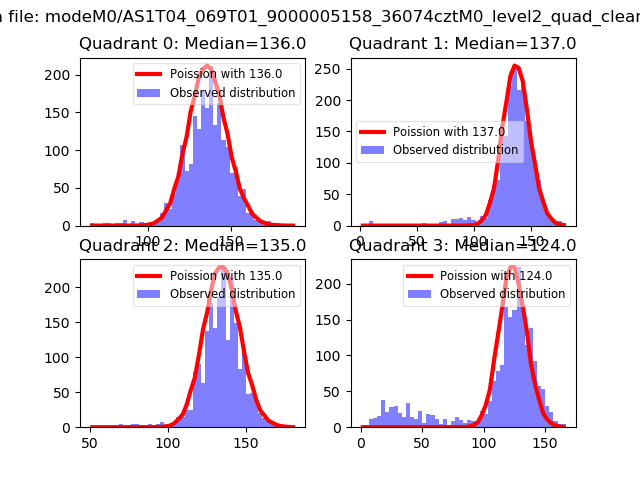 |
 |
| Quadrant-wise count rates Data is divided into 100 sec bins |
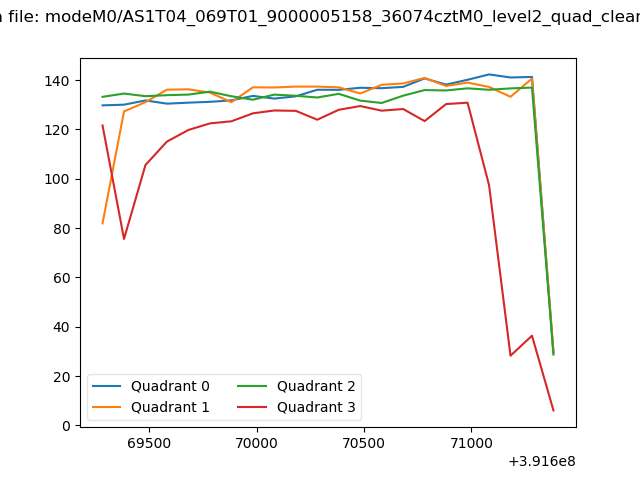 |
|
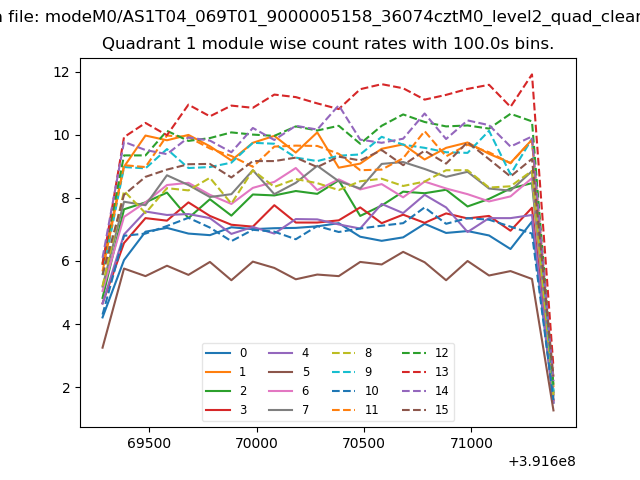
| Module-wise count rates for Quadrant A Data is divided into 100 sec bins |
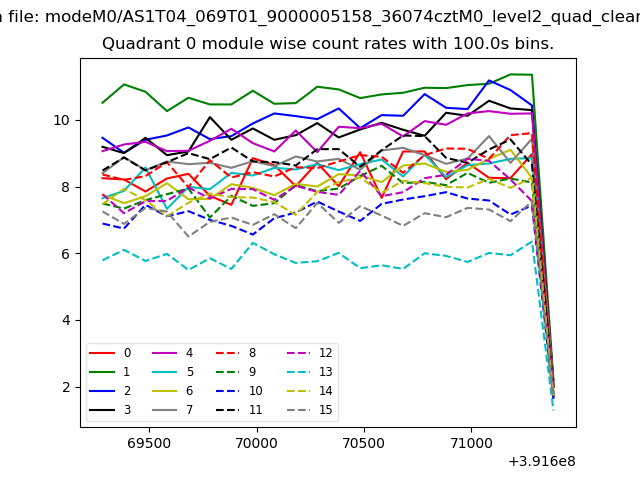 |
 |
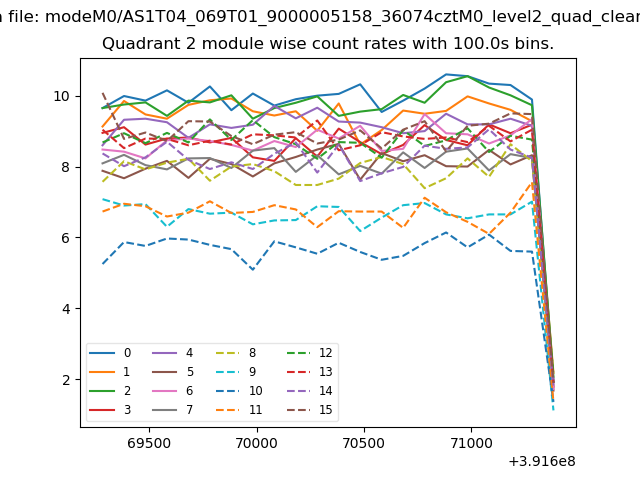
| Module-wise count rates for Quadrant B Data is divided into 100 sec bins |
 |
 |
| Module-wise count rates for Quadrant C Data is divided into 100 sec bins |
 |
 |
| Module-wise count rates for Quadrant D Data is divided into 100 sec bins |
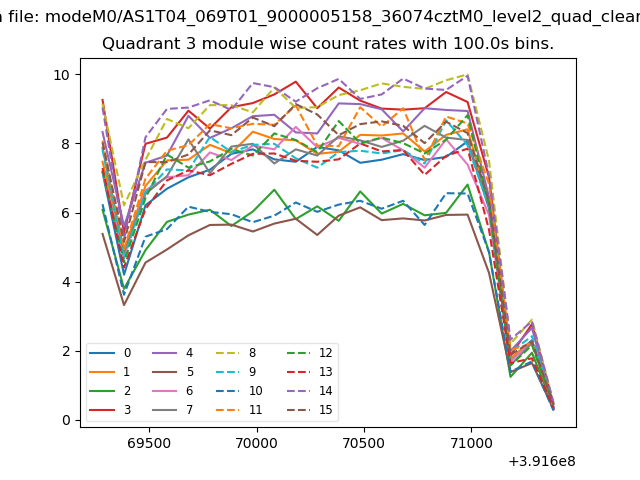 |
 |
| Parameter | Plot |
|---|---|
| CZT HV Monitor | 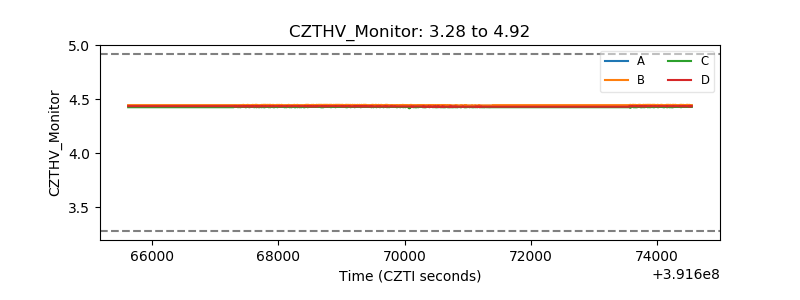 |
| D_VDD | 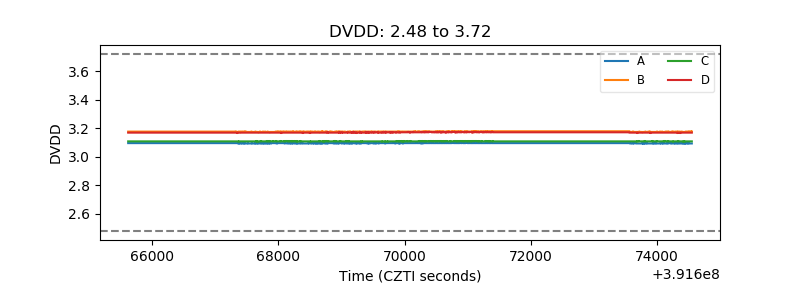 |
| Temperature 1 | 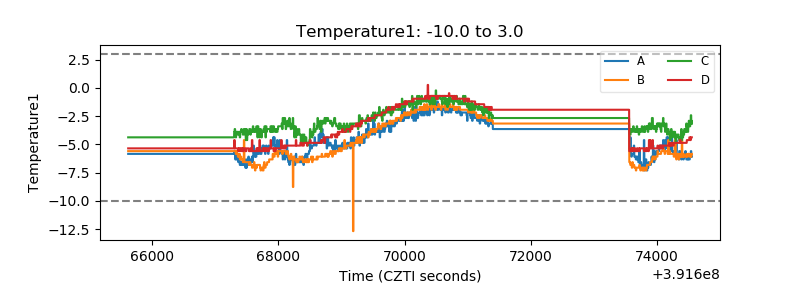 |
| Veto HV Monitor | 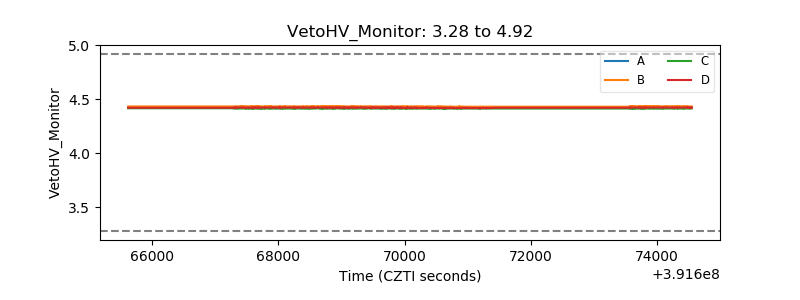 |
| Veto LLD | 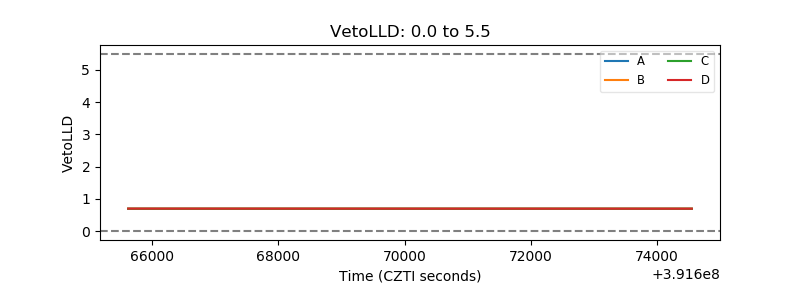 |
| Alpha Counter | 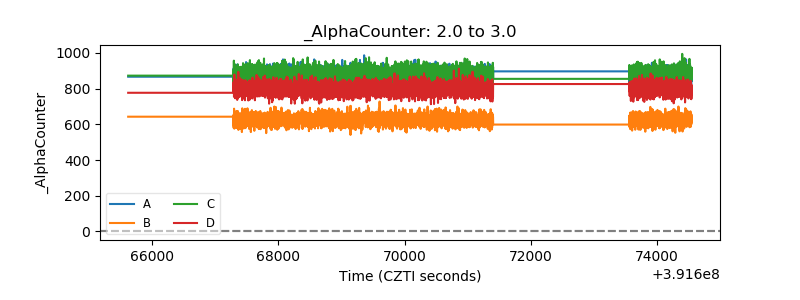 |
| _CPM_Rate | 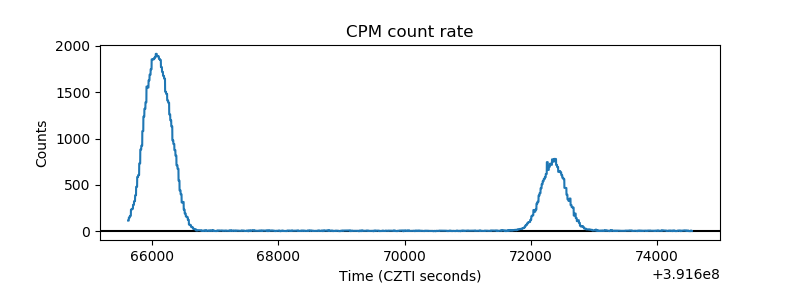 |
| CZT Counter | 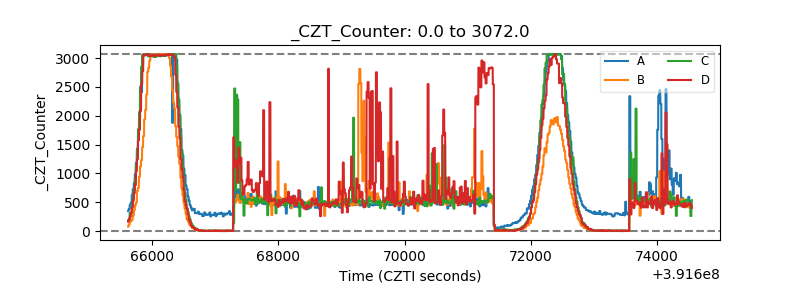 |
| +2.5 Volts monitor | 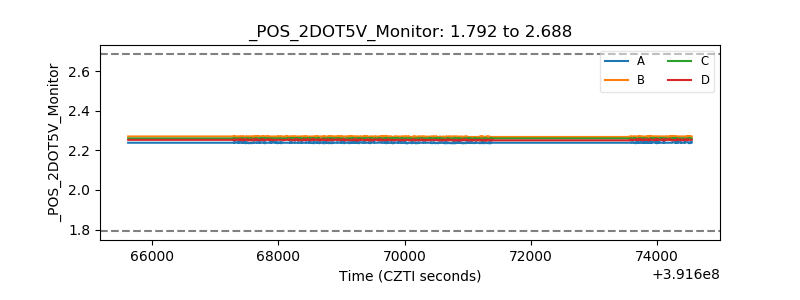 |
| +5 Volts monitor | 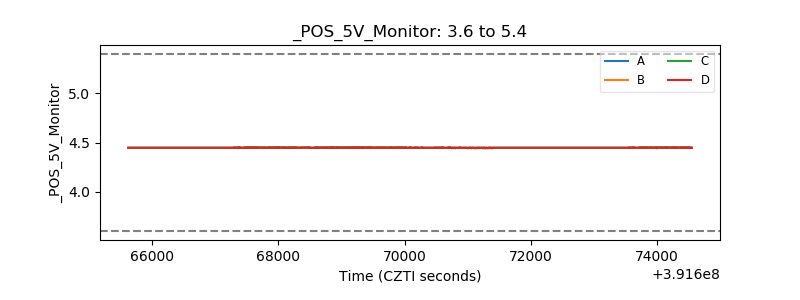 |
| _ROLL_ROT | 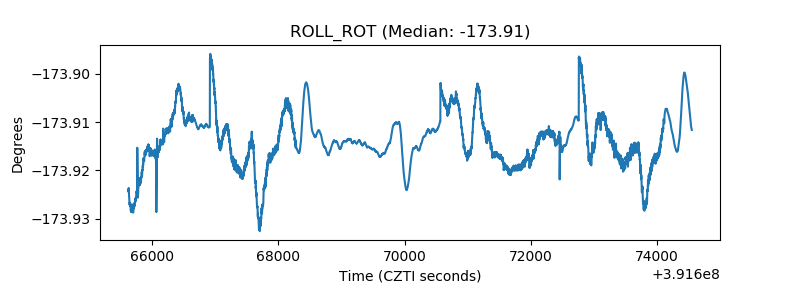 |
| _Roll_DEC | 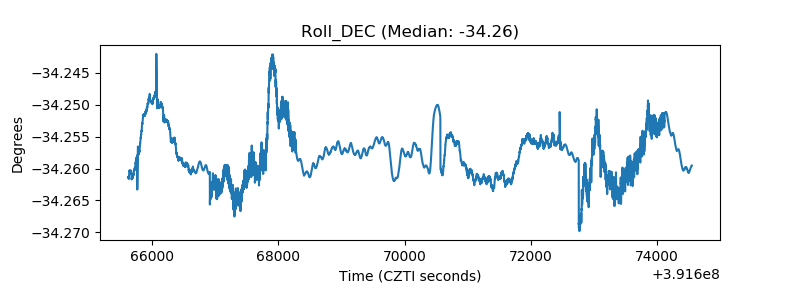 |
| _Roll_RA | 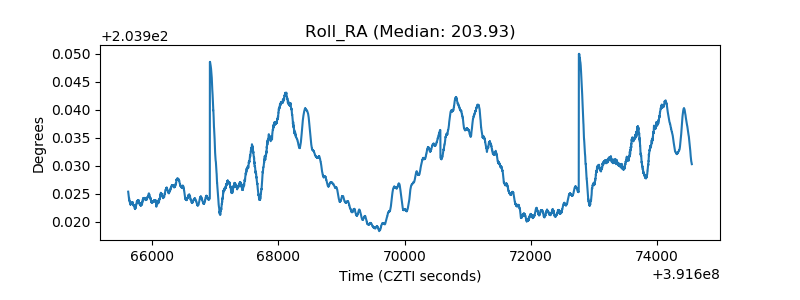 |
| Veto Counter | 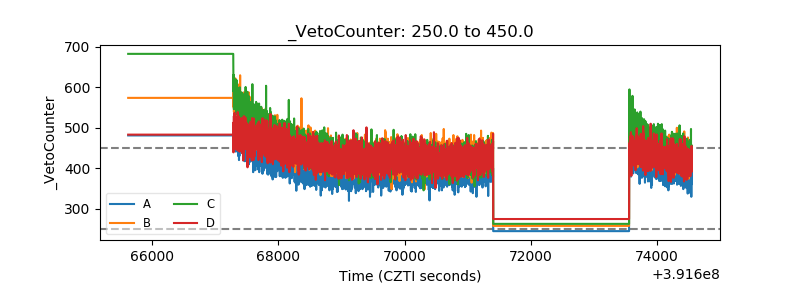 |