| Param | Original file | Final file |
|---|---|---|
| Filename | modeM0/AS1T04_069T01_9000005158_36071cztM0_level2.evt | modeM0/AS1T04_069T01_9000005158_36071cztM0_level2_quad_clean.evt |
| Size (bytes) | 397,480,320 | 61,758,720 |
| Size | 379.1 MB | 58.9 MB |
| Events in quadrant A | 2,502,470 | 389,279 |
| Events in quadrant B | 2,721,507 | 396,395 |
| Events in quadrant C | 2,710,803 | 380,077 |
| Events in quadrant D | 3,759,346 | 349,775 |
| Mode M0 | |||
|---|---|---|---|
| Quadrant | BADHDUFLAG | Total packets | Discarded packets |
| A | 0 | 10539 | 3 |
| B | 0 | 11204 | 2 |
| C | 0 | 10912 | 2 |
| D | 0 | 14577 | 2 |
| Mode M9 | |||
|---|---|---|---|
| Quadrant | BADHDUFLAG | Total packets | Discarded packets |
| A | 0 | 30 | 0 |
| B | 0 | 30 | 0 |
| C | 0 | 30 | 0 |
| D | 0 | 31 | 0 |
| Mode SS | |||
|---|---|---|---|
| Quadrant | BADHDUFLAG | Total packets | Discarded packets |
| A | 0 | 102 | 0 |
| B | 0 | 102 | 0 |
| C | 0 | 102 | 0 |
| D | 0 | 102 | 0 |
| Quadrant | Total seconds | Saturated seconds | Saturation percentage |
|---|---|---|---|
| A | 5056 | 11 | 0.217563% |
| B | 5056 | 17 | 0.336234% |
| C | 5056 | 45 | 0.890032% |
| D | 5056 | 335 | 6.625791% |
Noise dominated data is calculated using 1-second bins in cleaned event files. If a bin has >2000 counts, and if more than 50% of those come from <1% of pixels, then it is considered to be noise-dominated and hence unusable.
| Quadrant | # 1 sec bins | Bins with >0 counts | Bins with >2000 counts | High rate bins dominated by noise | Noise dominated (total time) | Noise dominated (detector-on time) | Marked lightcurve |
|---|---|---|---|---|---|---|---|
| A | 6999 | 5057 | 0 | 0 | 0.00% | 0.00% | 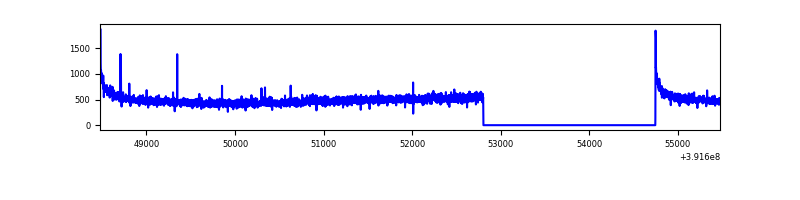 |
| B | 6999 | 5057 | 9 | 9 | 0.13% | 0.18% | 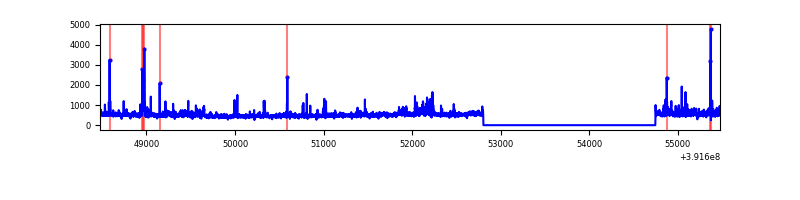 |
| C | 6999 | 5057 | 32 | 32 | 0.46% | 0.63% | 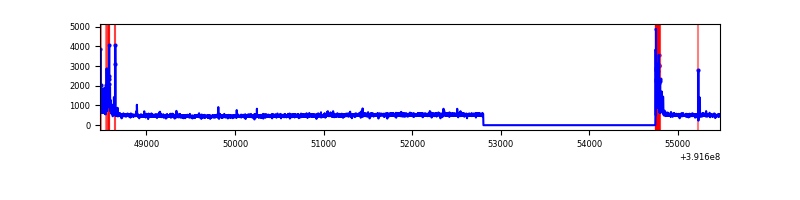 |
| D | 6999 | 5057 | 304 | 304 | 4.34% | 6.01% | 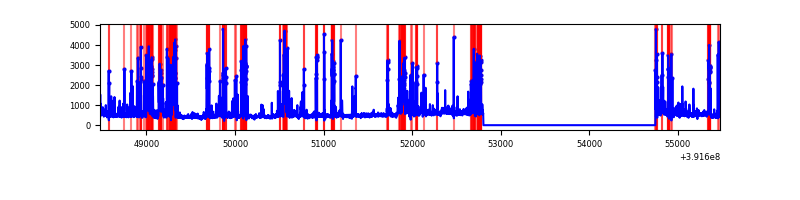 |
Top three noisy pixels from each quadrant. If the there are fewer than three noisy pixels in the level2.evt file, extra rows are filled as -1
| Pixel properties | Quadrant properties | ||||||
|---|---|---|---|---|---|---|---|
| Quadrant | DetID | PixID | Counts | Sigma | Mean | Median | Sigma |
| A | 10 | 83 | 164320 | 1344.24 | 601 | 589 | 121.8 |
| A | 13 | 254 | 8112 | 61.76 | 601 | 589 | 121.8 |
| A | 13 | 6 | 6643 | 49.7 | 601 | 589 | 121.8 |
| B | 0 | 213 | 120338 | 1050.35 | 602 | 588 | 114.0 |
| B | 5 | 172 | 107778 | 940.18 | 602 | 588 | 114.0 |
| B | 5 | 255 | 24646 | 211.02 | 602 | 588 | 114.0 |
| C | 15 | 214 | 210789 | 1539.51 | 584 | 588 | 136.5 |
| C | 0 | 10 | 121915 | 888.6 | 584 | 588 | 136.5 |
| C | 0 | 207 | 99509 | 724.49 | 584 | 588 | 136.5 |
| D | 12 | 17 | 743960 | 5388.69 | 562 | 547 | 138.0 |
| D | 12 | 6 | 310409 | 2246.06 | 562 | 547 | 138.0 |
| D | 12 | 227 | 143463 | 1035.94 | 562 | 547 | 138.0 |
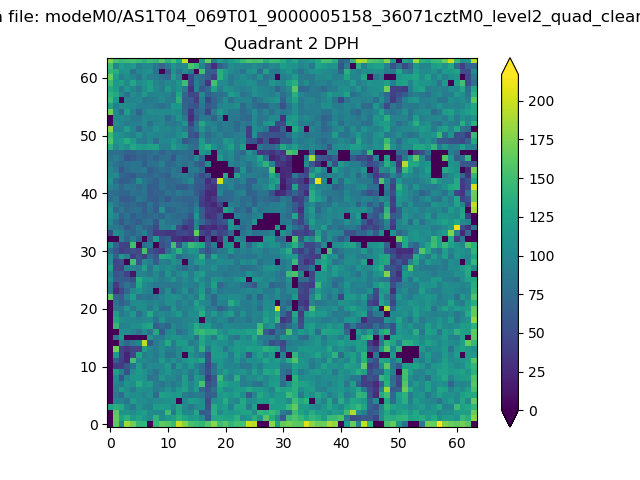
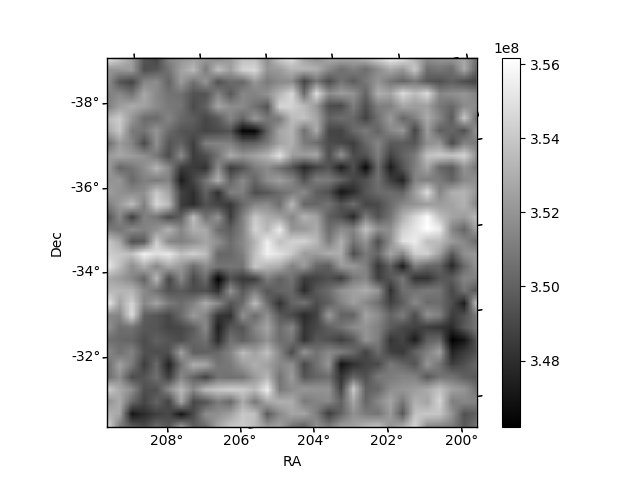
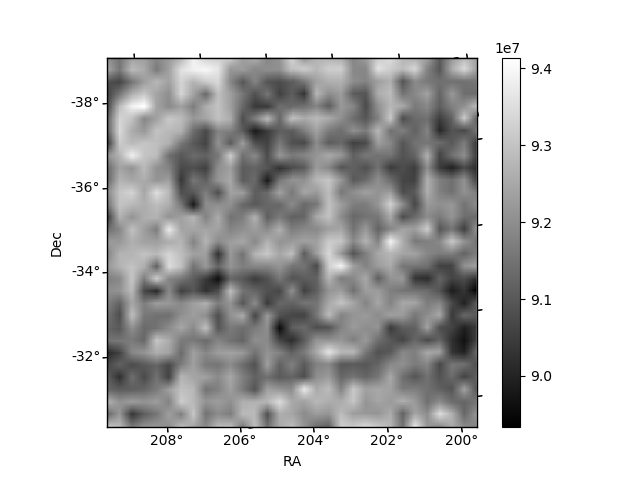
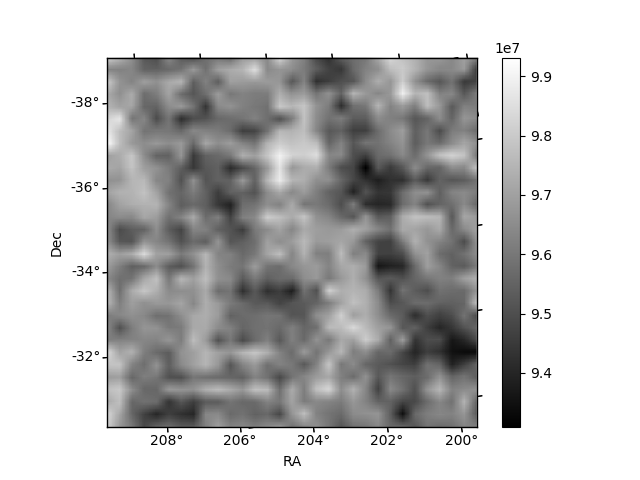
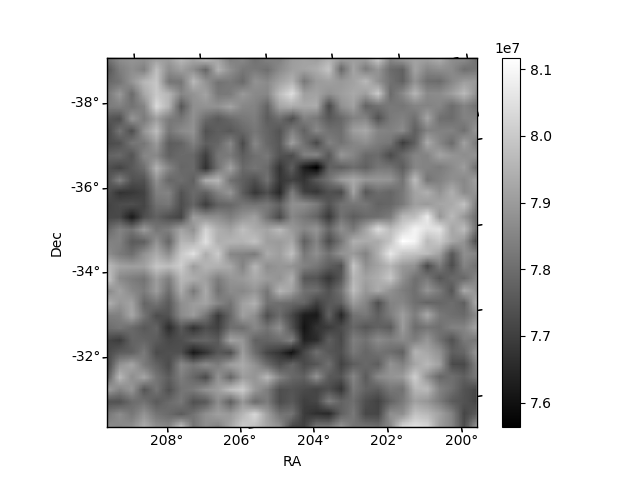
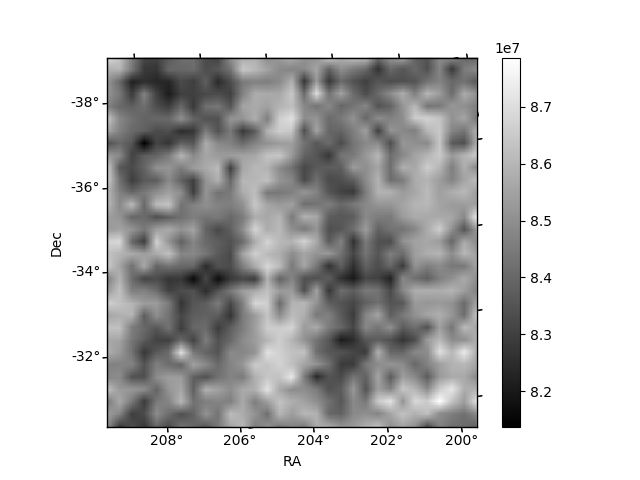
Histogram calculated using DETX and DETY for each event in the final _common_clean file
| Quadrant A | 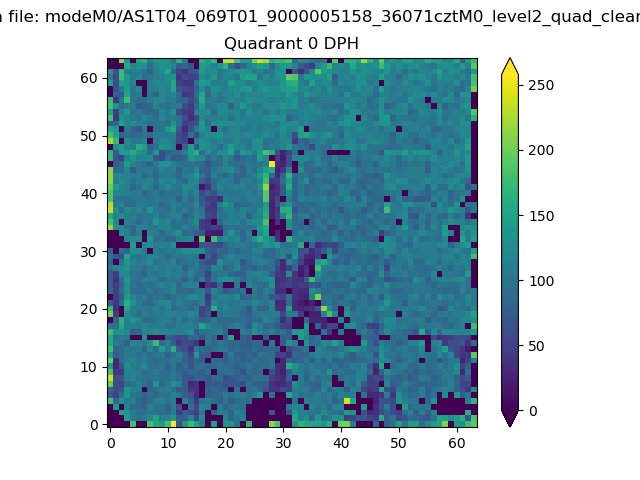 |
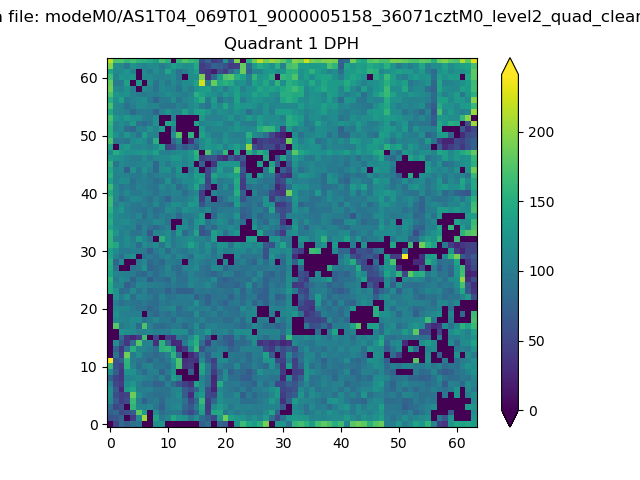 |
Quadrant B |
|---|---|---|---|
| Quadrant D | 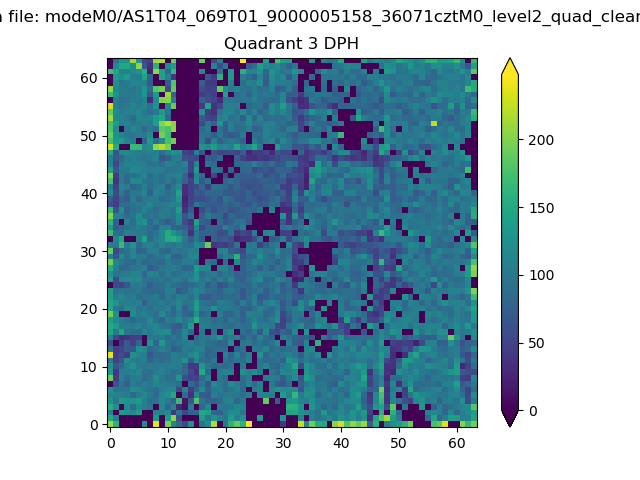 |
 |
Quadrant C |
| Plot type | Count rate plots | Images |
|---|---|---|
| Comparison with Poisson distribution Blue bars denote a histogram of data divided into 1 sec bins. Red curve is a Poisson curve with rate = median count rate of data. |
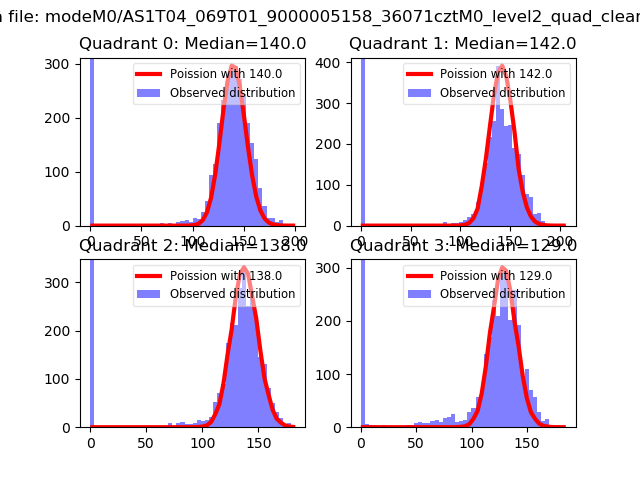 |
 |
| Quadrant-wise count rates Data is divided into 100 sec bins |
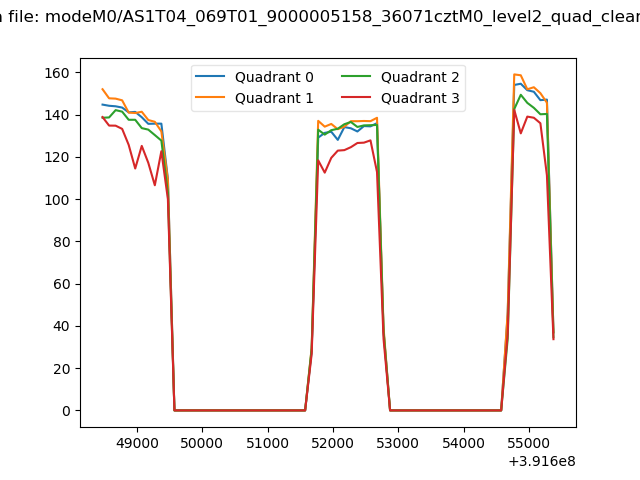 |
|
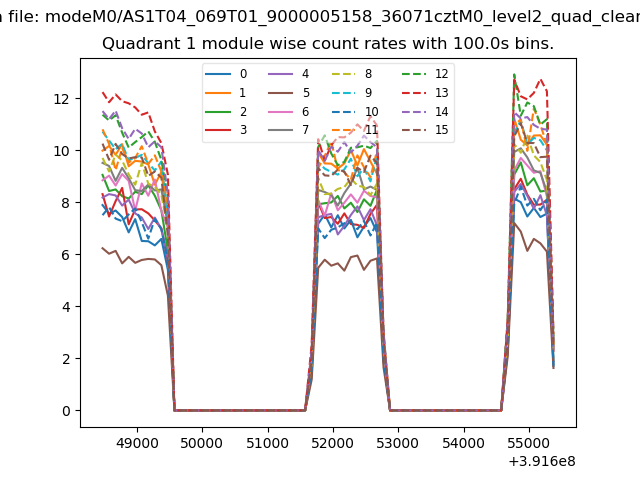
| Module-wise count rates for Quadrant A Data is divided into 100 sec bins |
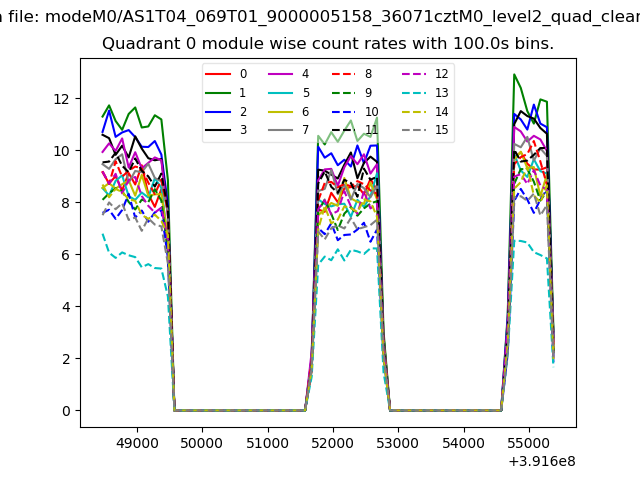 |
 |
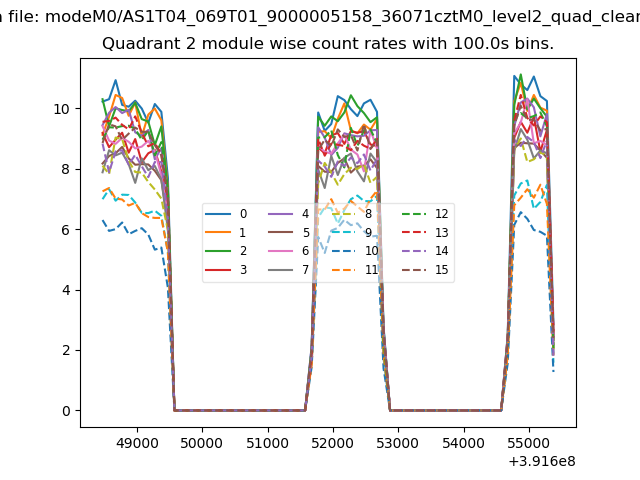
| Module-wise count rates for Quadrant B Data is divided into 100 sec bins |
 |
 |
| Module-wise count rates for Quadrant C Data is divided into 100 sec bins |
 |
 |
| Module-wise count rates for Quadrant D Data is divided into 100 sec bins |
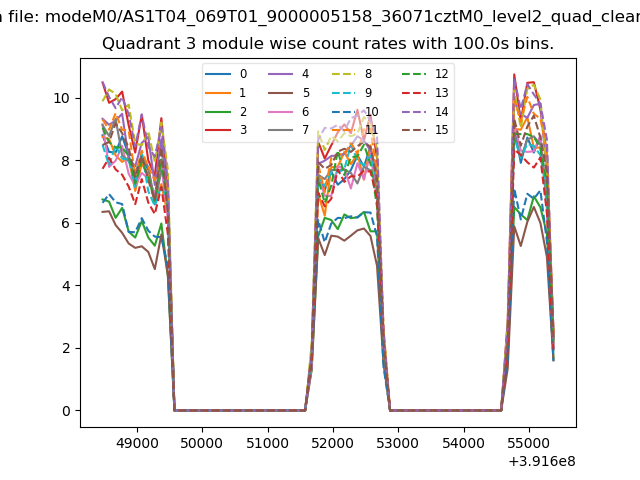 |
 |
| Parameter | Plot |
|---|---|
| CZT HV Monitor | 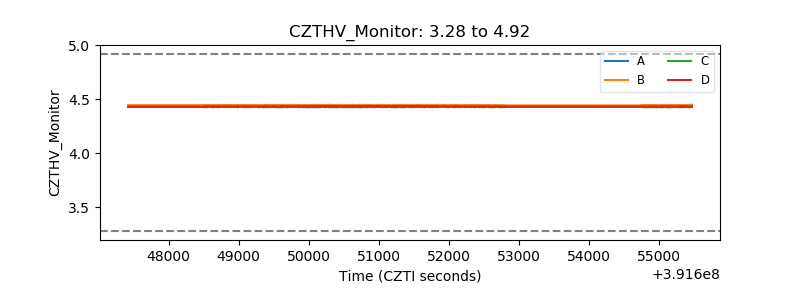 |
| D_VDD | 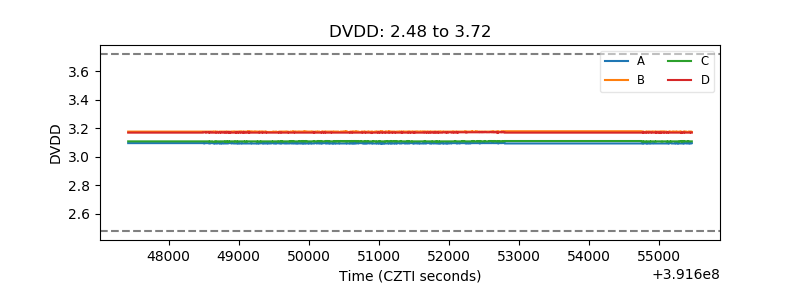 |
| Temperature 1 | 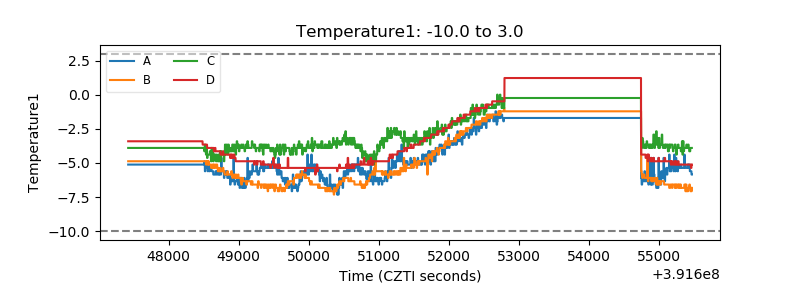 |
| Veto HV Monitor | 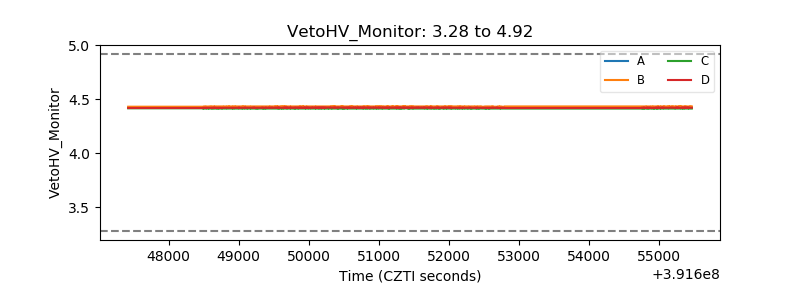 |
| Veto LLD | 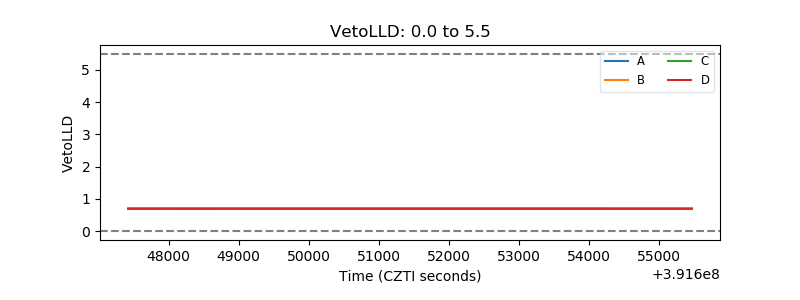 |
| Alpha Counter | 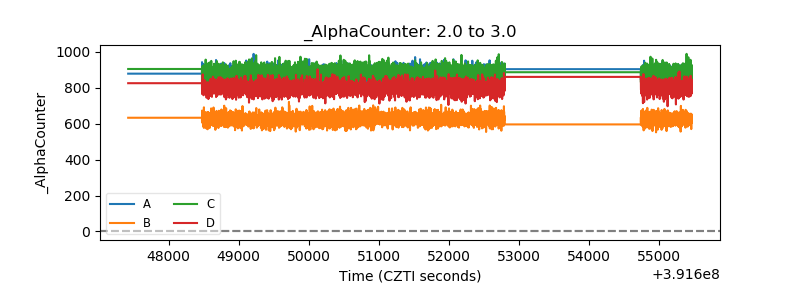 |
| _CPM_Rate | 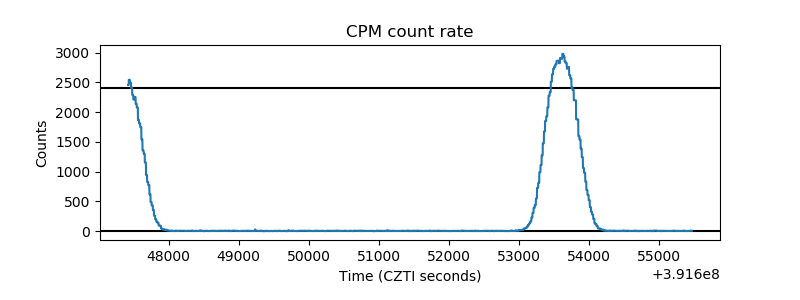 |
| CZT Counter | 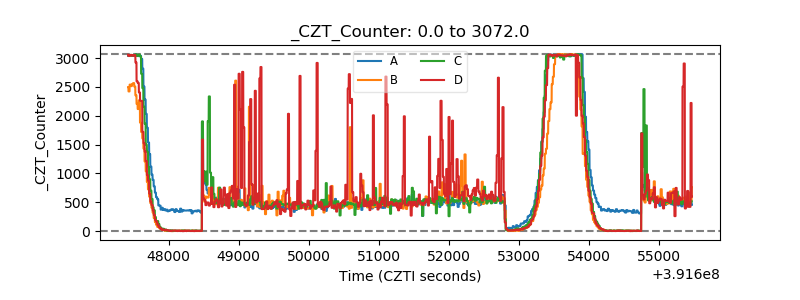 |
| +2.5 Volts monitor | 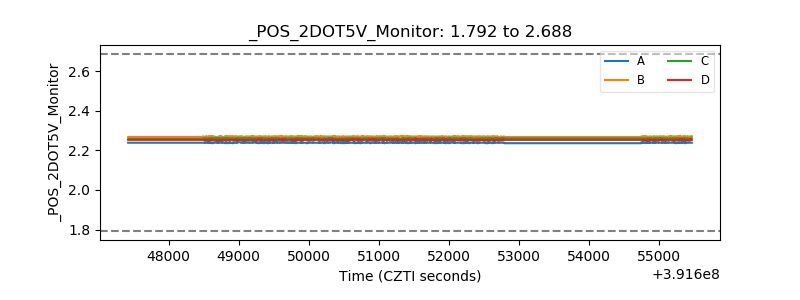 |
| +5 Volts monitor | 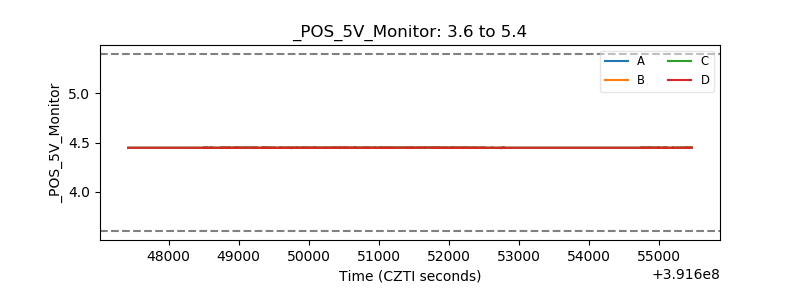 |
| _ROLL_ROT | 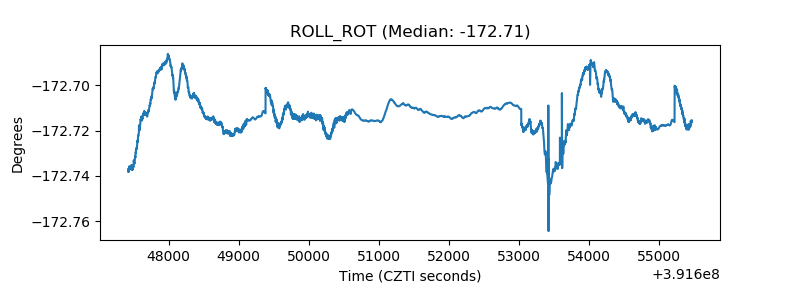 |
| _Roll_DEC | 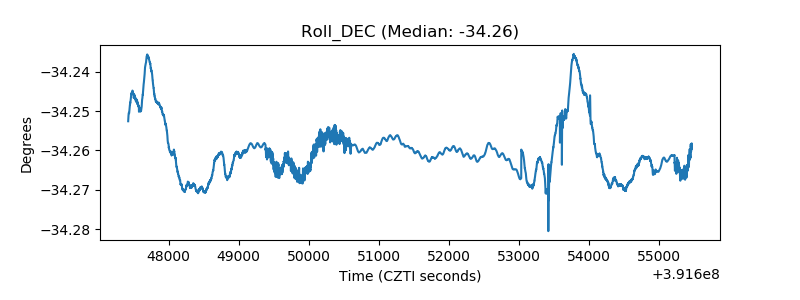 |
| _Roll_RA | 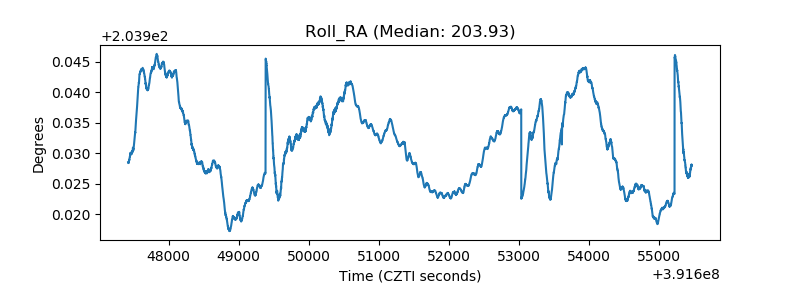 |
| Veto Counter | 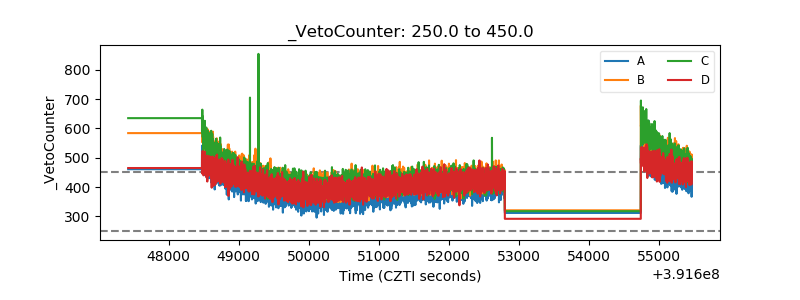 |