| Param | Original file | Final file |
|---|---|---|
| Filename | modeM0/AS1T04_069T01_9000005158_36068cztM0_level2.evt | modeM0/AS1T04_069T01_9000005158_36068cztM0_level2_quad_clean.evt |
| Size (bytes) | 508,536,000 | 64,863,360 |
| Size | 485.0 MB | 61.9 MB |
| Events in quadrant A | 2,656,992 | 423,301 |
| Events in quadrant B | 3,166,733 | 413,930 |
| Events in quadrant C | 5,966,765 | 350,340 |
| Events in quadrant D | 3,235,584 | 389,183 |
| Mode M0 | |||
|---|---|---|---|
| Quadrant | BADHDUFLAG | Total packets | Discarded packets |
| A | 0 | 11517 | 3 |
| B | 0 | 12966 | 2 |
| C | 0 | 21318 | 2 |
| D | 0 | 13519 | 2 |
| Mode M9 | |||
|---|---|---|---|
| Quadrant | BADHDUFLAG | Total packets | Discarded packets |
| A | 0 | 29 | 0 |
| B | 0 | 29 | 0 |
| C | 0 | 29 | 0 |
| D | 0 | 30 | 0 |
| Mode SS | |||
|---|---|---|---|
| Quadrant | BADHDUFLAG | Total packets | Discarded packets |
| A | 0 | 114 | 0 |
| B | 0 | 114 | 0 |
| C | 0 | 114 | 0 |
| D | 0 | 114 | 0 |
| Quadrant | Total seconds | Saturated seconds | Saturation percentage |
|---|---|---|---|
| A | 5520 | 8 | 0.144928% |
| B | 5520 | 166 | 3.007246% |
| C | 5520 | 904 | 16.376812% |
| D | 5520 | 202 | 3.659420% |
Noise dominated data is calculated using 1-second bins in cleaned event files. If a bin has >2000 counts, and if more than 50% of those come from <1% of pixels, then it is considered to be noise-dominated and hence unusable.
| Quadrant | # 1 sec bins | Bins with >0 counts | Bins with >2000 counts | High rate bins dominated by noise | Noise dominated (total time) | Noise dominated (detector-on time) | Marked lightcurve |
|---|---|---|---|---|---|---|---|
| A | 7194 | 5521 | 3 | 3 | 0.04% | 0.05% | 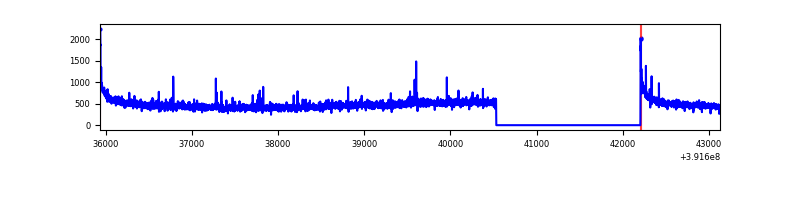 |
| B | 7194 | 5521 | 115 | 115 | 1.60% | 2.08% | 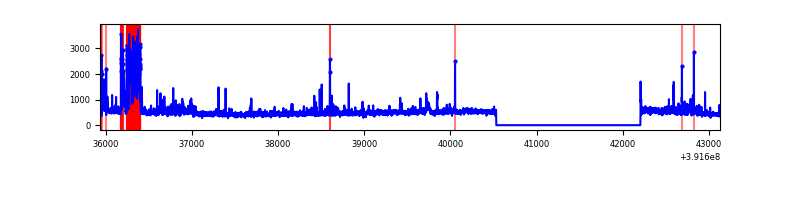 |
| C | 7194 | 5521 | 867 | 867 | 12.05% | 15.70% | 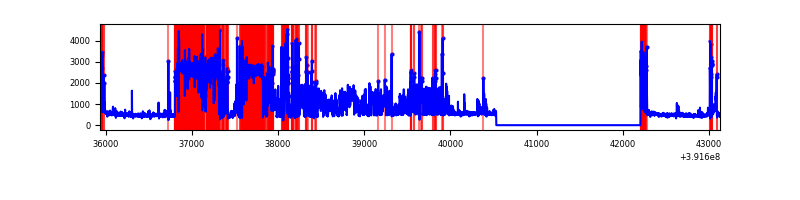 |
| D | 7194 | 5521 | 160 | 160 | 2.22% | 2.90% | 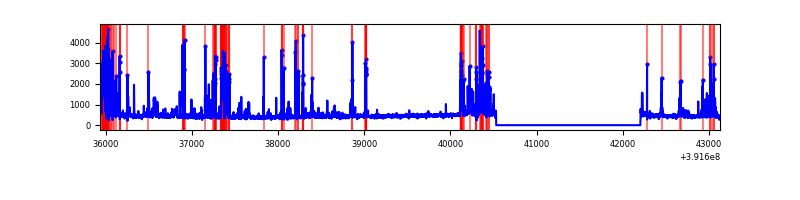 |
Top three noisy pixels from each quadrant. If the there are fewer than three noisy pixels in the level2.evt file, extra rows are filled as -1
| Pixel properties | Quadrant properties | ||||||
|---|---|---|---|---|---|---|---|
| Quadrant | DetID | PixID | Counts | Sigma | Mean | Median | Sigma |
| A | 10 | 83 | 180115 | 1389.87 | 627 | 614 | 129.1 |
| A | 9 | 143 | 18782 | 140.67 | 627 | 614 | 129.1 |
| A | 13 | 6 | 13197 | 97.43 | 627 | 614 | 129.1 |
| B | 5 | 172 | 352032 | 2920.35 | 620 | 604 | 120.3 |
| B | 0 | 213 | 127720 | 1056.33 | 620 | 604 | 120.3 |
| B | 0 | 190 | 79644 | 656.82 | 620 | 604 | 120.3 |
| C | 9 | 187 | 1903782 | 14461.2 | 558 | 561 | 131.6 |
| C | 15 | 208 | 1403011 | 10656.21 | 558 | 561 | 131.6 |
| C | 15 | 214 | 212706 | 1611.94 | 558 | 561 | 131.6 |
| D | 12 | 6 | 395503 | 2699.8 | 598 | 581 | 146.3 |
| D | 12 | 17 | 150536 | 1025.14 | 598 | 581 | 146.3 |
| D | 13 | 249 | 115348 | 784.58 | 598 | 581 | 146.3 |
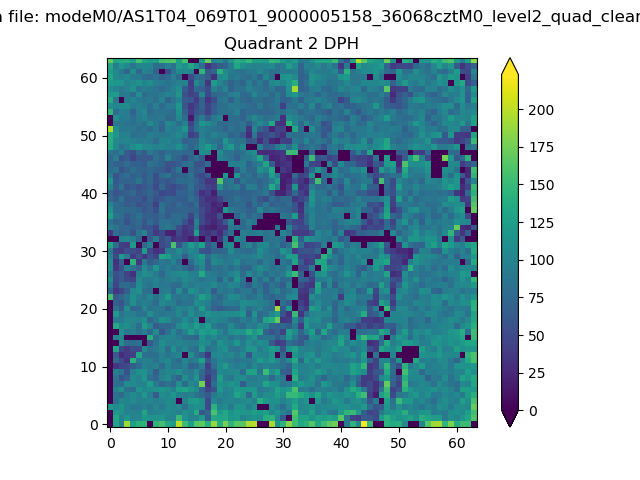
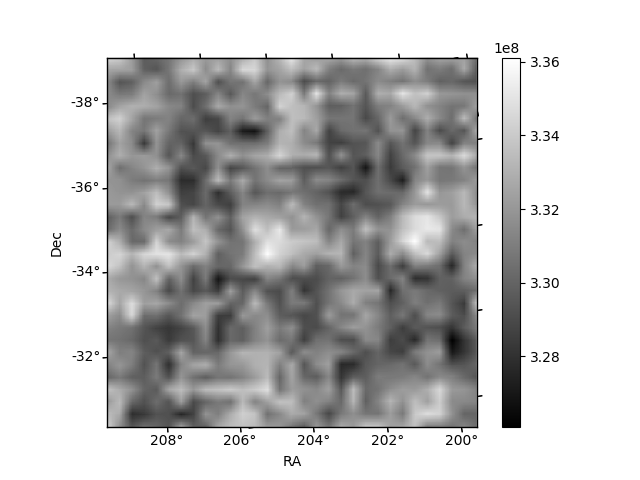
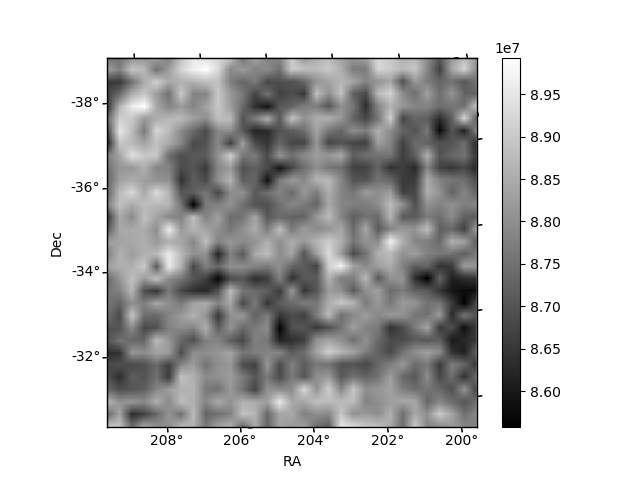
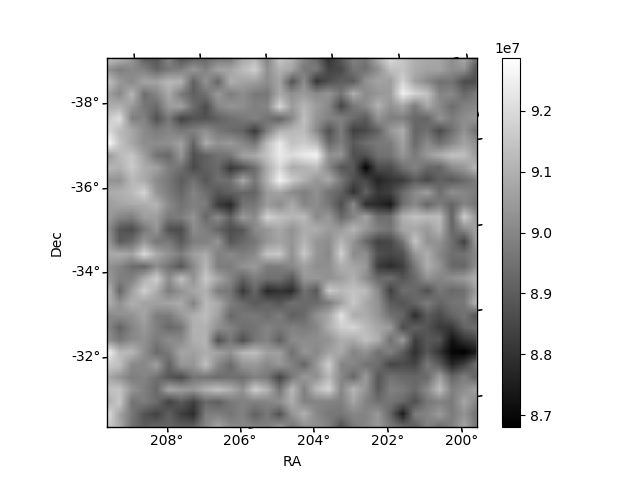
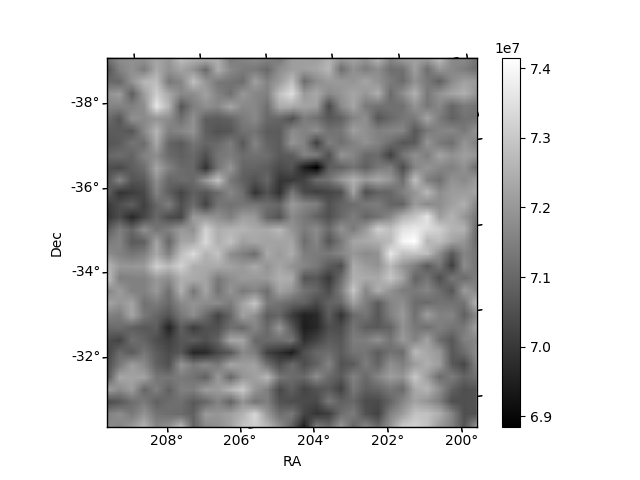
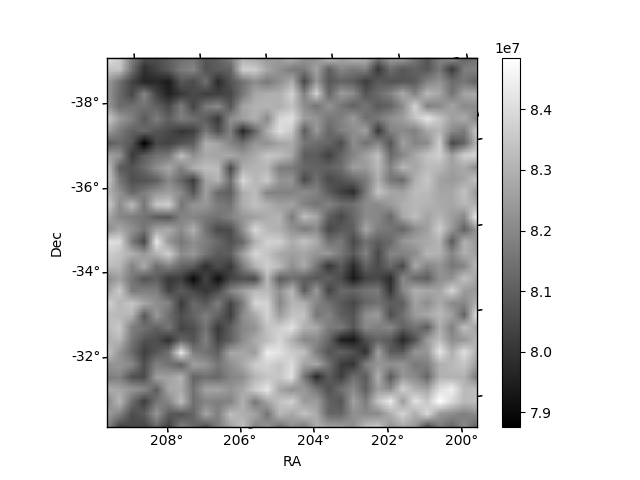
Histogram calculated using DETX and DETY for each event in the final _common_clean file
| Quadrant A | 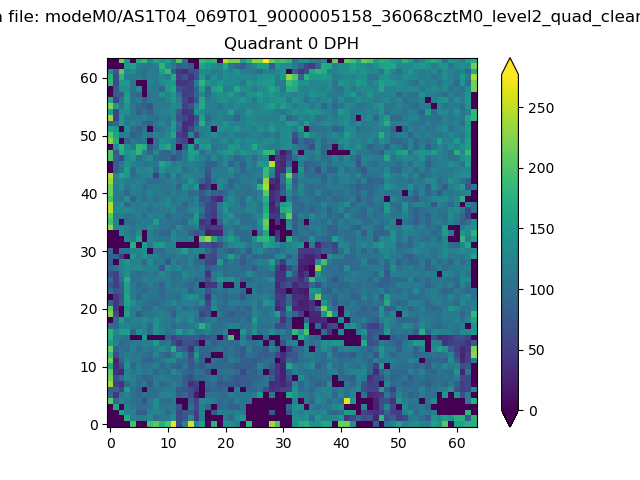 |
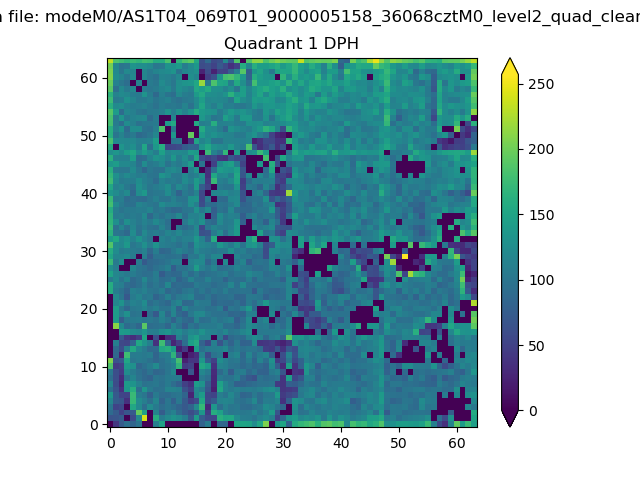 |
Quadrant B |
|---|---|---|---|
| Quadrant D | 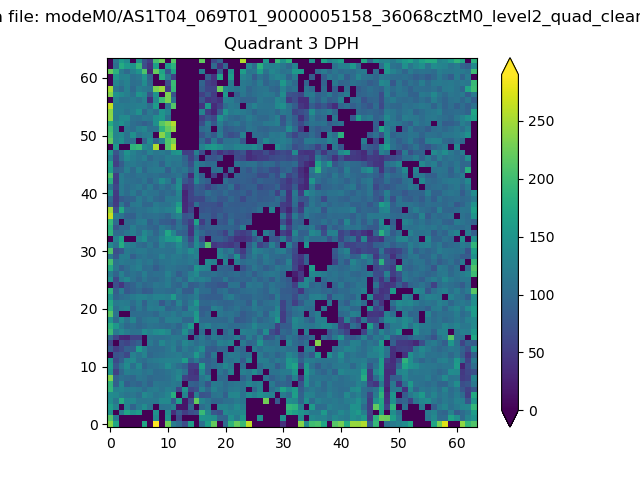 |
 |
Quadrant C |
| Plot type | Count rate plots | Images |
|---|---|---|
| Comparison with Poisson distribution Blue bars denote a histogram of data divided into 1 sec bins. Red curve is a Poisson curve with rate = median count rate of data. |
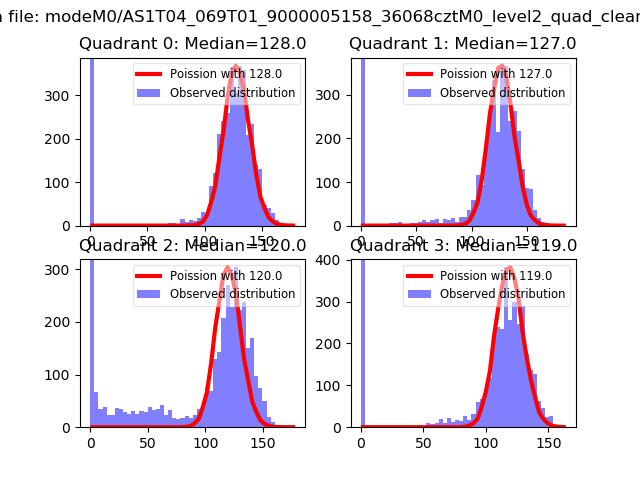 |
 |
| Quadrant-wise count rates Data is divided into 100 sec bins |
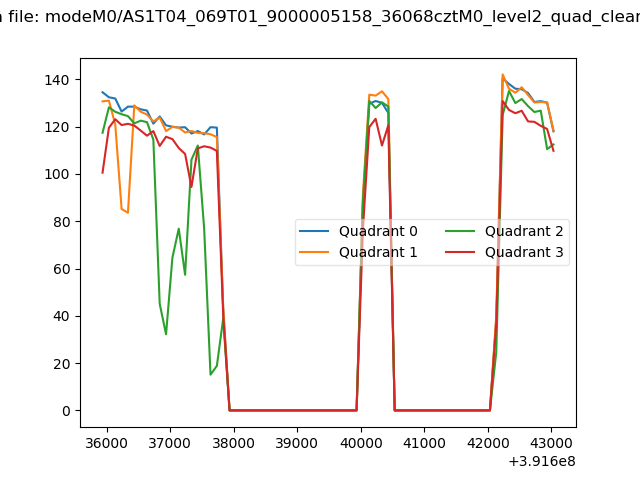 |
|
| Module-wise count rates for Quadrant A Data is divided into 100 sec bins |
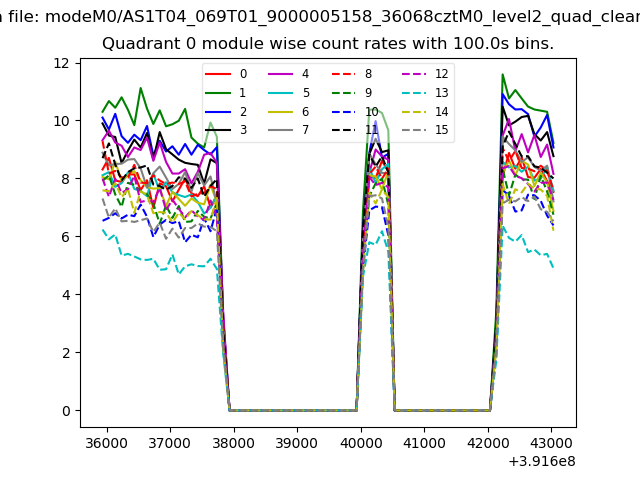 |
 |
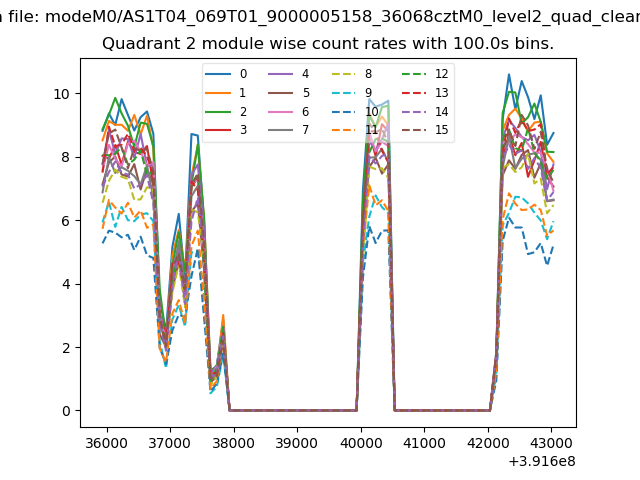
| Module-wise count rates for Quadrant B Data is divided into 100 sec bins |
 |
 |
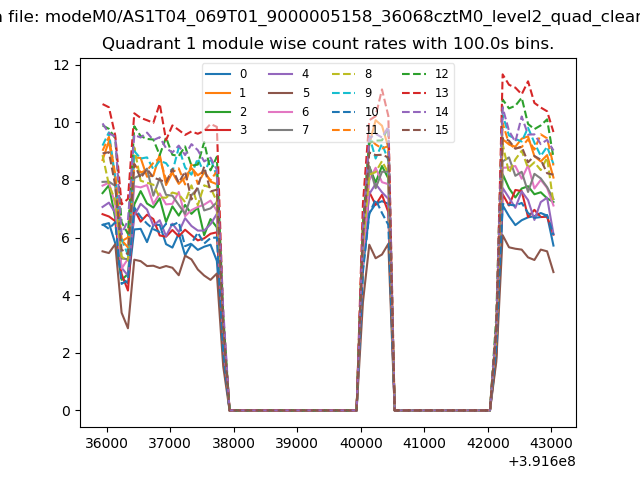
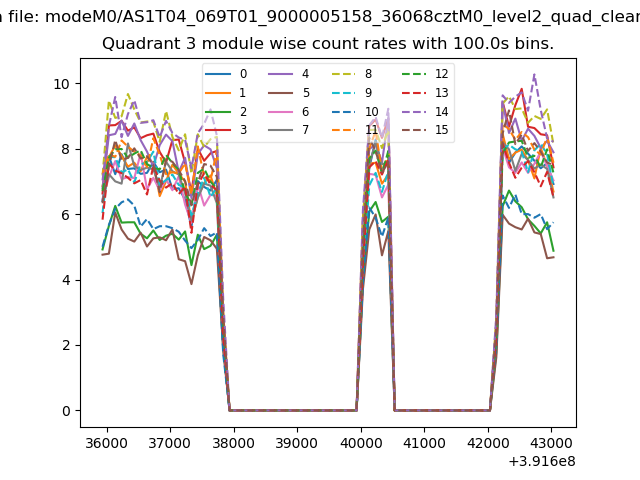
| Module-wise count rates for Quadrant C Data is divided into 100 sec bins |
 |
 |
| Module-wise count rates for Quadrant D Data is divided into 100 sec bins |
 |
 |
| Parameter | Plot |
|---|---|
| CZT HV Monitor | 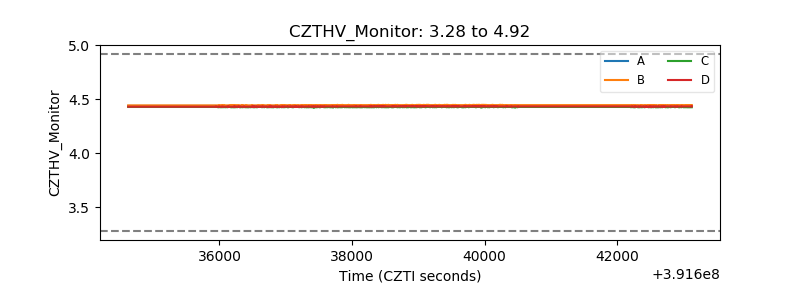 |
| D_VDD | 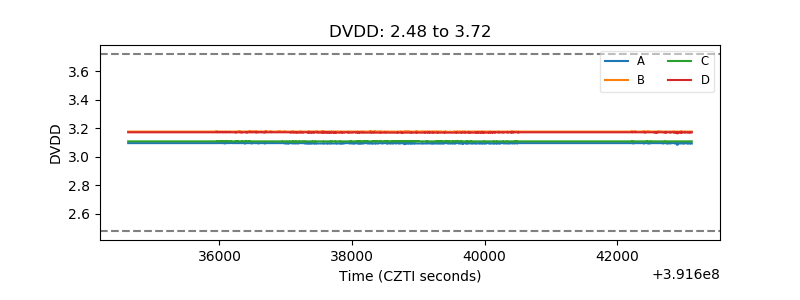 |
| Temperature 1 | 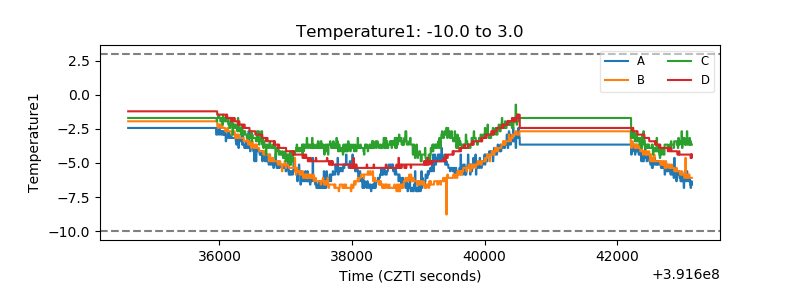 |
| Veto HV Monitor | 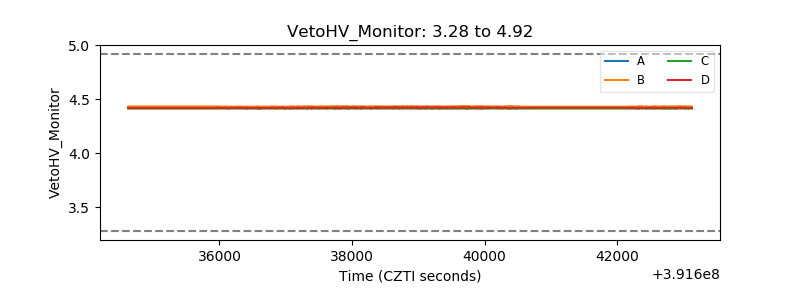 |
| Veto LLD | 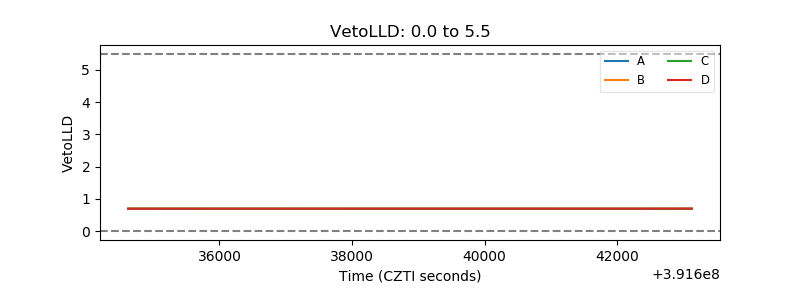 |
| Alpha Counter | 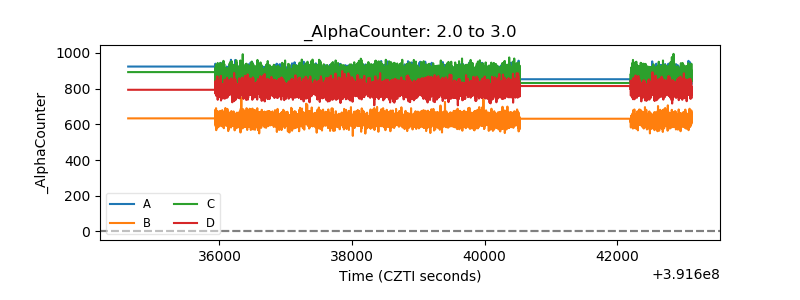 |
| _CPM_Rate | 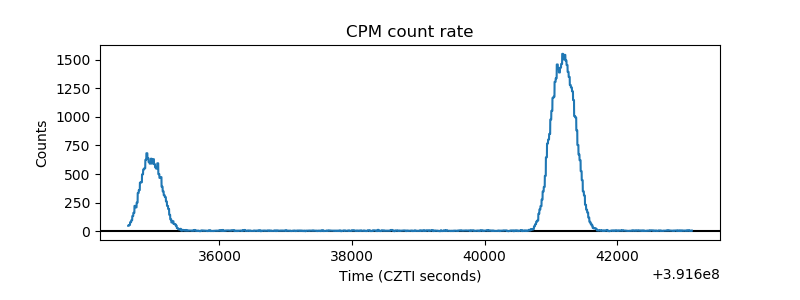 |
| CZT Counter | 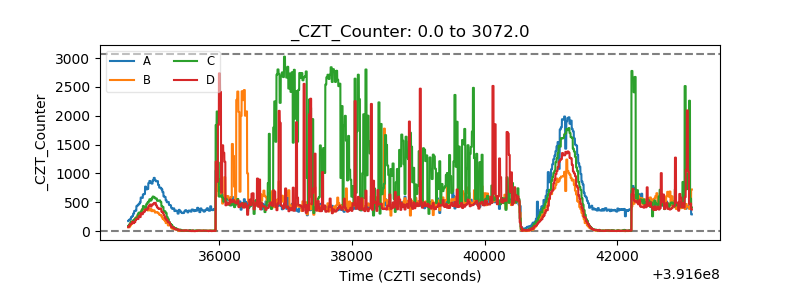 |
| +2.5 Volts monitor | 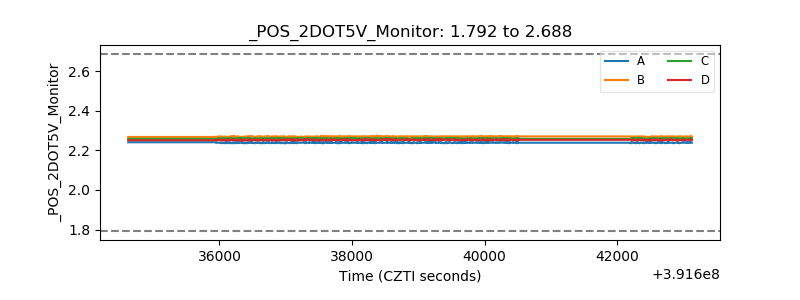 |
| +5 Volts monitor | 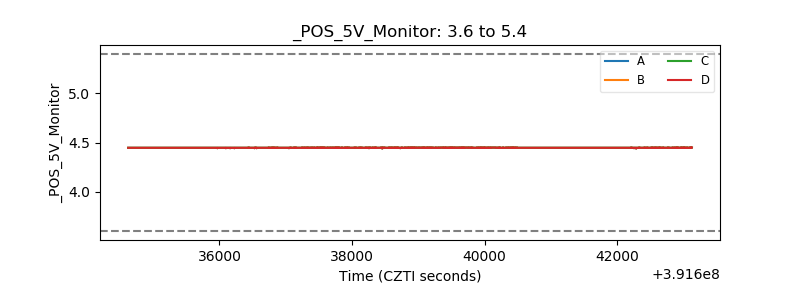 |
| _ROLL_ROT | 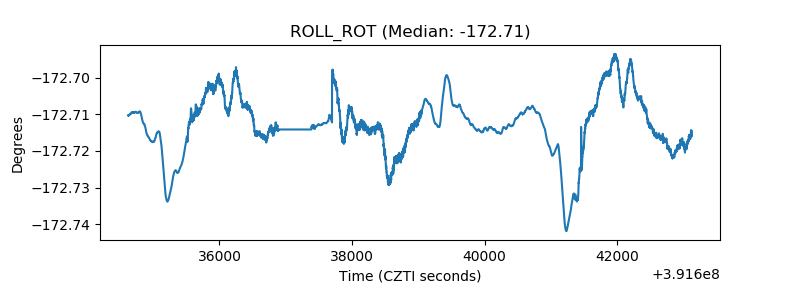 |
| _Roll_DEC | 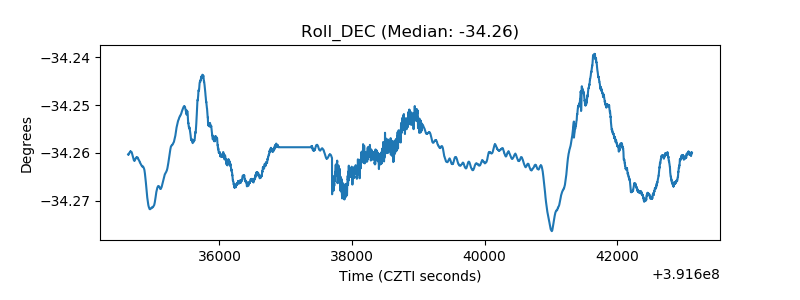 |
| _Roll_RA | 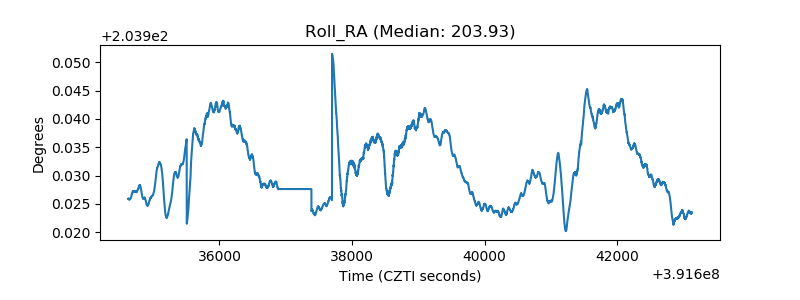 |
| Veto Counter | 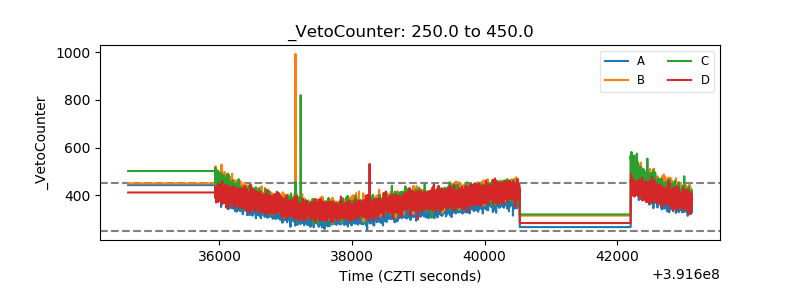 |