| Param | Original file | Final file |
|---|---|---|
| Filename | modeM0/AS1T04_069T01_9000005158_36067cztM0_level2.evt | modeM0/AS1T04_069T01_9000005158_36067cztM0_level2_quad_clean.evt |
| Size (bytes) | 972,915,840 | 95,313,600 |
| Size | 927.8 MB | 90.9 MB |
| Events in quadrant A | 4,412,682 | 617,465 |
| Events in quadrant B | 5,951,709 | 580,483 |
| Events in quadrant C | 12,147,299 | 480,473 |
| Events in quadrant D | 6,327,093 | 563,550 |
| Mode M0 | |||
|---|---|---|---|
| Quadrant | BADHDUFLAG | Total packets | Discarded packets |
| A | 0 | 19220 | 3 |
| B | 0 | 23736 | 6 |
| C | 0 | 42360 | 2 |
| D | 0 | 25232 | 2 |
| Mode M9 | |||
|---|---|---|---|
| Quadrant | BADHDUFLAG | Total packets | Discarded packets |
| A | 0 | 30 | 0 |
| B | 0 | 30 | 0 |
| C | 0 | 30 | 0 |
| D | 0 | 30 | 0 |
| Mode SS | |||
|---|---|---|---|
| Quadrant | BADHDUFLAG | Total packets | Discarded packets |
| A | 0 | 188 | 0 |
| B | 0 | 188 | 0 |
| C | 0 | 188 | 0 |
| D | 0 | 188 | 0 |
| Quadrant | Total seconds | Saturated seconds | Saturation percentage |
|---|---|---|---|
| A | 9280 | 16 | 0.172414% |
| B | 9278 | 489 | 5.270532% |
| C | 9280 | 2883 | 31.066810% |
| D | 9280 | 478 | 5.150862% |
Noise dominated data is calculated using 1-second bins in cleaned event files. If a bin has >2000 counts, and if more than 50% of those come from <1% of pixels, then it is considered to be noise-dominated and hence unusable.
| Quadrant | # 1 sec bins | Bins with >0 counts | Bins with >2000 counts | High rate bins dominated by noise | Noise dominated (total time) | Noise dominated (detector-on time) | Marked lightcurve |
|---|---|---|---|---|---|---|---|
| A | 12265 | 9282 | 4 | 4 | 0.03% | 0.04% | 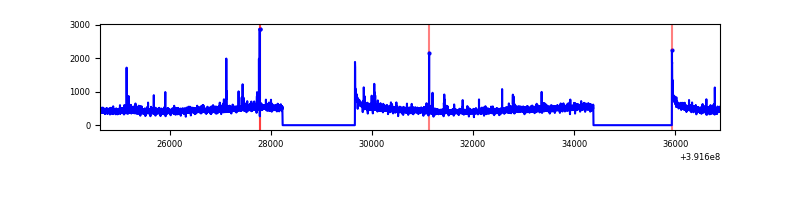 |
| B | 12265 | 9281 | 353 | 353 | 2.88% | 3.80% |  |
| C | 12264 | 9281 | 2509 | 2509 | 20.46% | 27.03% | 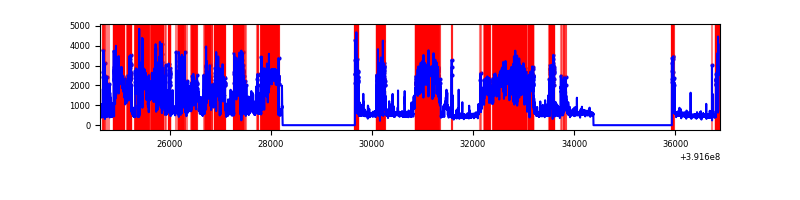 |
| D | 12265 | 9282 | 451 | 451 | 3.68% | 4.86% |  |
Top three noisy pixels from each quadrant. If the there are fewer than three noisy pixels in the level2.evt file, extra rows are filled as -1
| Pixel properties | Quadrant properties | ||||||
|---|---|---|---|---|---|---|---|
| Quadrant | DetID | PixID | Counts | Sigma | Mean | Median | Sigma |
| A | 10 | 83 | 244985 | 1143.87 | 1051 | 1029 | 213.3 |
| A | 9 | 143 | 51043 | 234.51 | 1051 | 1029 | 213.3 |
| A | 12 | 189 | 30660 | 138.93 | 1051 | 1029 | 213.3 |
| B | 5 | 172 | 994423 | 5058.54 | 1020 | 990 | 196.4 |
| B | 5 | 236 | 332433 | 1687.7 | 1020 | 990 | 196.4 |
| B | 0 | 213 | 197181 | 999.0 | 1020 | 990 | 196.4 |
| C | 9 | 187 | 7035633 | 35504.78 | 851 | 858 | 198.1 |
| C | 4 | 254 | 554387 | 2793.68 | 851 | 858 | 198.1 |
| C | 15 | 208 | 436783 | 2200.13 | 851 | 858 | 198.1 |
| D | 12 | 17 | 750984 | 3032.3 | 999 | 969 | 247.3 |
| D | 12 | 6 | 404218 | 1630.33 | 999 | 969 | 247.3 |
| D | 1 | 52 | 349794 | 1410.29 | 999 | 969 | 247.3 |
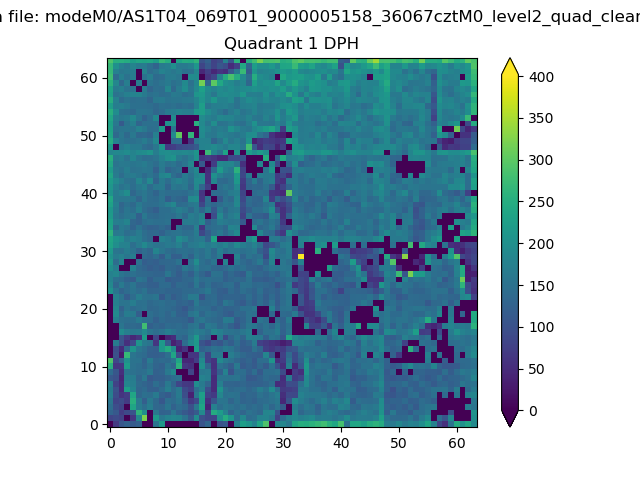
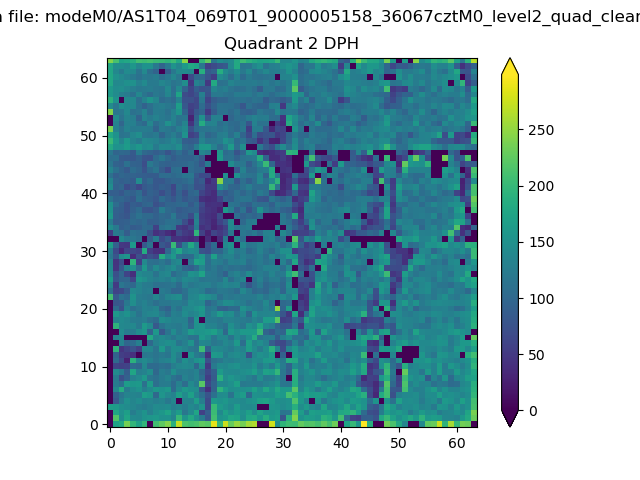
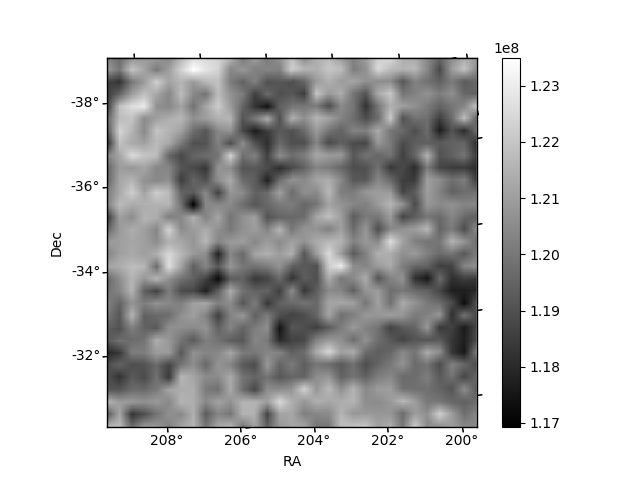
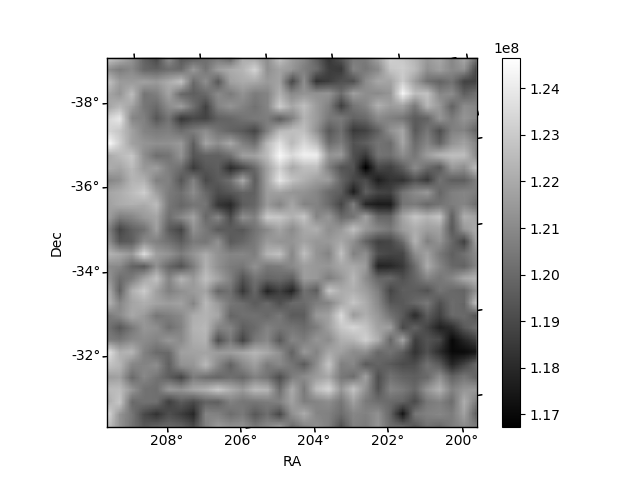
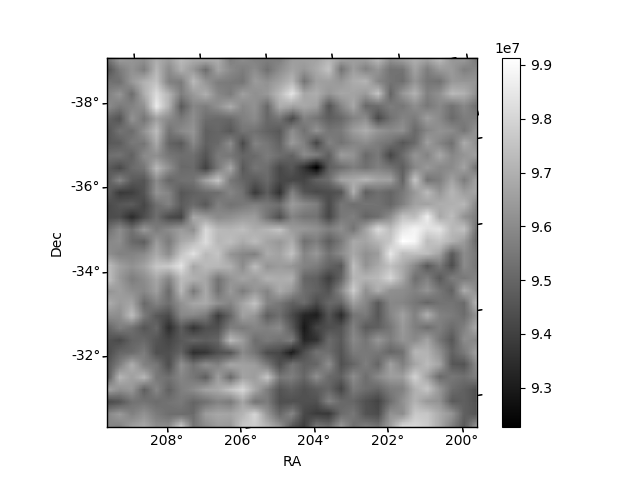
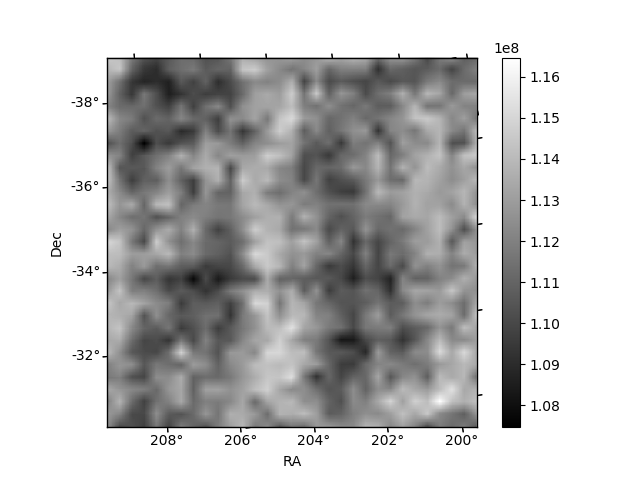
Histogram calculated using DETX and DETY for each event in the final _common_clean file
| Quadrant A | 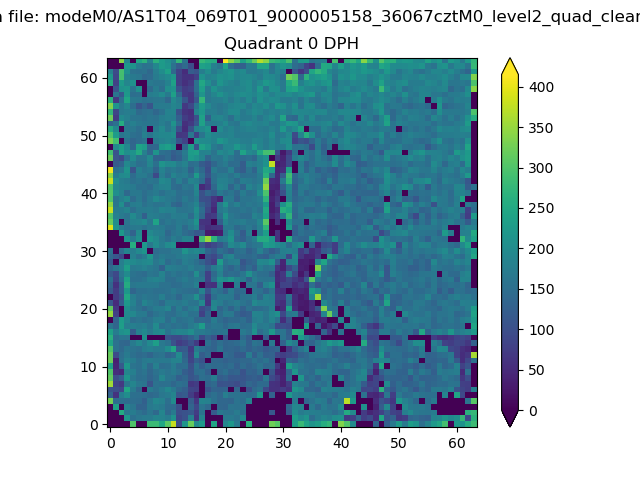 |
 |
Quadrant B |
|---|---|---|---|
| Quadrant D | 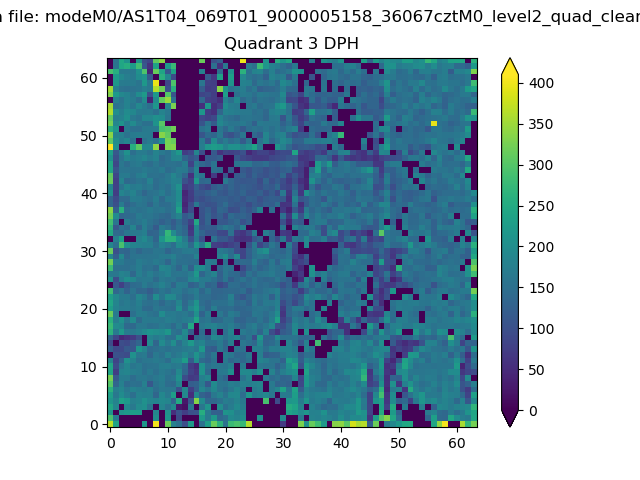 |
 |
Quadrant C |
| Plot type | Count rate plots | Images |
|---|---|---|
| Comparison with Poisson distribution Blue bars denote a histogram of data divided into 1 sec bins. Red curve is a Poisson curve with rate = median count rate of data. |
 |
 |
| Quadrant-wise count rates Data is divided into 100 sec bins |
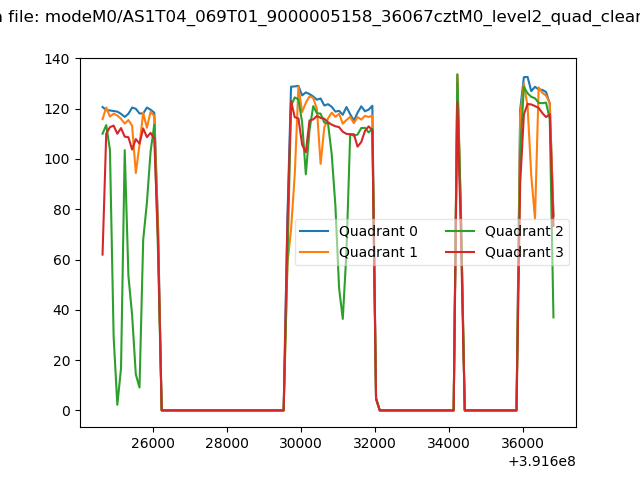 |
|
| Module-wise count rates for Quadrant A Data is divided into 100 sec bins |
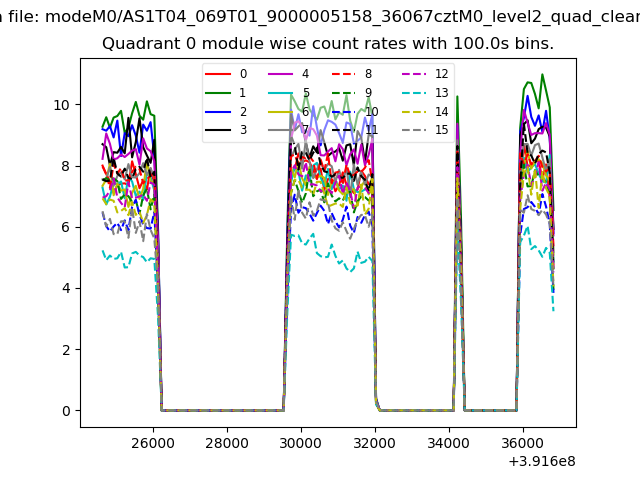 |
 |
| Module-wise count rates for Quadrant B Data is divided into 100 sec bins |
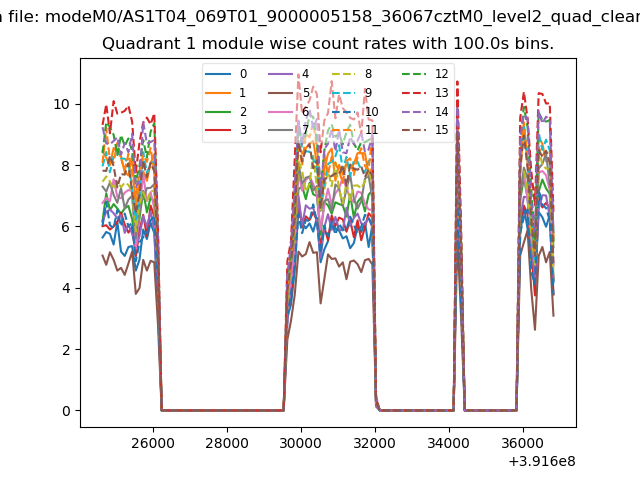 |
 |
| Module-wise count rates for Quadrant C Data is divided into 100 sec bins |
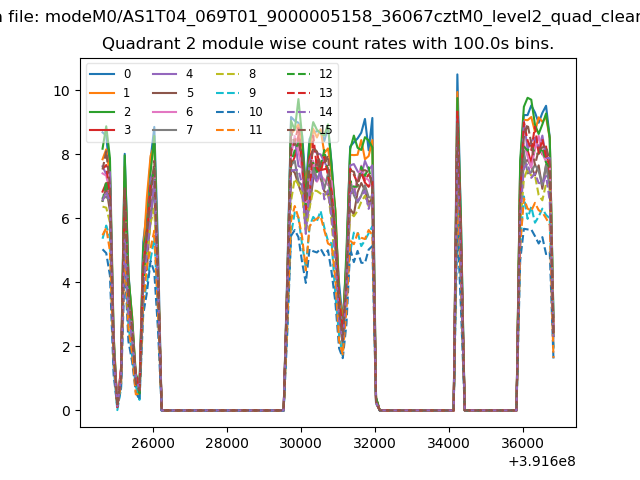 |
 |
| Module-wise count rates for Quadrant D Data is divided into 100 sec bins |
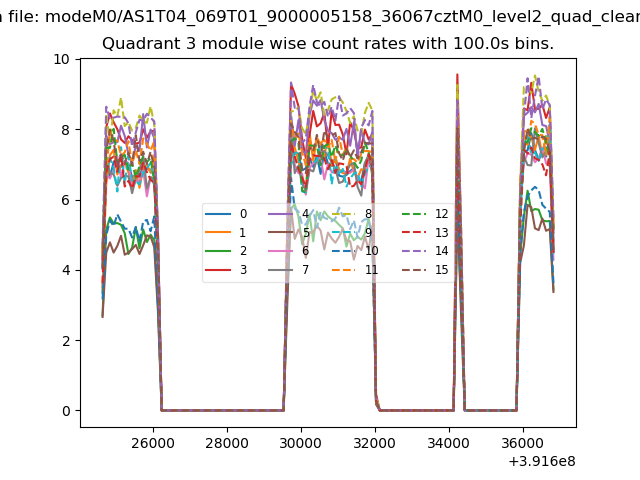 |
 |
| Parameter | Plot |
|---|---|
| CZT HV Monitor | 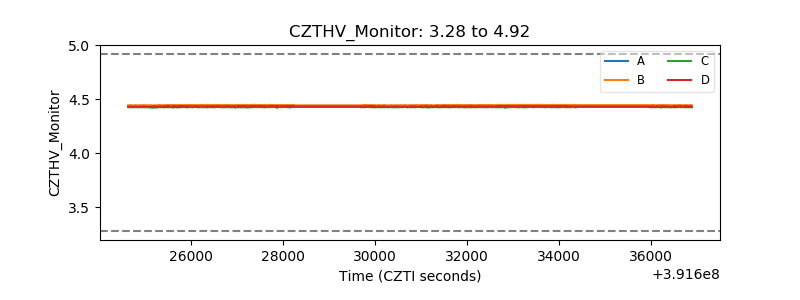 |
| D_VDD | 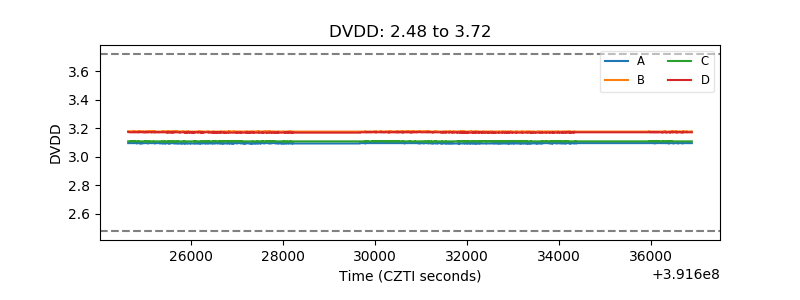 |
| Temperature 1 | 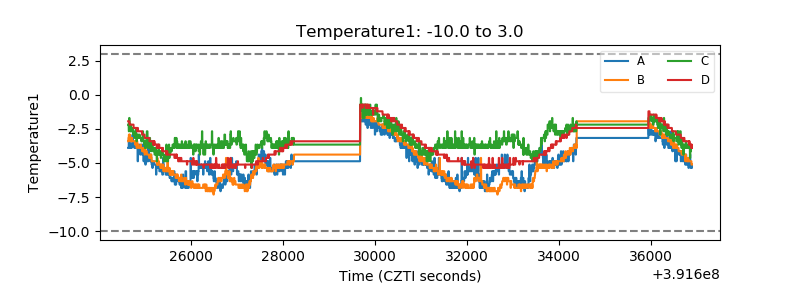 |
| Veto HV Monitor | 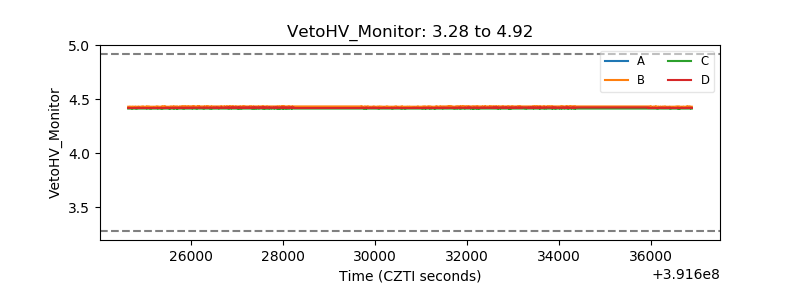 |
| Veto LLD | 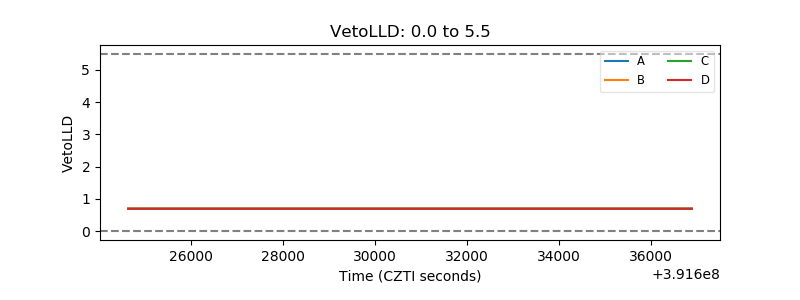 |
| Alpha Counter | 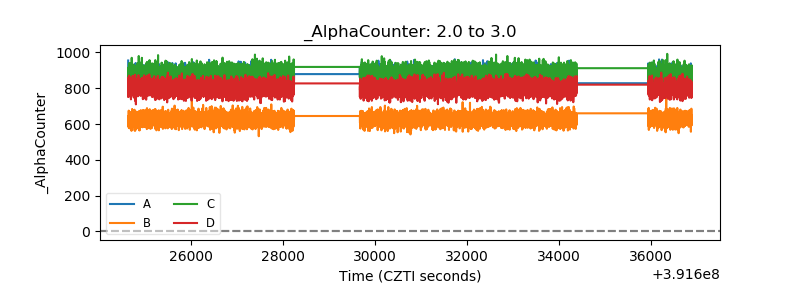 |
| _CPM_Rate | 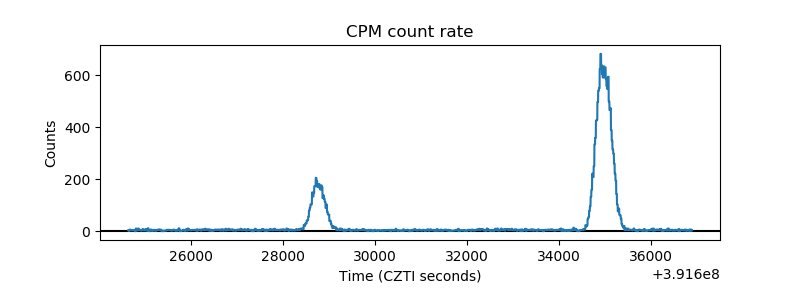 |
| CZT Counter | 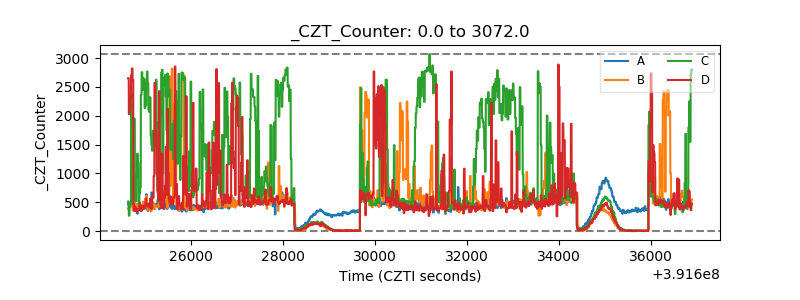 |
| +2.5 Volts monitor | 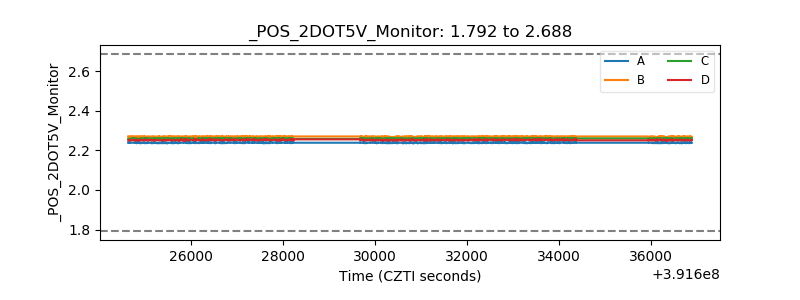 |
| +5 Volts monitor | 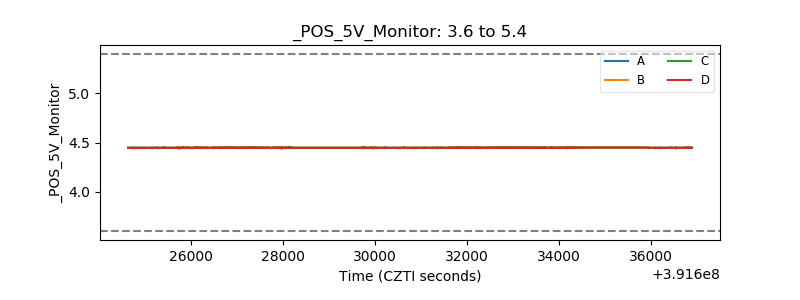 |
| _ROLL_ROT | 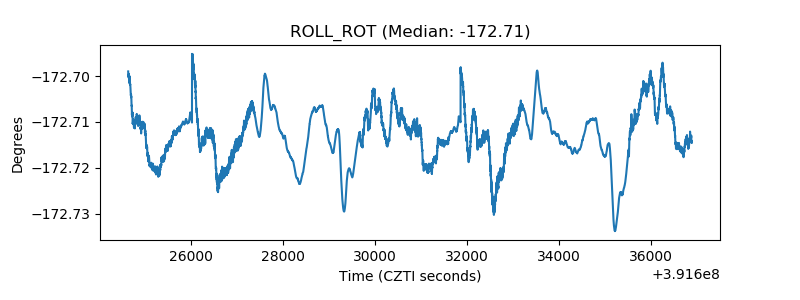 |
| _Roll_DEC | 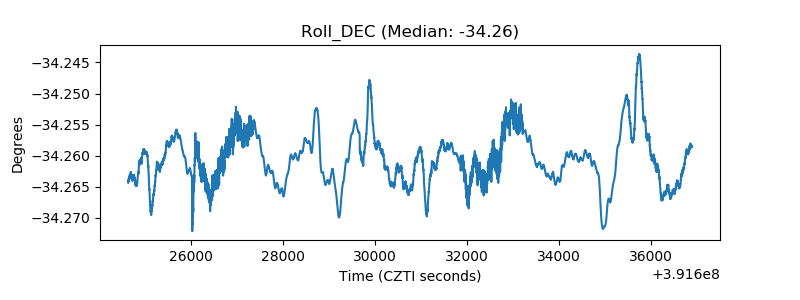 |
| _Roll_RA | 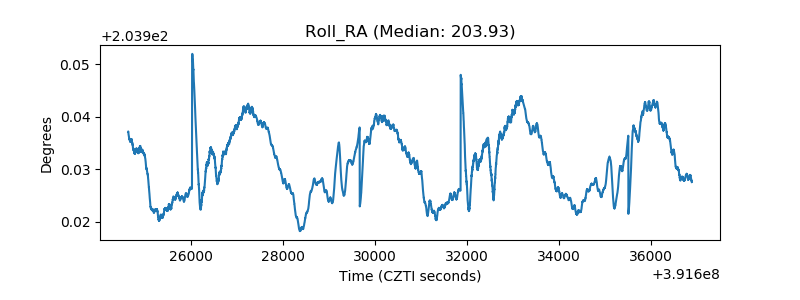 |
| Veto Counter | 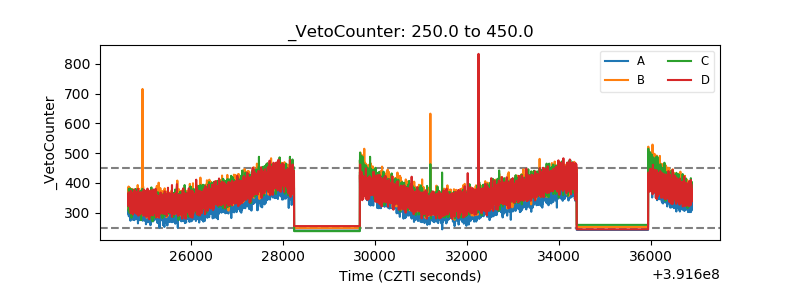 |