| Param | Original file | Final file |
|---|---|---|
| Filename | modeM0/AS1T04_069T01_9000005158_36066cztM0_level2.evt | modeM0/AS1T04_069T01_9000005158_36066cztM0_level2_quad_clean.evt |
| Size (bytes) | 658,609,920 | 90,190,080 |
| Size | 628.1 MB | 86.0 MB |
| Events in quadrant A | 3,204,507 | 624,303 |
| Events in quadrant B | 3,948,511 | 602,755 |
| Events in quadrant C | 8,005,827 | 477,596 |
| Events in quadrant D | 4,331,458 | 556,807 |
| Mode M0 | |||
|---|---|---|---|
| Quadrant | BADHDUFLAG | Total packets | Discarded packets |
| A | 0 | 14463 | 484 |
| B | 0 | 16761 | 677 |
| C | 0 | 30294 | 2101 |
| D | 0 | 18950 | 1556 |
| Mode M9 | |||
|---|---|---|---|
| Quadrant | BADHDUFLAG | Total packets | Discarded packets |
| A | 0 | 13 | 0 |
| B | 0 | 13 | 0 |
| C | 0 | 13 | 0 |
| D | 0 | 13 | 0 |
| Mode SS | |||
|---|---|---|---|
| Quadrant | BADHDUFLAG | Total packets | Discarded packets |
| A | 0 | 146 | 2 |
| B | 0 | 145 | 3 |
| C | 0 | 143 | 7 |
| D | 0 | 146 | 2 |
| Quadrant | Total seconds | Saturated seconds | Saturation percentage |
|---|---|---|---|
| A | 6790 | 9 | 0.132548% |
| B | 6766 | 231 | 3.414129% |
| C | 6609 | 1919 | 29.036163% |
| D | 6667 | 241 | 3.614819% |
Noise dominated data is calculated using 1-second bins in cleaned event files. If a bin has >2000 counts, and if more than 50% of those come from <1% of pixels, then it is considered to be noise-dominated and hence unusable.
| Quadrant | # 1 sec bins | Bins with >0 counts | Bins with >2000 counts | High rate bins dominated by noise | Noise dominated (total time) | Noise dominated (detector-on time) | Marked lightcurve |
|---|---|---|---|---|---|---|---|
| A | 8428 | 6957 | 2 | 2 | 0.02% | 0.03% | 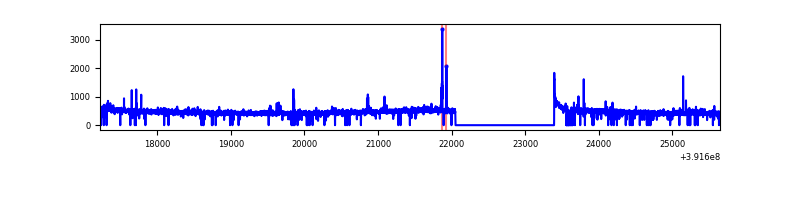 |
| B | 8430 | 6957 | 163 | 163 | 1.93% | 2.34% | 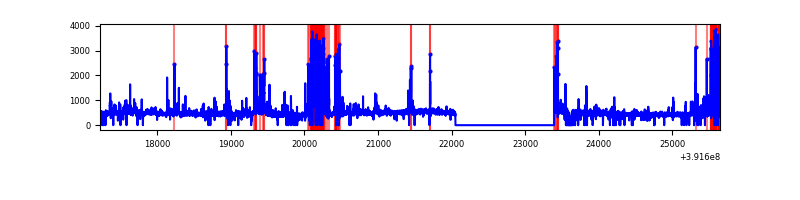 |
| C | 8429 | 6862 | 1480 | 1480 | 17.56% | 21.57% | 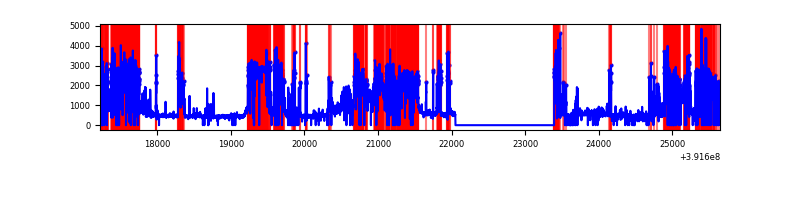 |
| D | 8427 | 6883 | 229 | 229 | 2.72% | 3.33% | 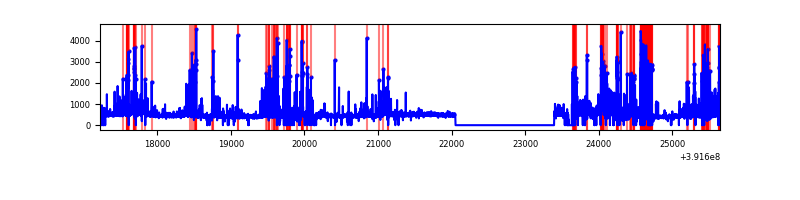 |
Top three noisy pixels from each quadrant. If the there are fewer than three noisy pixels in the level2.evt file, extra rows are filled as -1
| Pixel properties | Quadrant properties | ||||||
|---|---|---|---|---|---|---|---|
| Quadrant | DetID | PixID | Counts | Sigma | Mean | Median | Sigma |
| A | 10 | 83 | 175435 | 1119.65 | 765 | 749 | 156.0 |
| A | 9 | 143 | 49281 | 311.06 | 765 | 749 | 156.0 |
| A | 13 | 6 | 13672 | 82.83 | 765 | 749 | 156.0 |
| B | 5 | 236 | 717890 | 4977.92 | 744 | 725 | 144.1 |
| B | 5 | 172 | 75463 | 518.76 | 744 | 725 | 144.1 |
| B | 5 | 255 | 56220 | 385.2 | 744 | 725 | 144.1 |
| C | 9 | 187 | 4734711 | 32856.96 | 609 | 612 | 144.1 |
| C | 15 | 208 | 454863 | 3152.72 | 609 | 612 | 144.1 |
| C | 15 | 214 | 234711 | 1624.76 | 609 | 612 | 144.1 |
| D | 1 | 52 | 355481 | 2017.7 | 712 | 693 | 175.8 |
| D | 12 | 6 | 298897 | 1695.9 | 712 | 693 | 175.8 |
| D | 12 | 17 | 236150 | 1339.06 | 712 | 693 | 175.8 |
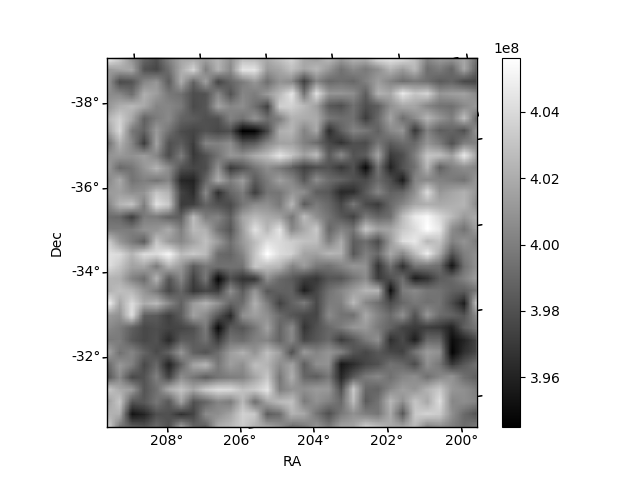
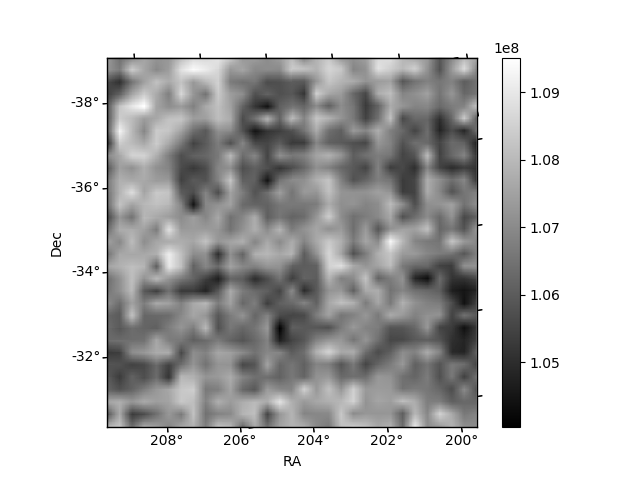
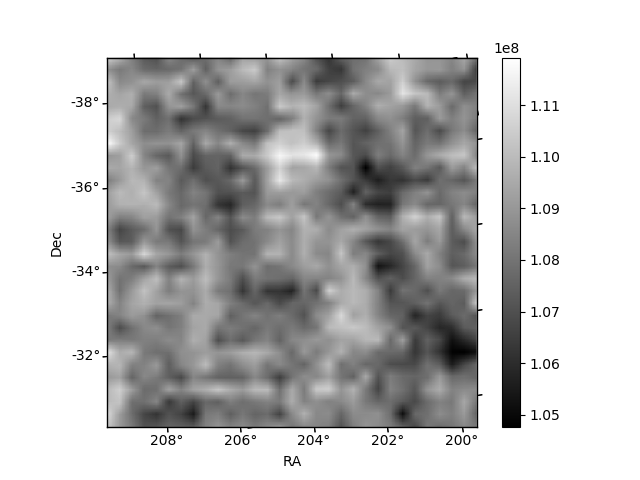
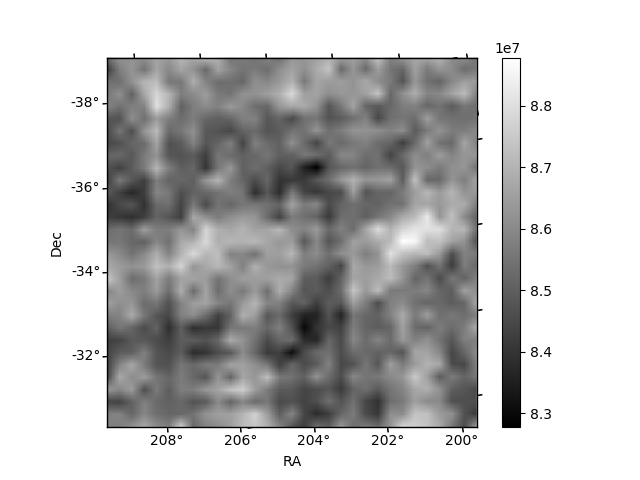
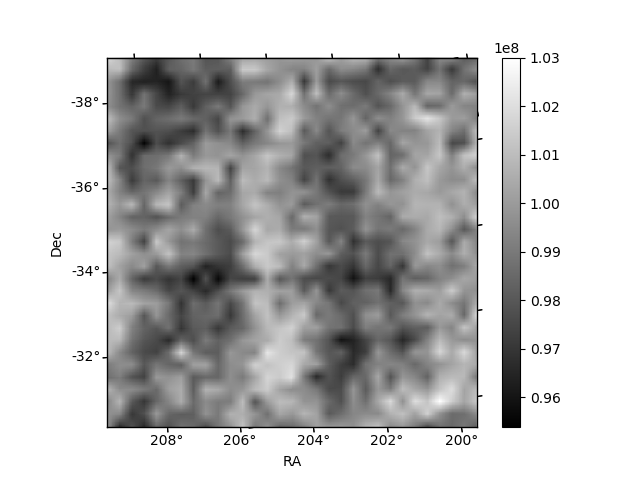
Histogram calculated using DETX and DETY for each event in the final _common_clean file
| Quadrant A | 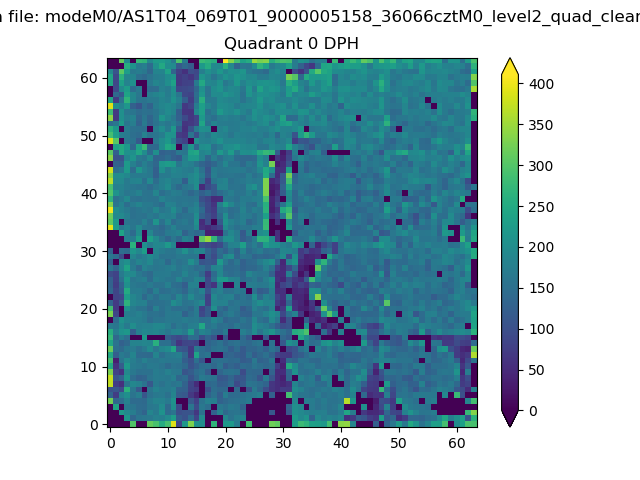 |
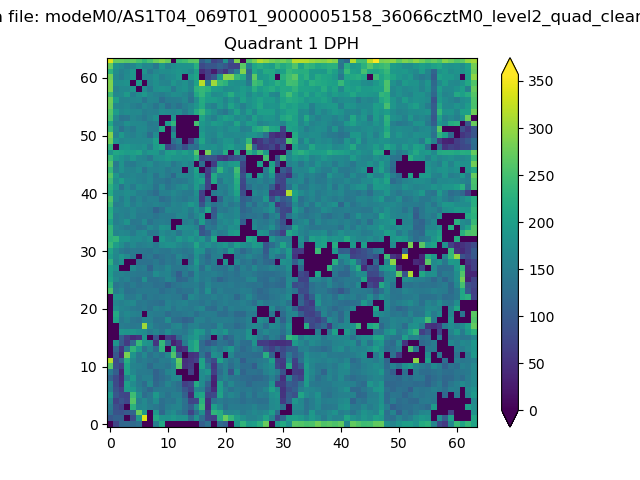 |
Quadrant B |
|---|---|---|---|
| Quadrant D | 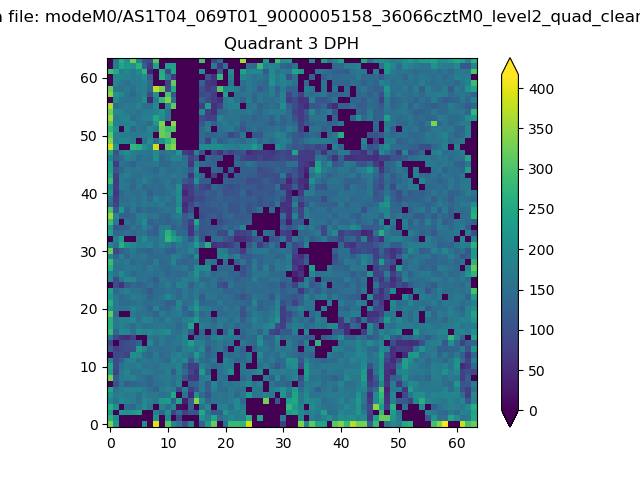 |
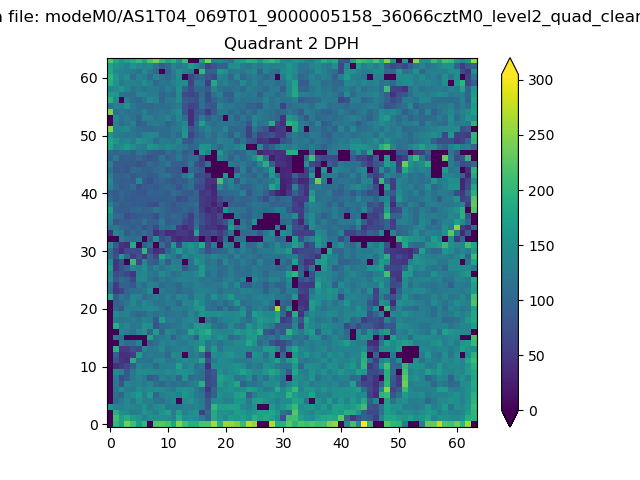 |
Quadrant C |
| Plot type | Count rate plots | Images |
|---|---|---|
| Comparison with Poisson distribution Blue bars denote a histogram of data divided into 1 sec bins. Red curve is a Poisson curve with rate = median count rate of data. |
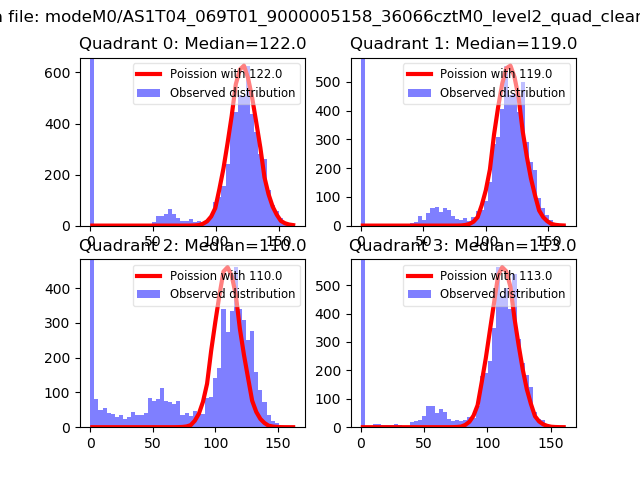 |
 |
| Quadrant-wise count rates Data is divided into 100 sec bins |
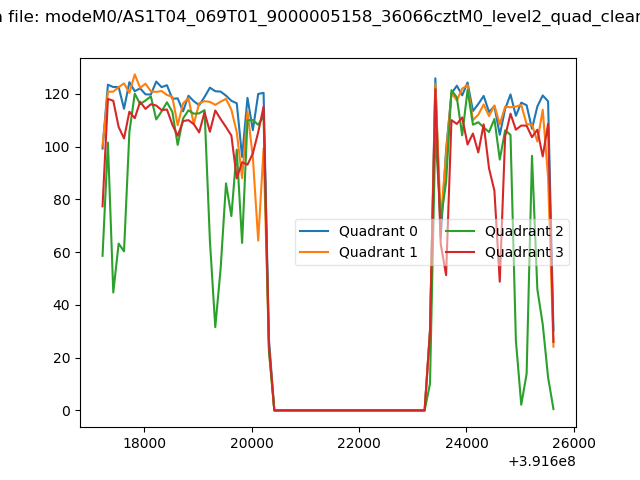 |
|
| Module-wise count rates for Quadrant A Data is divided into 100 sec bins |
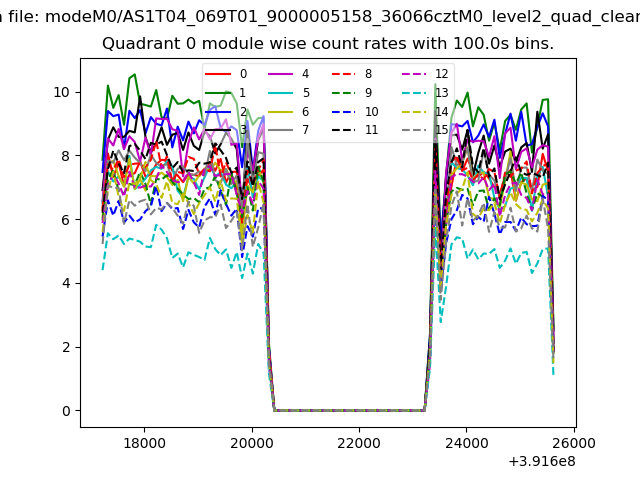 |
 |
| Module-wise count rates for Quadrant B Data is divided into 100 sec bins |
 |
 |
| Module-wise count rates for Quadrant C Data is divided into 100 sec bins |
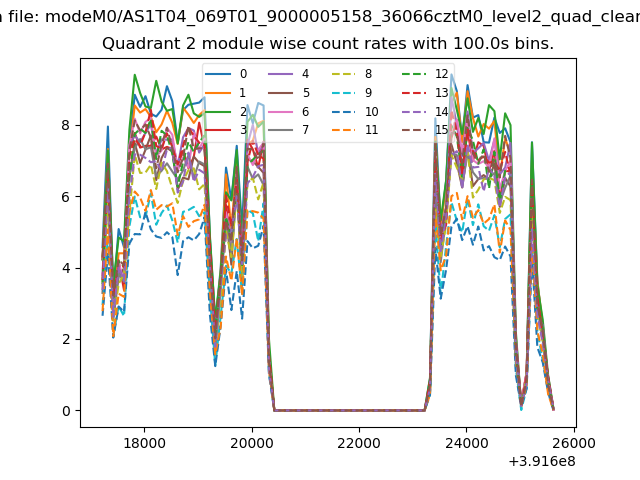 |
 |
| Module-wise count rates for Quadrant D Data is divided into 100 sec bins |
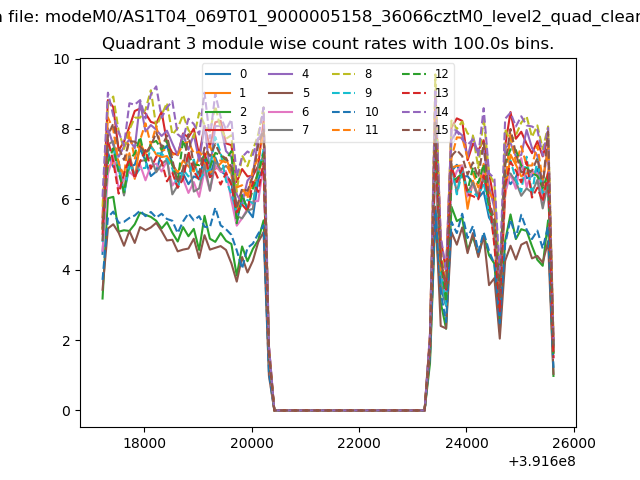 |
 |
| Parameter | Plot |
|---|---|
| CZT HV Monitor | 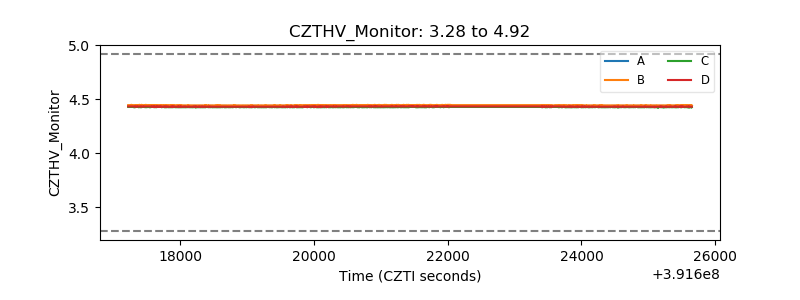 |
| D_VDD | 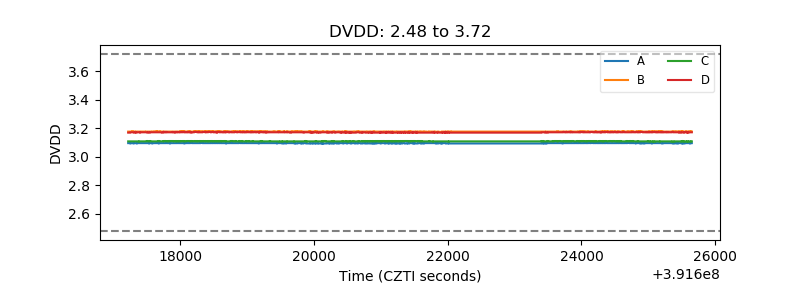 |
| Temperature 1 | 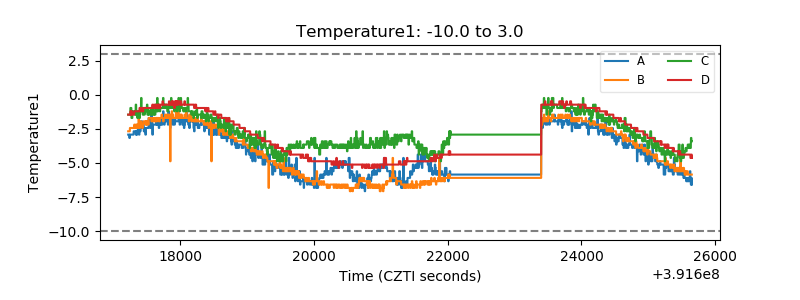 |
| Veto HV Monitor | 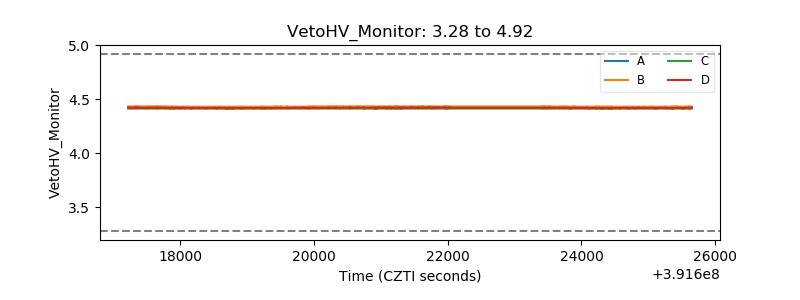 |
| Veto LLD | 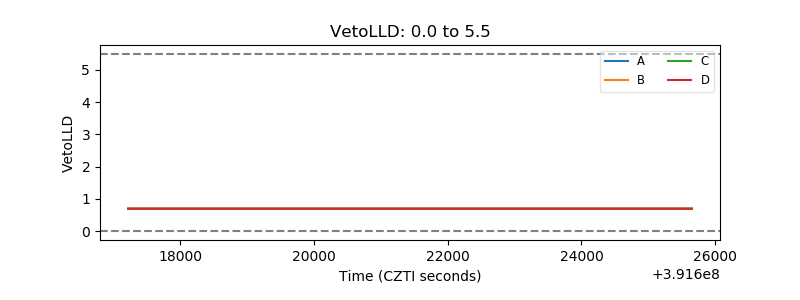 |
| Alpha Counter | 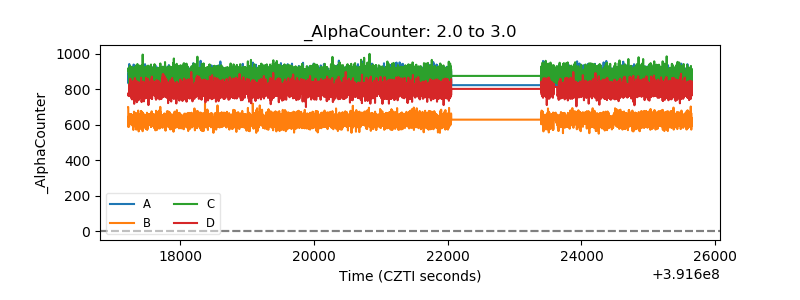 |
| _CPM_Rate | 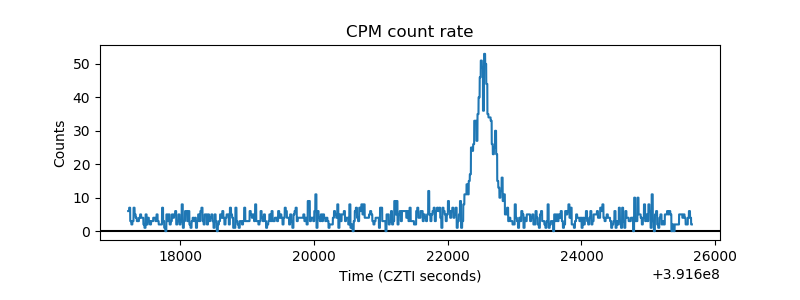 |
| CZT Counter | 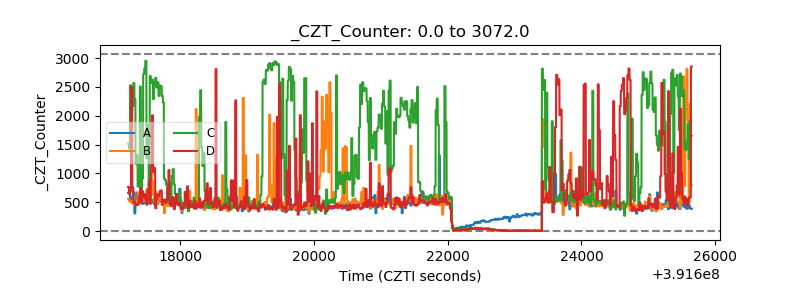 |
| +2.5 Volts monitor | 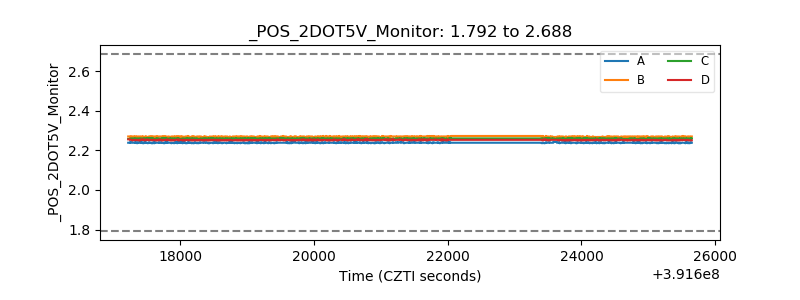 |
| +5 Volts monitor | 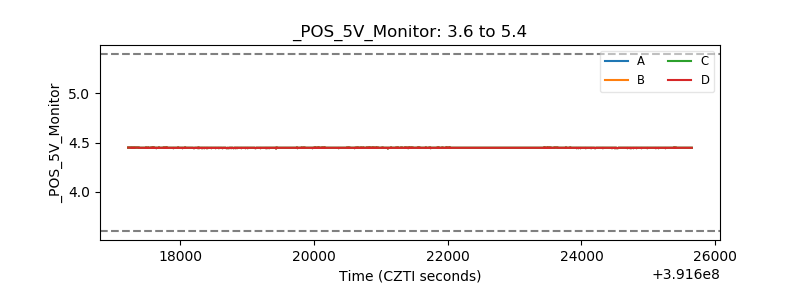 |
| _ROLL_ROT | 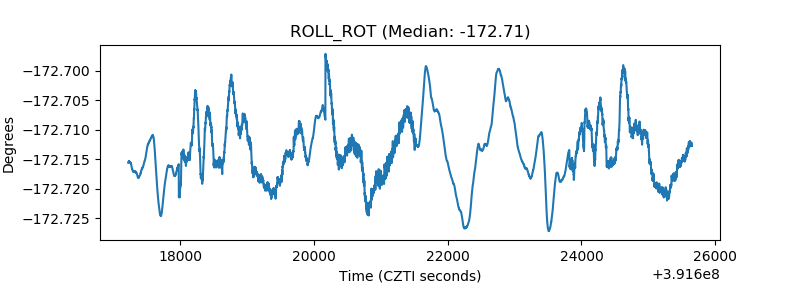 |
| _Roll_DEC | 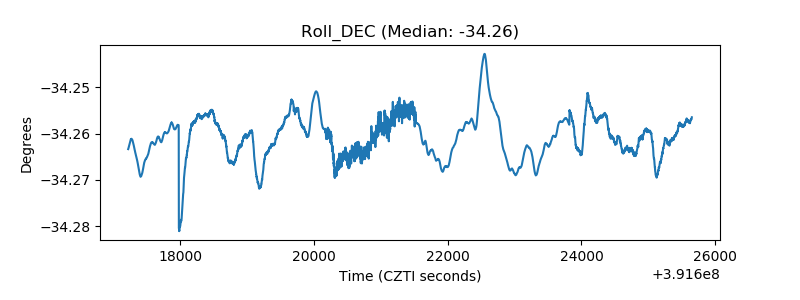 |
| _Roll_RA | 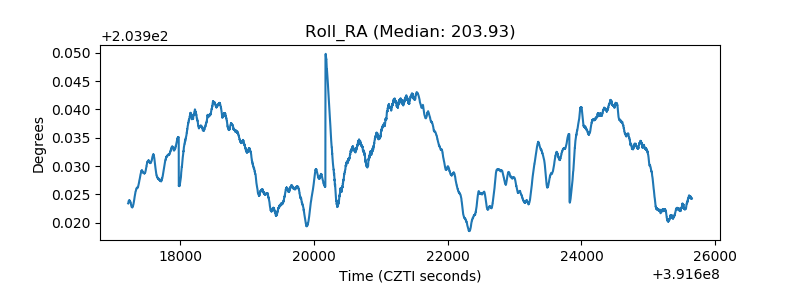 |
| Veto Counter | 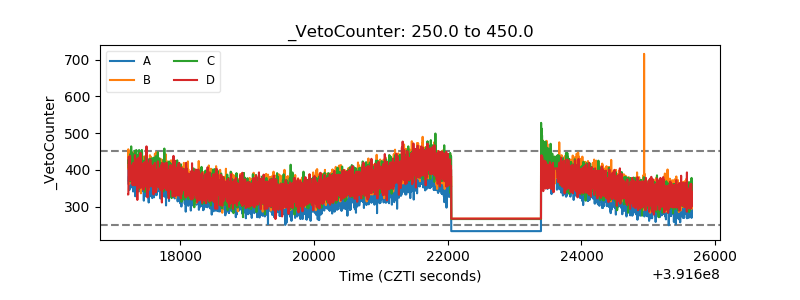 |