| Param | Original file | Final file |
|---|---|---|
| Filename | modeM0/AS1T04_069T01_9000005158_36064cztM0_level2.evt | modeM0/AS1T04_069T01_9000005158_36064cztM0_level2_quad_clean.evt |
| Size (bytes) | 818,046,720 | 78,168,960 |
| Size | 780.2 MB | 74.5 MB |
| Events in quadrant A | 2,918,016 | 569,267 |
| Events in quadrant B | 5,841,247 | 536,102 |
| Events in quadrant C | 10,120,557 | 334,565 |
| Events in quadrant D | 5,490,987 | 507,177 |
| Mode M0 | |||
|---|---|---|---|
| Quadrant | BADHDUFLAG | Total packets | Discarded packets |
| A | 0 | 12442 | 3 |
| B | 0 | 21309 | 2 |
| C | 0 | 34164 | 2 |
| D | 0 | 20356 | 2 |
| Mode M9 | |||
|---|---|---|---|
| Quadrant | BADHDUFLAG | Total packets | Discarded packets |
| A | 0 | 13 | 0 |
| B | 0 | 13 | 0 |
| C | 0 | 13 | 0 |
| D | 0 | 14 | 0 |
| Mode SS | |||
|---|---|---|---|
| Quadrant | BADHDUFLAG | Total packets | Discarded packets |
| A | 0 | 122 | 0 |
| B | 0 | 122 | 0 |
| C | 0 | 122 | 0 |
| D | 0 | 122 | 0 |
| Quadrant | Total seconds | Saturated seconds | Saturation percentage |
|---|---|---|---|
| A | 5988 | 12 | 0.200401% |
| B | 5988 | 993 | 16.583166% |
| C | 5988 | 2986 | 49.866399% |
| D | 5988 | 609 | 10.170341% |
Noise dominated data is calculated using 1-second bins in cleaned event files. If a bin has >2000 counts, and if more than 50% of those come from <1% of pixels, then it is considered to be noise-dominated and hence unusable.
| Quadrant | # 1 sec bins | Bins with >0 counts | Bins with >2000 counts | High rate bins dominated by noise | Noise dominated (total time) | Noise dominated (detector-on time) | Marked lightcurve |
|---|---|---|---|---|---|---|---|
| A | 7270 | 5989 | 1 | 1 | 0.01% | 0.02% | 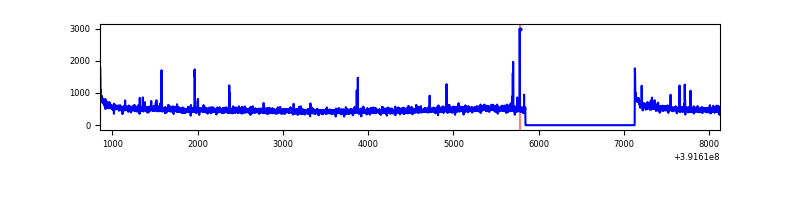 |
| B | 7270 | 5989 | 746 | 746 | 10.26% | 12.46% | 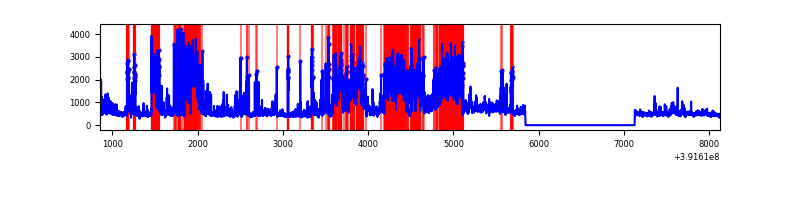 |
| C | 7270 | 5989 | 2579 | 2579 | 35.47% | 43.06% | 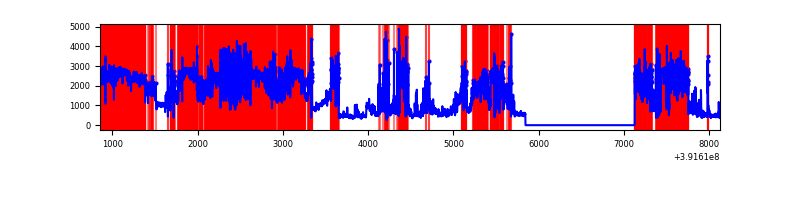 |
| D | 7270 | 5989 | 549 | 549 | 7.55% | 9.17% | 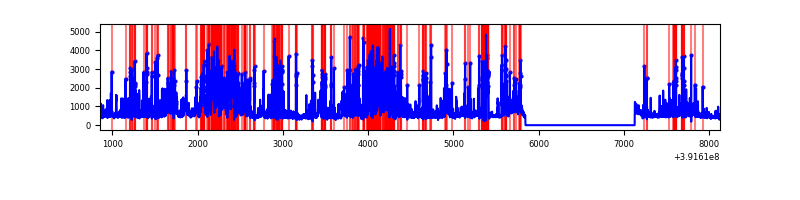 |
Top three noisy pixels from each quadrant. If the there are fewer than three noisy pixels in the level2.evt file, extra rows are filled as -1
| Pixel properties | Quadrant properties | ||||||
|---|---|---|---|---|---|---|---|
| Quadrant | DetID | PixID | Counts | Sigma | Mean | Median | Sigma |
| A | 10 | 83 | 187928 | 1330.98 | 688 | 675 | 140.7 |
| A | 9 | 143 | 43942 | 307.54 | 688 | 675 | 140.7 |
| A | 12 | 189 | 11457 | 76.64 | 688 | 675 | 140.7 |
| B | 5 | 236 | 2921655 | 23583.62 | 643 | 626 | 123.9 |
| B | 5 | 172 | 131553 | 1057.07 | 643 | 626 | 123.9 |
| B | 0 | 213 | 114716 | 921.13 | 643 | 626 | 123.9 |
| C | 9 | 187 | 7690755 | 69352.24 | 469 | 474 | 110.9 |
| C | 15 | 208 | 184611 | 1660.58 | 469 | 474 | 110.9 |
| C | 15 | 214 | 177403 | 1595.58 | 469 | 474 | 110.9 |
| D | 1 | 52 | 743311 | 4733.39 | 639 | 621 | 156.9 |
| D | 7 | 223 | 653868 | 4163.34 | 639 | 621 | 156.9 |
| D | 12 | 17 | 552523 | 3517.44 | 639 | 621 | 156.9 |
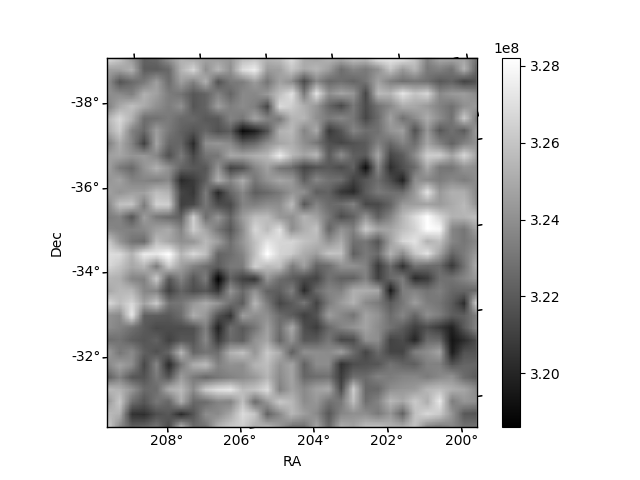
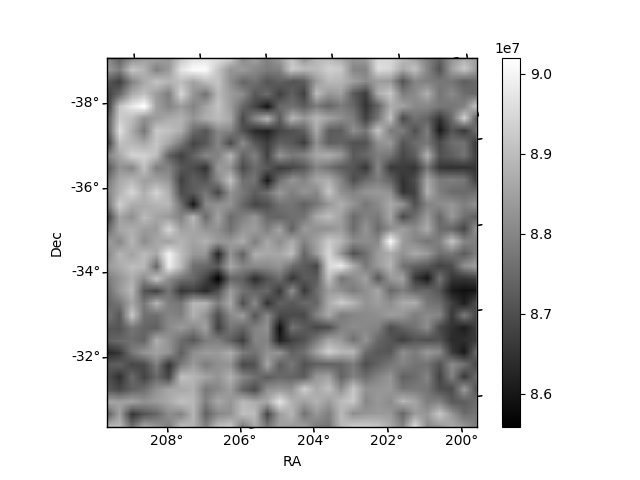
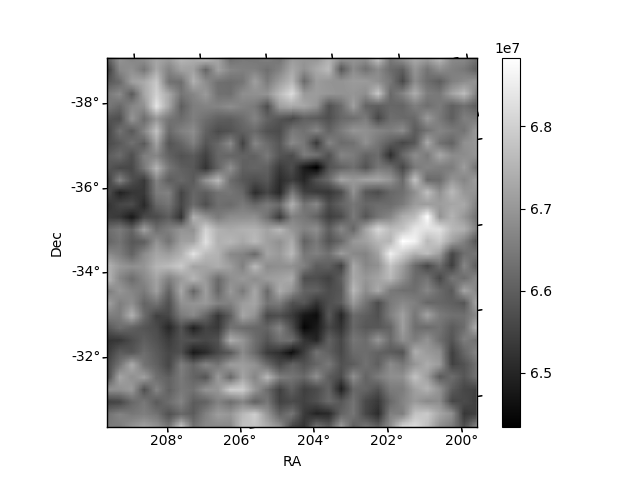
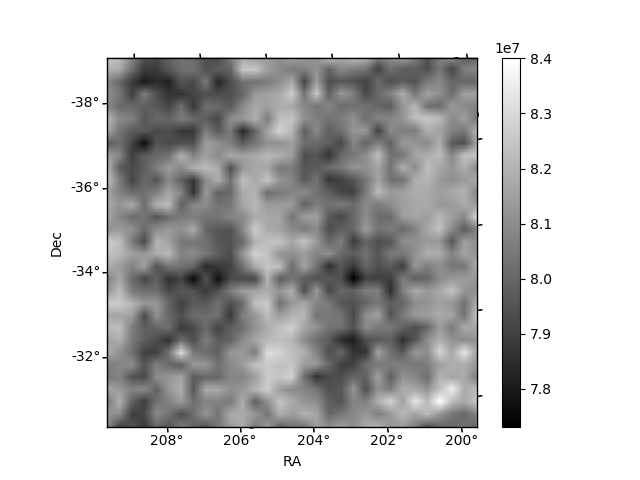
Histogram calculated using DETX and DETY for each event in the final _common_clean file
| Quadrant A | 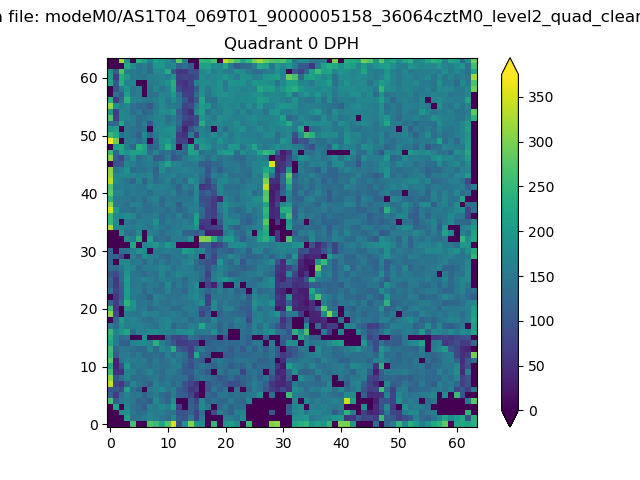 |
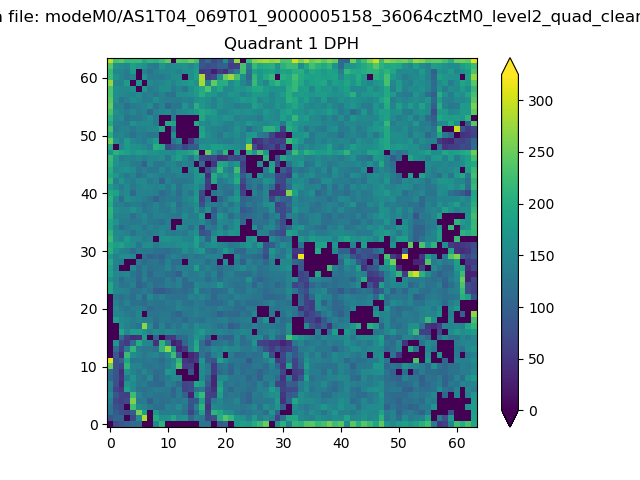 |
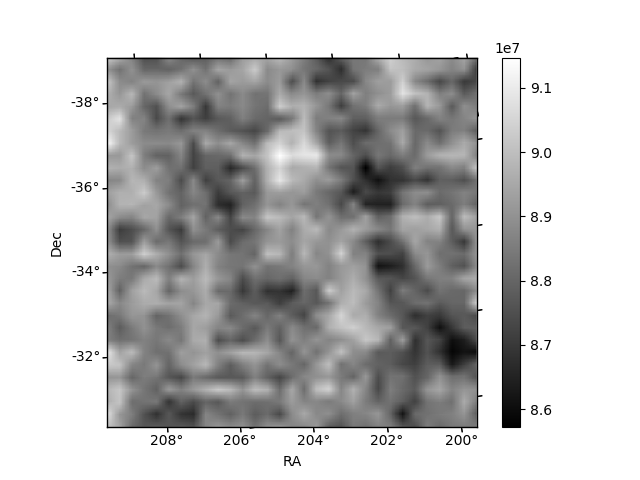
Quadrant B |
|---|---|---|---|
| Quadrant D | 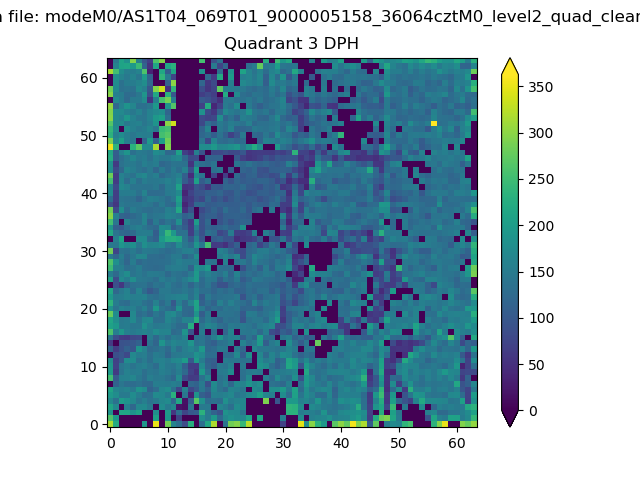 |
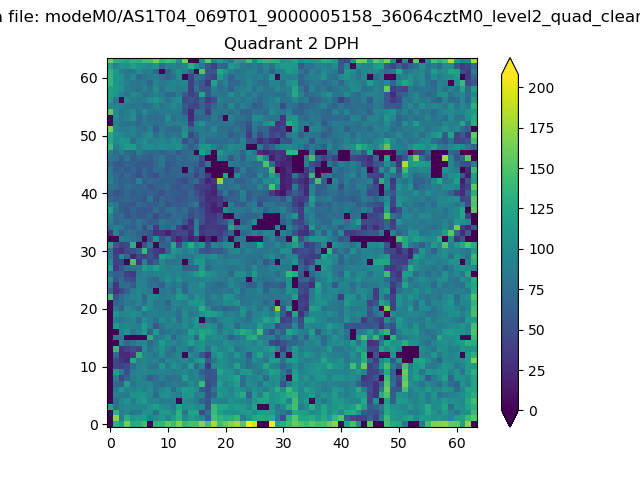 |
Quadrant C |
| Plot type | Count rate plots | Images |
|---|---|---|
| Comparison with Poisson distribution Blue bars denote a histogram of data divided into 1 sec bins. Red curve is a Poisson curve with rate = median count rate of data. |
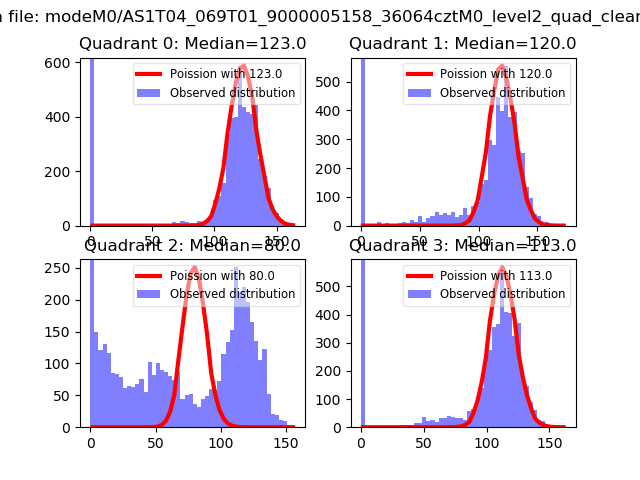 |
 |
| Quadrant-wise count rates Data is divided into 100 sec bins |
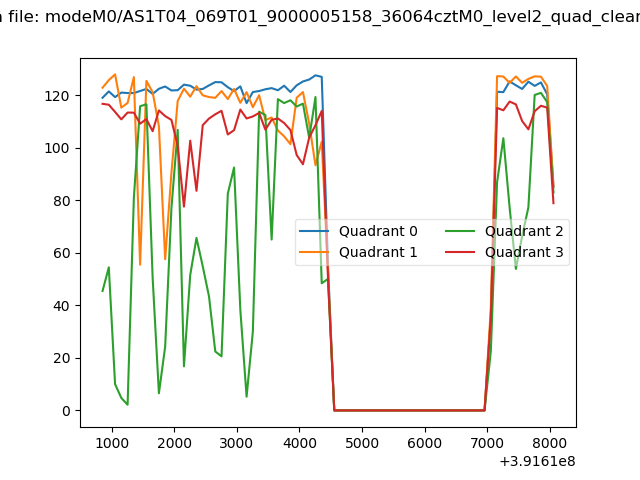 |
|
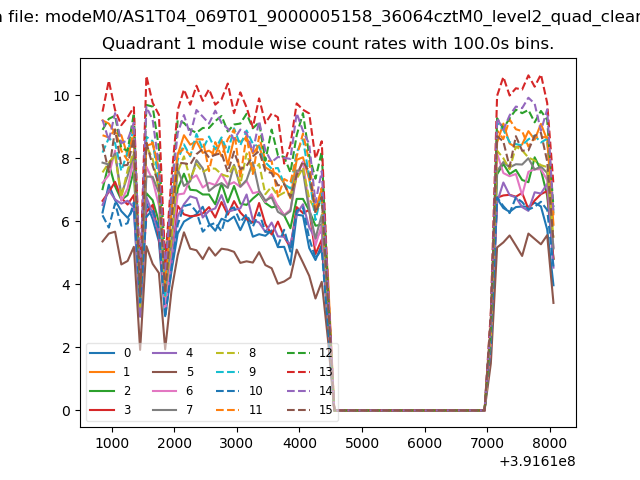
| Module-wise count rates for Quadrant A Data is divided into 100 sec bins |
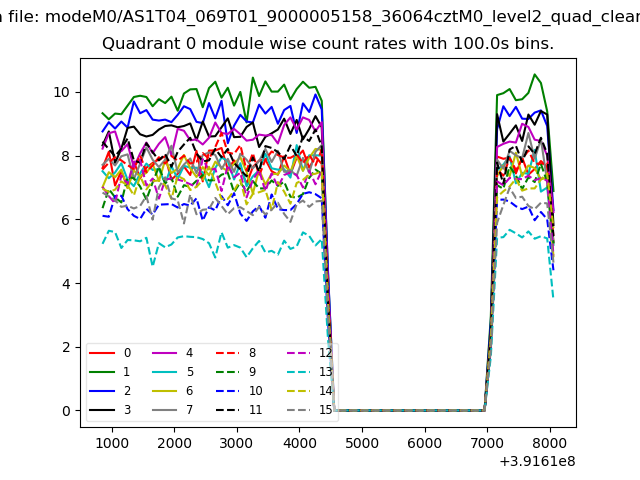 |
 |
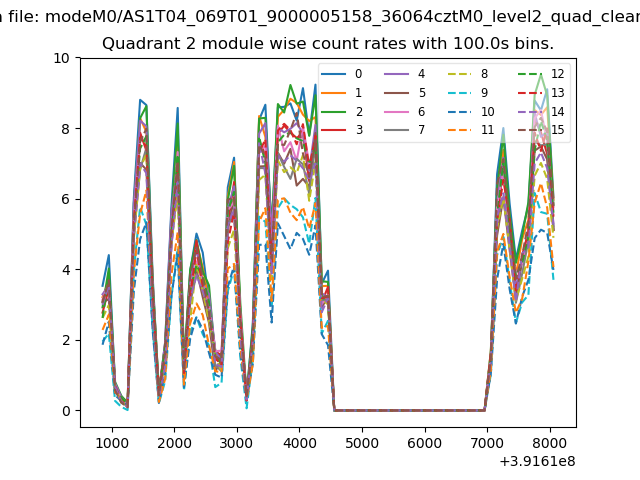
| Module-wise count rates for Quadrant B Data is divided into 100 sec bins |
 |
 |
| Module-wise count rates for Quadrant C Data is divided into 100 sec bins |
 |
 |
| Module-wise count rates for Quadrant D Data is divided into 100 sec bins |
 |
 |
| Parameter | Plot |
|---|---|
| CZT HV Monitor | 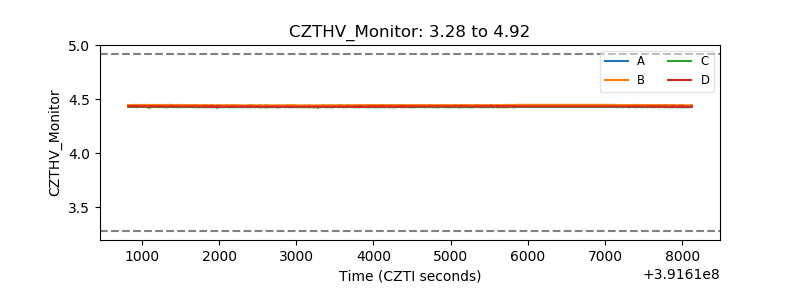 |
| D_VDD | 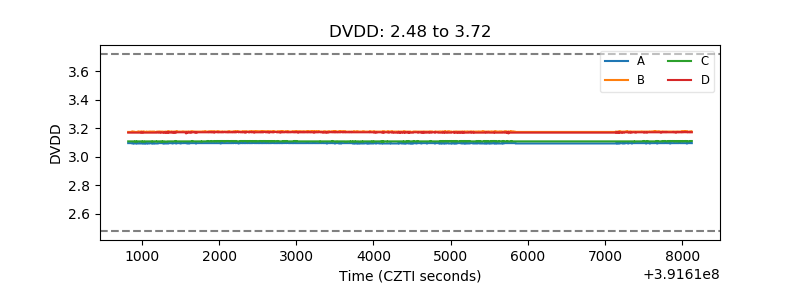 |
| Temperature 1 | 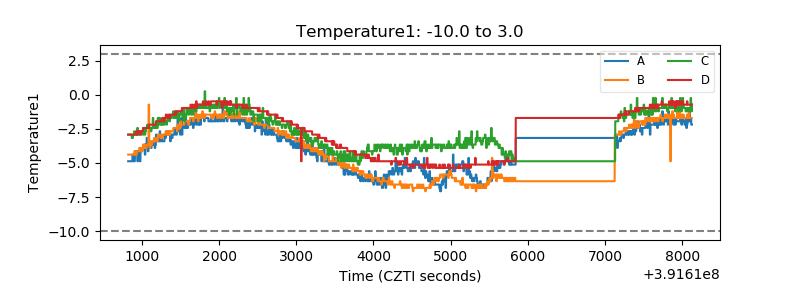 |
| Veto HV Monitor | 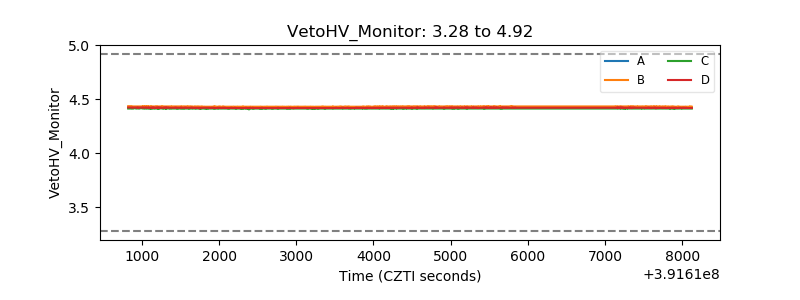 |
| Veto LLD | 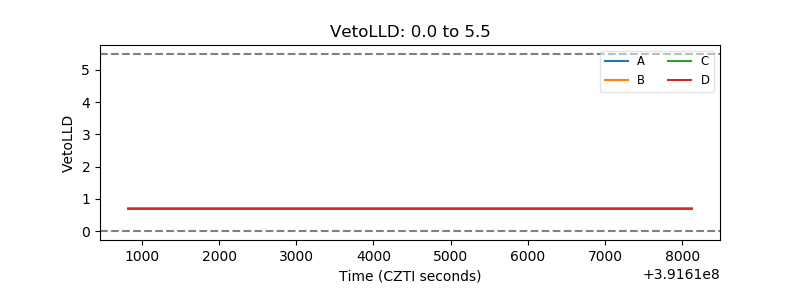 |
| Alpha Counter | 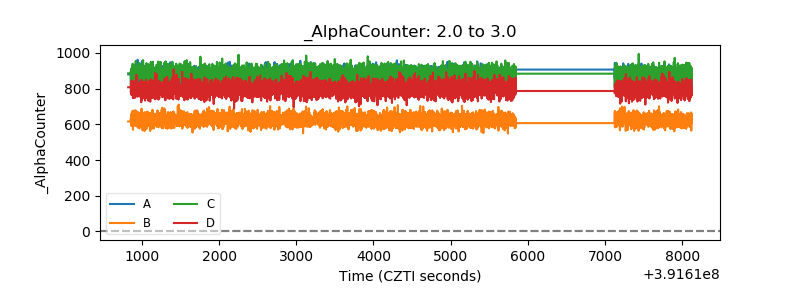 |
| _CPM_Rate | 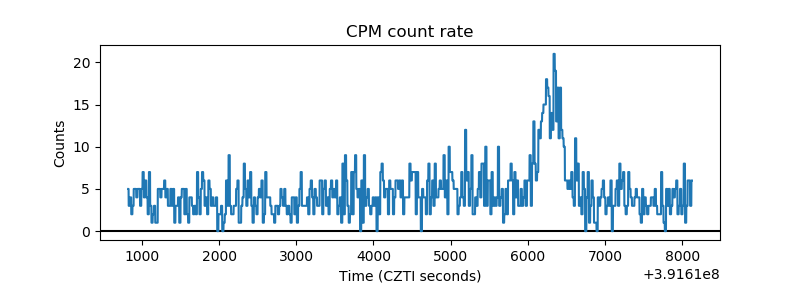 |
| CZT Counter | 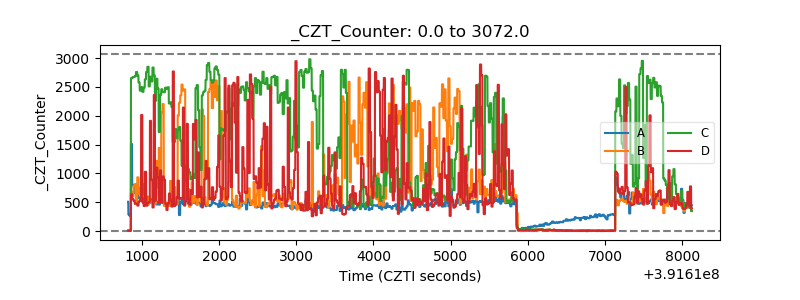 |
| +2.5 Volts monitor | 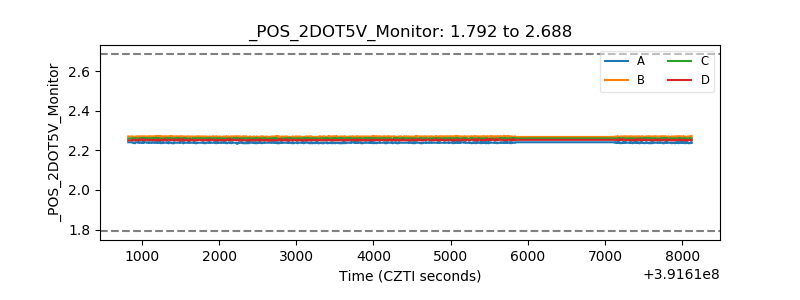 |
| +5 Volts monitor | 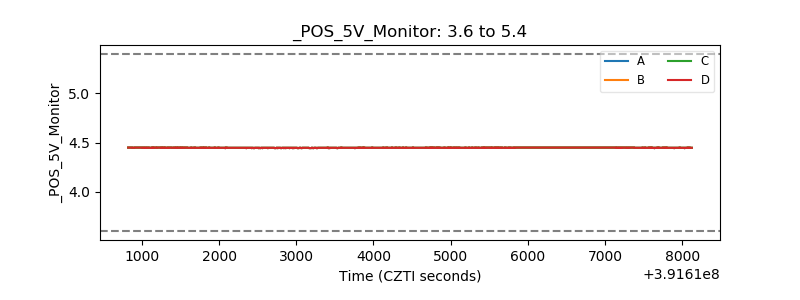 |
| _ROLL_ROT | 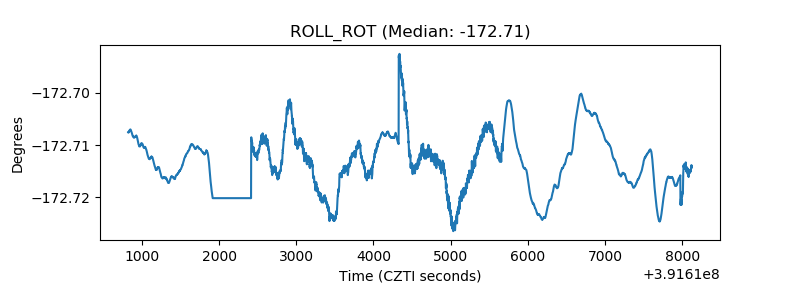 |
| _Roll_DEC | 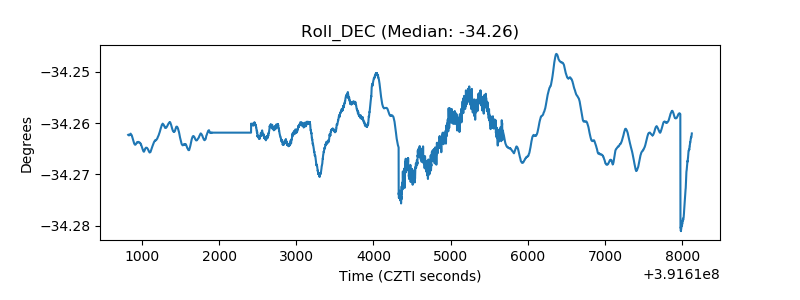 |
| _Roll_RA | 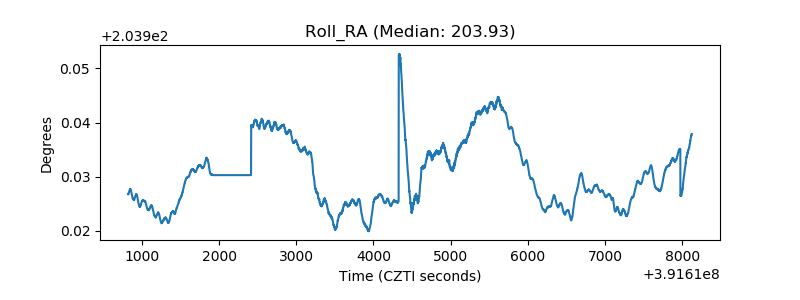 |
| Veto Counter | 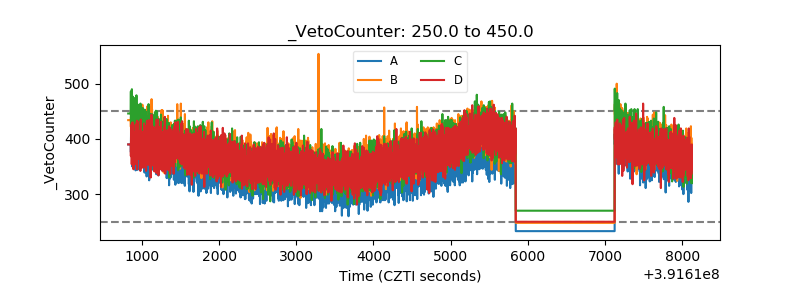 |