| Param | Original file | Final file |
|---|---|---|
| Filename | modeM0/AS1T04_069T01_9000005158_36061cztM0_level2.evt | modeM0/AS1T04_069T01_9000005158_36061cztM0_level2_quad_clean.evt |
| Size (bytes) | 722,502,720 | 59,477,760 |
| Size | 689.0 MB | 56.7 MB |
| Events in quadrant A | 2,532,264 | 400,702 |
| Events in quadrant B | 3,443,970 | 395,538 |
| Events in quadrant C | 10,614,939 | 288,752 |
| Events in quadrant D | 4,938,257 | 349,848 |
Noise dominated data is calculated using 1-second bins in cleaned event files. If a bin has >2000 counts, and if more than 50% of those come from <1% of pixels, then it is considered to be noise-dominated and hence unusable.
| Quadrant | # 1 sec bins | Bins with >0 counts | Bins with >2000 counts | High rate bins dominated by noise | Noise dominated (total time) | Noise dominated (detector-on time) | Marked lightcurve |
|---|---|---|---|---|---|---|---|
| A | 7087 | 5206 | 0 | 0 | 0.00% | 0.00% | 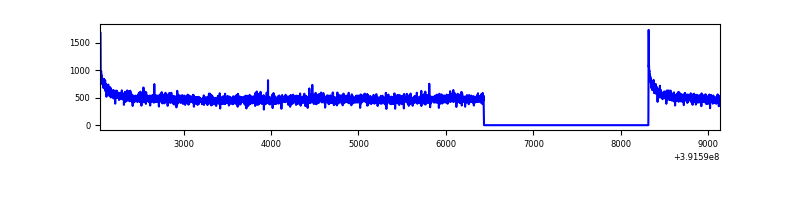 |
| B | 7087 | 5206 | 139 | 139 | 1.96% | 2.67% | 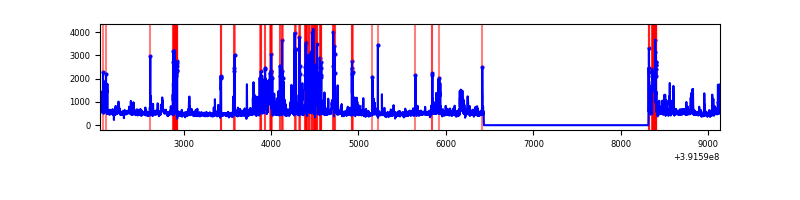 |
| C | 7087 | 5206 | 3081 | 3081 | 43.47% | 59.18% | 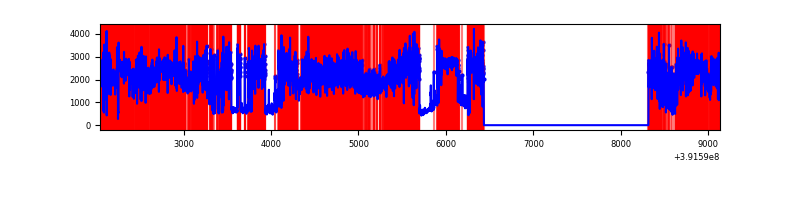 |
| D | 7087 | 5206 | 434 | 434 | 6.12% | 8.34% | 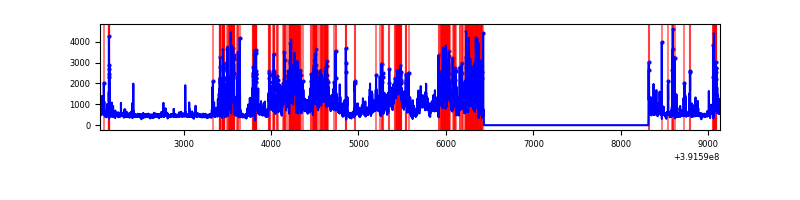 |
Top three noisy pixels from each quadrant. If the there are fewer than three noisy pixels in the level2.evt file, extra rows are filled as -1
| Pixel properties | Quadrant properties | ||||||
|---|---|---|---|---|---|---|---|
| Quadrant | DetID | PixID | Counts | Sigma | Mean | Median | Sigma |
| A | 10 | 83 | 169217 | 1355.15 | 608 | 597 | 124.4 |
| A | 13 | 6 | 12054 | 92.08 | 608 | 597 | 124.4 |
| A | 13 | 254 | 7743 | 57.43 | 608 | 597 | 124.4 |
| B | 5 | 236 | 722462 | 6263.26 | 594 | 579 | 115.3 |
| B | 0 | 213 | 149635 | 1293.25 | 594 | 579 | 115.3 |
| B | 5 | 172 | 68349 | 587.99 | 594 | 579 | 115.3 |
| C | 9 | 187 | 8569307 | 83946.35 | 441 | 444 | 102.1 |
| C | 15 | 214 | 168855 | 1649.87 | 441 | 444 | 102.1 |
| C | 0 | 10 | 115628 | 1128.42 | 441 | 444 | 102.1 |
| D | 12 | 227 | 1136390 | 8053.37 | 572 | 555 | 141.0 |
| D | 12 | 6 | 666979 | 4725.12 | 572 | 555 | 141.0 |
| D | 7 | 223 | 444368 | 3146.75 | 572 | 555 | 141.0 |
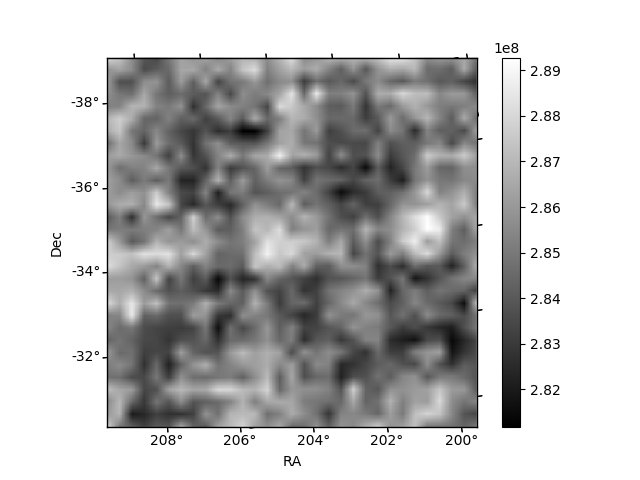
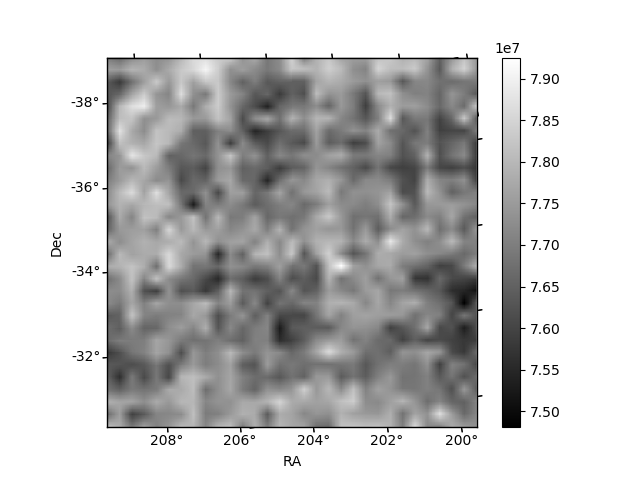
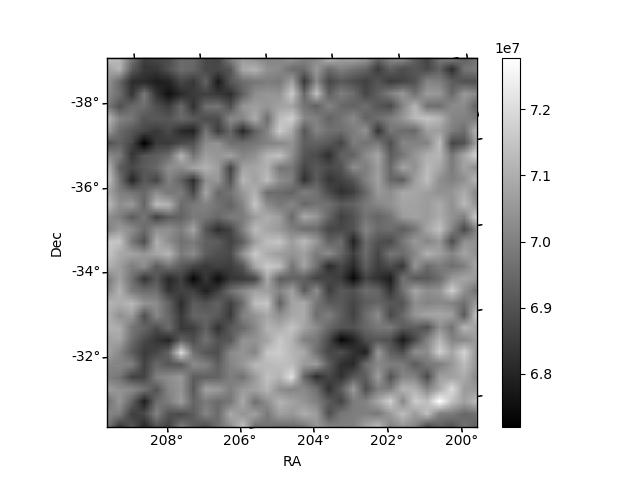
Histogram calculated using DETX and DETY for each event in the final _common_clean file
| Quadrant A | 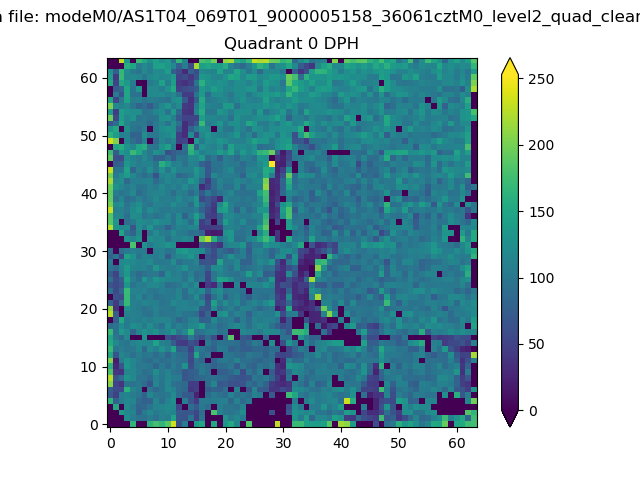 |
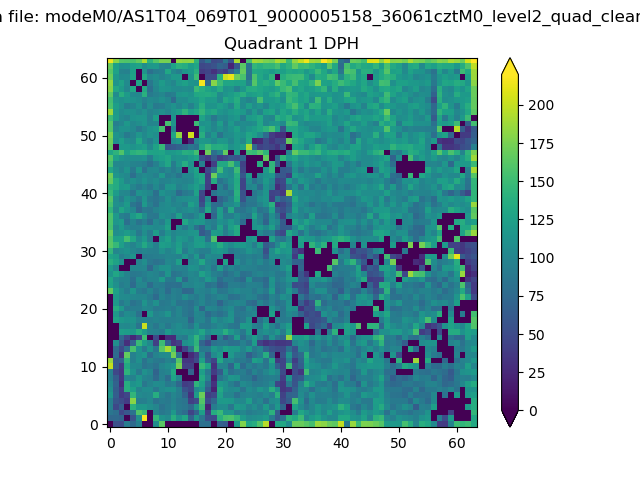 |
Quadrant B |
|---|---|---|---|
| Quadrant D |  |
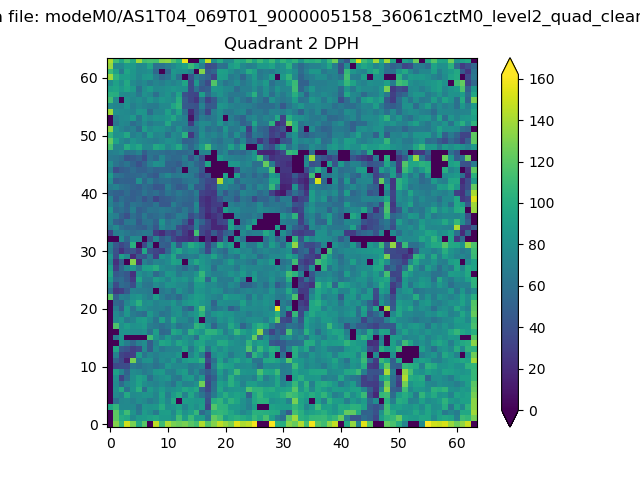 |
Quadrant C |
| Plot type | Count rate plots | Images |
|---|---|---|
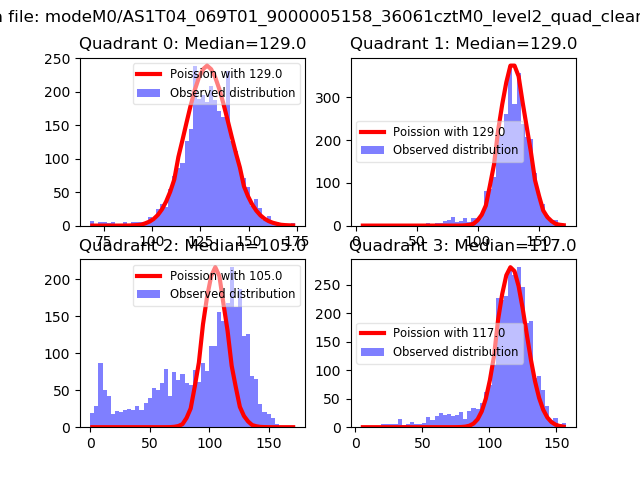
| Comparison with Poisson distribution Blue bars denote a histogram of data divided into 1 sec bins. Red curve is a Poisson curve with rate = median count rate of data. |
 |
 |
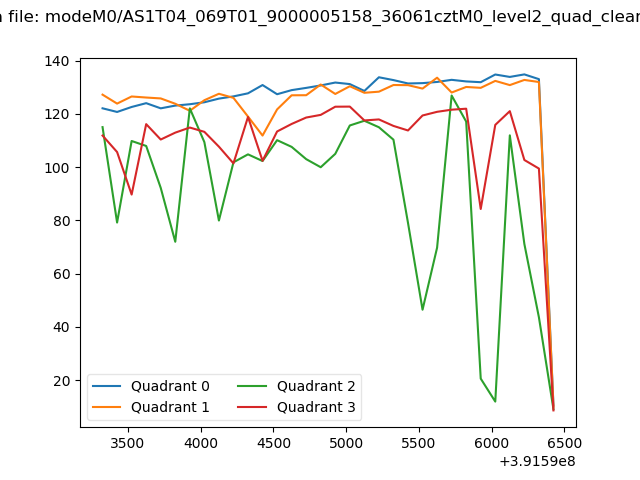
| Quadrant-wise count rates Data is divided into 100 sec bins |
 |
|
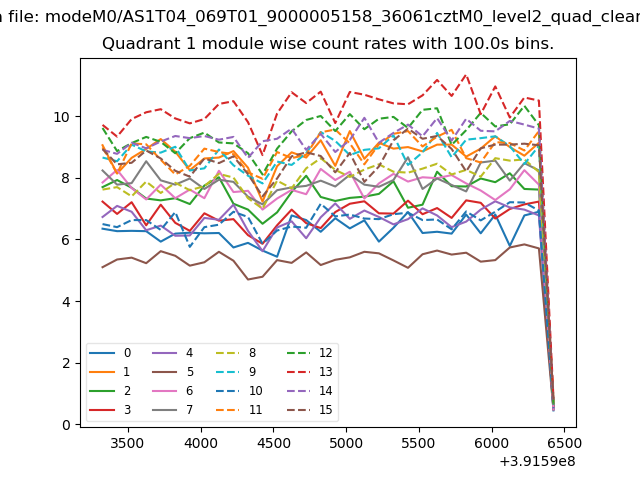
| Module-wise count rates for Quadrant A Data is divided into 100 sec bins |
 |
 |
| Module-wise count rates for Quadrant B Data is divided into 100 sec bins |
 |
 |
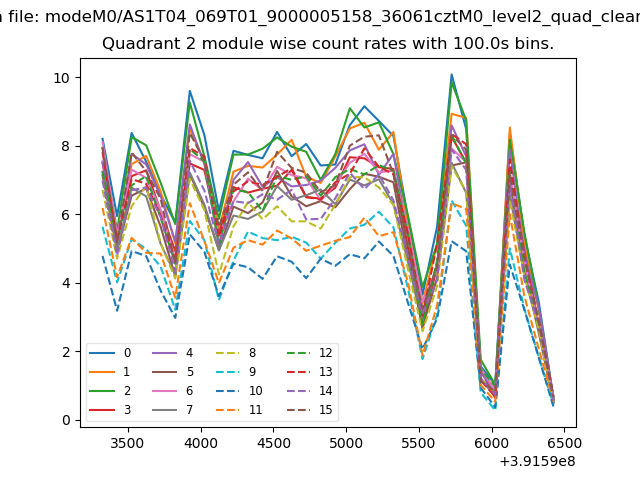
| Module-wise count rates for Quadrant C Data is divided into 100 sec bins |
 |
 |
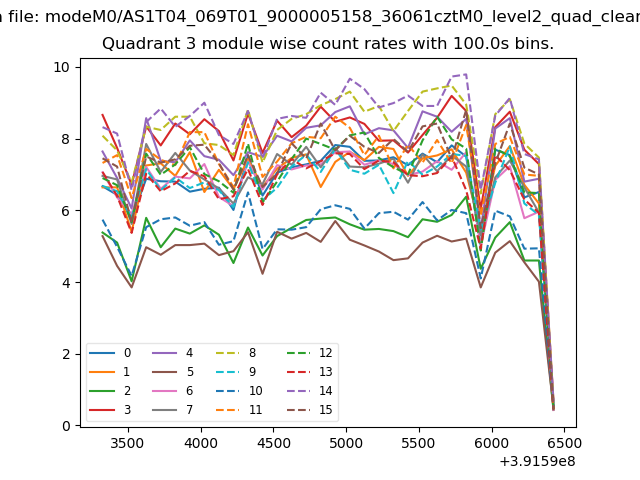
| Module-wise count rates for Quadrant D Data is divided into 100 sec bins |
 |
 |
| Parameter | Plot |
|---|---|
| CZT HV Monitor |  |
| D_VDD | 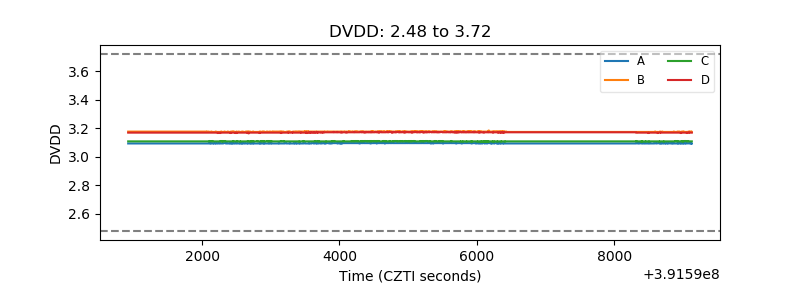 |
| Temperature 1 | 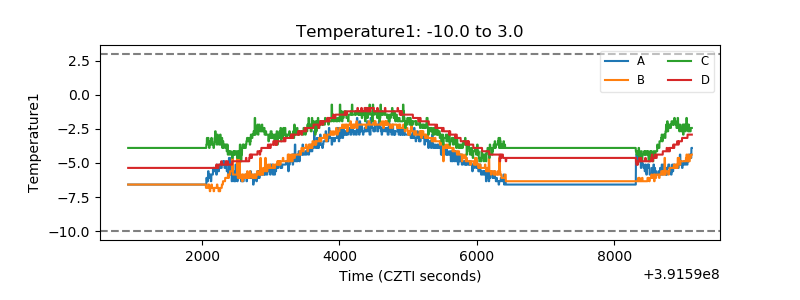 |
| Veto HV Monitor | 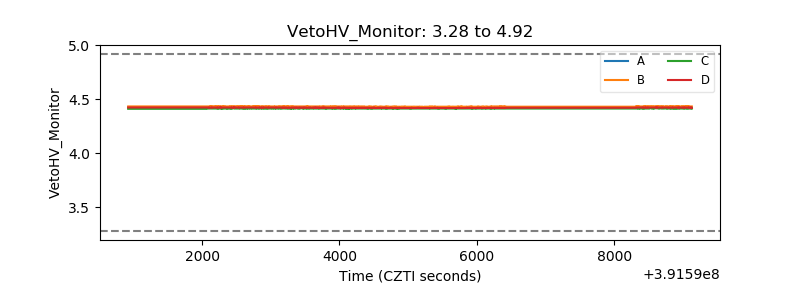 |
| Veto LLD | 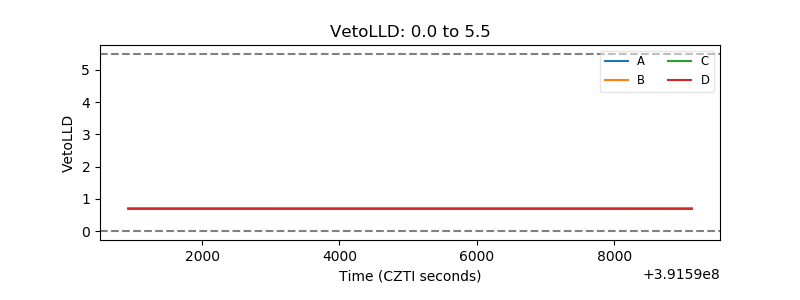 |
| Alpha Counter | 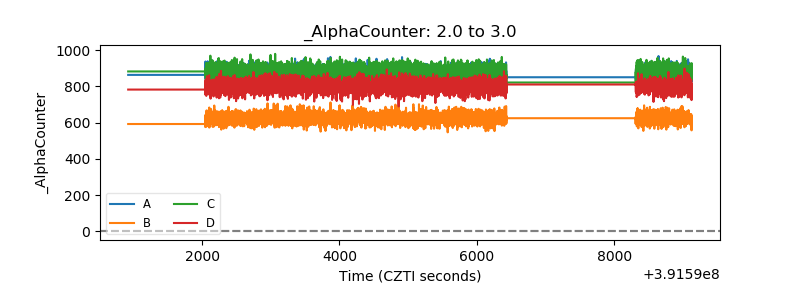 |
| _CPM_Rate | 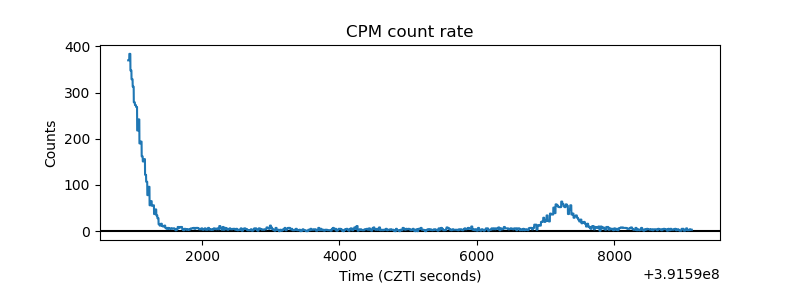 |
| CZT Counter | 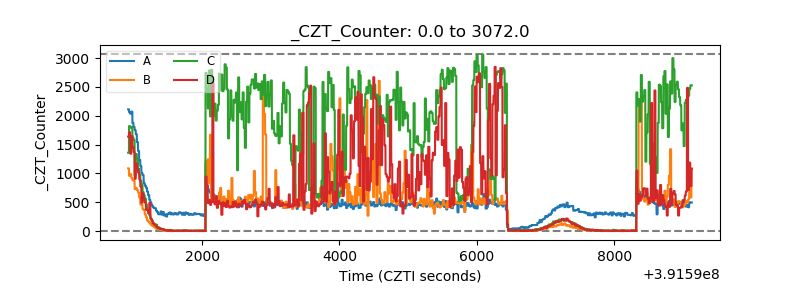 |
| +2.5 Volts monitor | 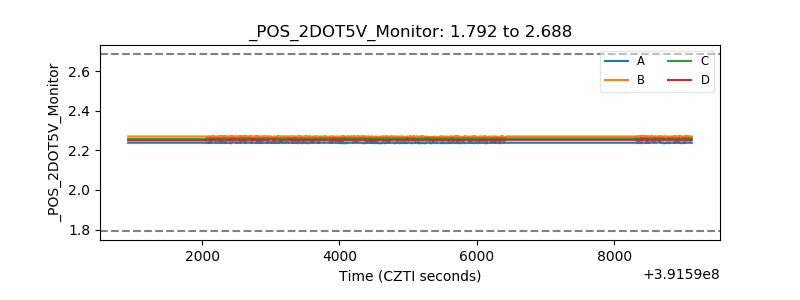 |
| +5 Volts monitor | 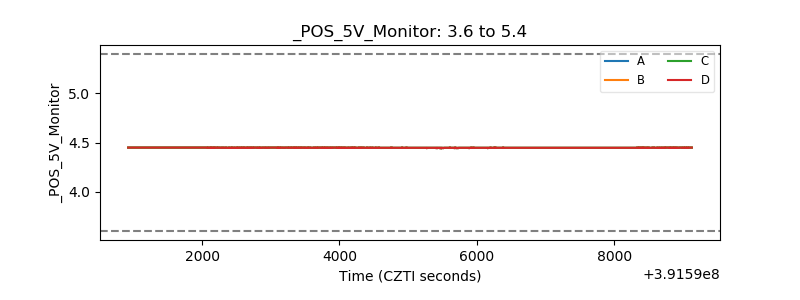 |
| _ROLL_ROT | 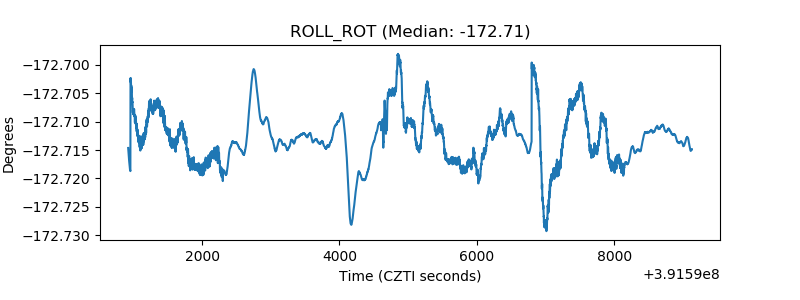 |
| _Roll_DEC | 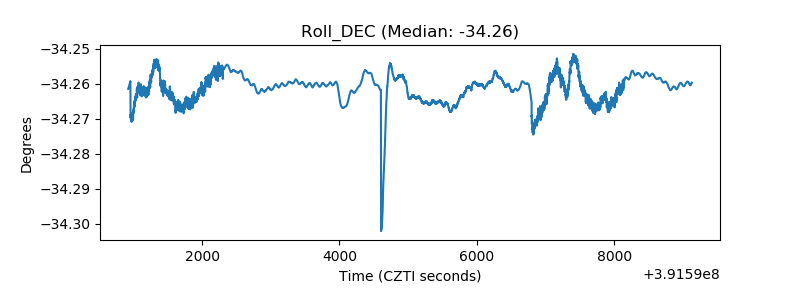 |
| _Roll_RA | 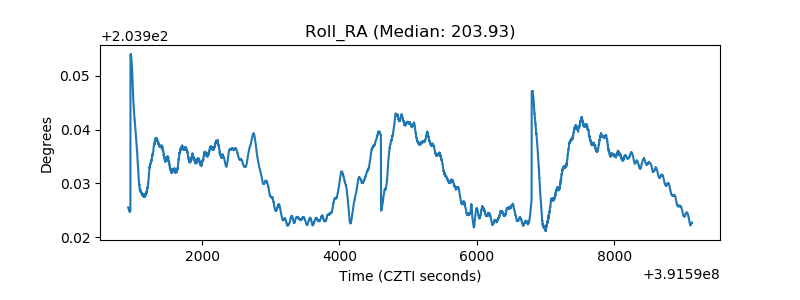 |
| Veto Counter | 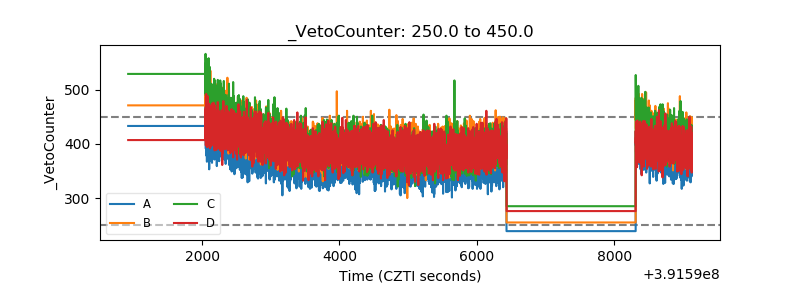 |