| Param | Original file | Final file |
|---|---|---|
| Filename | modeM0/AS1T04_069T01_9000005158_36060cztM0_level2.evt | modeM0/AS1T04_069T01_9000005158_36060cztM0_level2_quad_clean.evt |
| Size (bytes) | 607,965,120 | 52,560,000 |
| Size | 579.8 MB | 50.1 MB |
| Events in quadrant A | 2,516,750 | 331,844 |
| Events in quadrant B | 4,020,219 | 322,794 |
| Events in quadrant C | 8,246,964 | 274,933 |
| Events in quadrant D | 3,288,060 | 308,589 |
| Mode M0 | |||
|---|---|---|---|
| Quadrant | BADHDUFLAG | Total packets | Discarded packets |
| A | 0 | 10409 | 3 |
| B | 0 | 15250 | 2 |
| C | 0 | 27824 | 2 |
| D | 0 | 13026 | 2 |
| Mode M9 | |||
|---|---|---|---|
| Quadrant | BADHDUFLAG | Total packets | Discarded packets |
| A | 0 | 31 | 0 |
| B | 0 | 31 | 0 |
| C | 0 | 31 | 0 |
| D | 0 | 32 | 0 |
| Mode SS | |||
|---|---|---|---|
| Quadrant | BADHDUFLAG | Total packets | Discarded packets |
| A | 0 | 102 | 0 |
| B | 0 | 102 | 0 |
| C | 0 | 102 | 0 |
| D | 0 | 102 | 0 |
| Quadrant | Total seconds | Saturated seconds | Saturation percentage |
|---|---|---|---|
| A | 5031 | 5 | 0.099384% |
| B | 5031 | 334 | 6.638839% |
| C | 5031 | 2075 | 41.244285% |
| D | 5031 | 158 | 3.140529% |
Noise dominated data is calculated using 1-second bins in cleaned event files. If a bin has >2000 counts, and if more than 50% of those come from <1% of pixels, then it is considered to be noise-dominated and hence unusable.
| Quadrant | # 1 sec bins | Bins with >0 counts | Bins with >2000 counts | High rate bins dominated by noise | Noise dominated (total time) | Noise dominated (detector-on time) | Marked lightcurve |
|---|---|---|---|---|---|---|---|
| A | 7124 | 5032 | 0 | 0 | 0.00% | 0.00% | 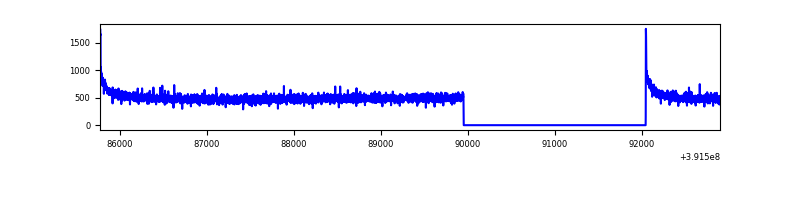 |
| B | 7123 | 5031 | 220 | 220 | 3.09% | 4.37% | 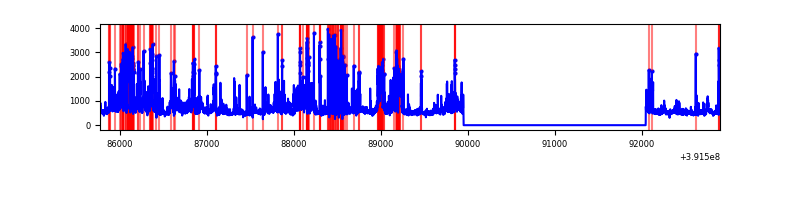 |
| C | 7124 | 5031 | 2072 | 2072 | 29.08% | 41.18% | 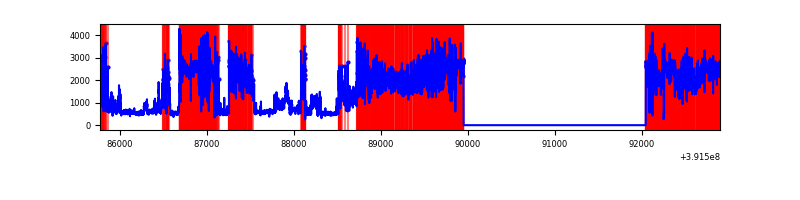 |
| D | 7124 | 5032 | 127 | 127 | 1.78% | 2.52% | 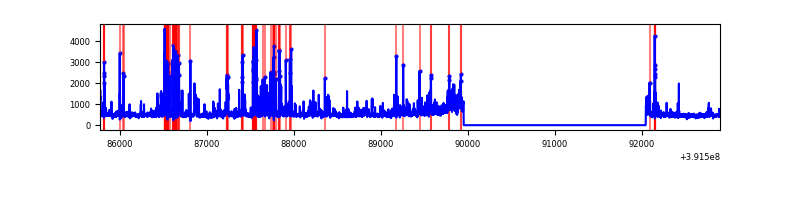 |
Top three noisy pixels from each quadrant. If the there are fewer than three noisy pixels in the level2.evt file, extra rows are filled as -1
| Pixel properties | Quadrant properties | ||||||
|---|---|---|---|---|---|---|---|
| Quadrant | DetID | PixID | Counts | Sigma | Mean | Median | Sigma |
| A | 10 | 83 | 167427 | 1348.14 | 607 | 593 | 123.8 |
| A | 13 | 254 | 7708 | 57.49 | 607 | 593 | 123.8 |
| A | 3 | 137 | 6101 | 44.51 | 607 | 593 | 123.8 |
| B | 5 | 236 | 1367551 | 12153.98 | 590 | 576 | 112.5 |
| B | 0 | 213 | 80507 | 710.68 | 590 | 576 | 112.5 |
| B | 5 | 172 | 72652 | 640.84 | 590 | 576 | 112.5 |
| C | 9 | 187 | 5987087 | 54468.14 | 474 | 478 | 109.9 |
| C | 15 | 214 | 173677 | 1575.82 | 474 | 478 | 109.9 |
| C | 0 | 10 | 168001 | 1524.18 | 474 | 478 | 109.9 |
| D | 12 | 17 | 259687 | 1831.82 | 582 | 566 | 141.5 |
| D | 12 | 6 | 220368 | 1553.86 | 582 | 566 | 141.5 |
| D | 12 | 227 | 175854 | 1239.18 | 582 | 566 | 141.5 |
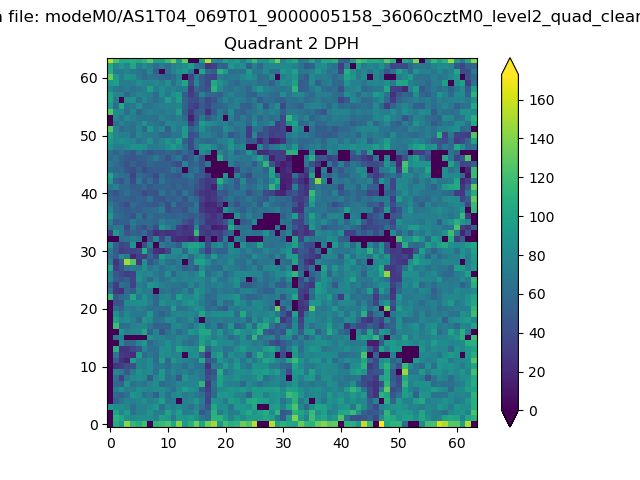
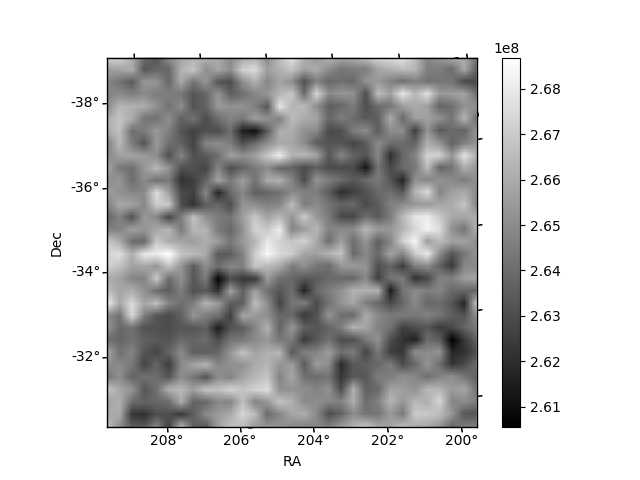
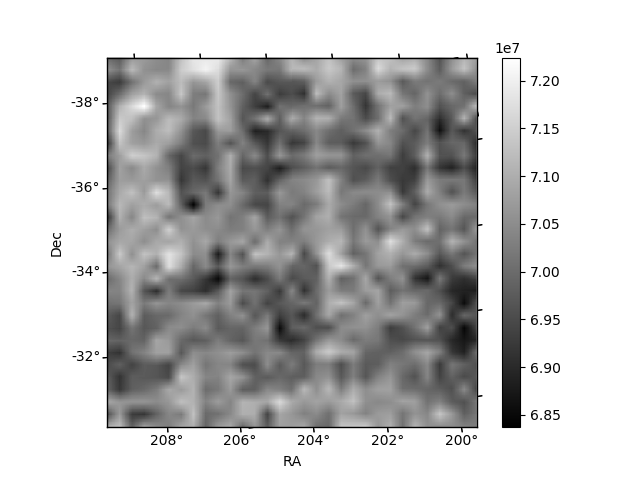
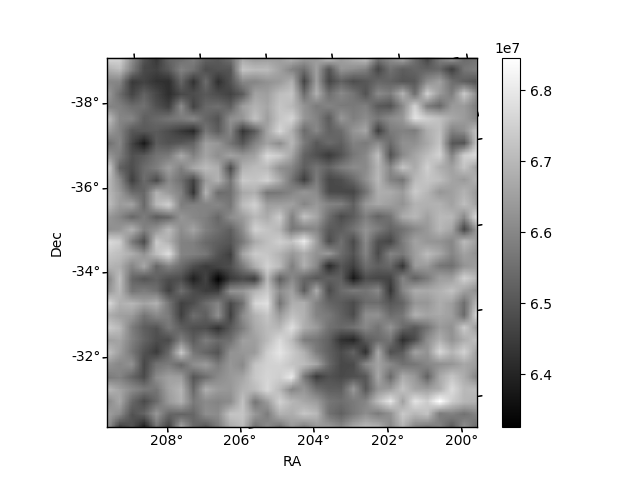
Histogram calculated using DETX and DETY for each event in the final _common_clean file
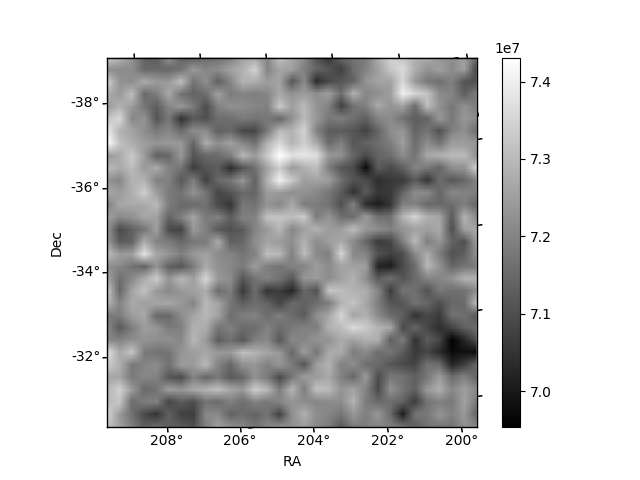
| Quadrant A | 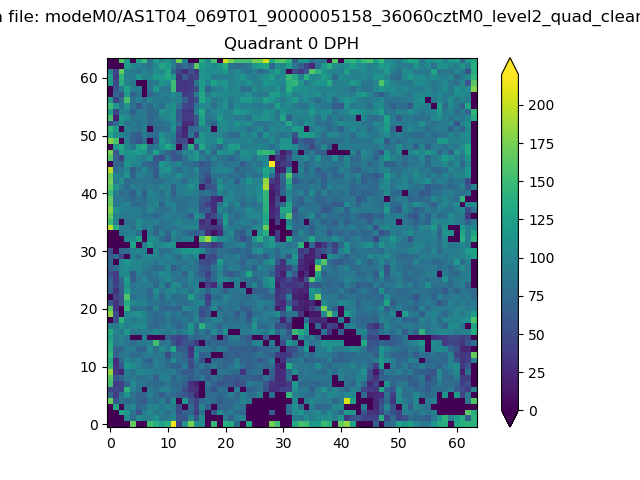 |
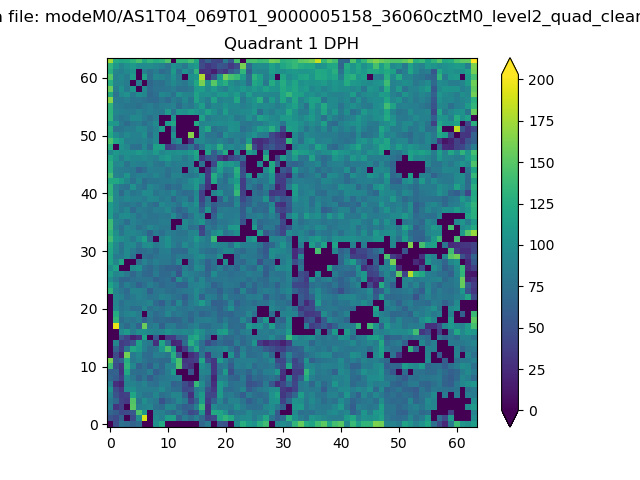 |
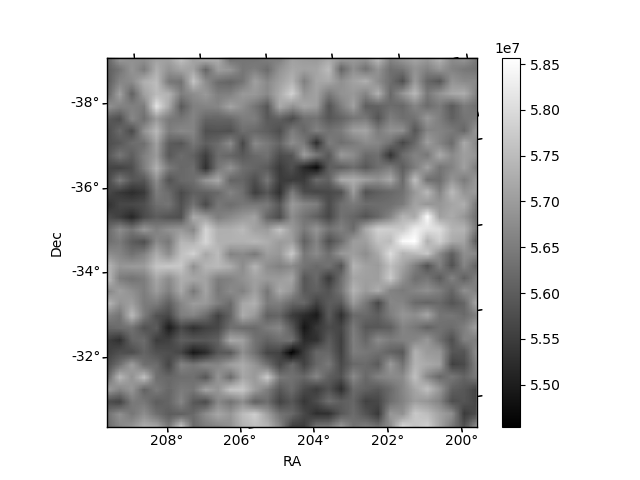
Quadrant B |
|---|---|---|---|
| Quadrant D | 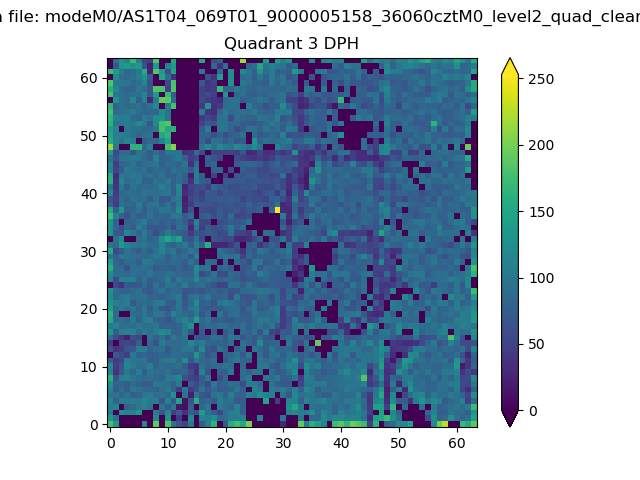 |
 |
Quadrant C |
| Plot type | Count rate plots | Images |
|---|---|---|
| Comparison with Poisson distribution Blue bars denote a histogram of data divided into 1 sec bins. Red curve is a Poisson curve with rate = median count rate of data. |
 |
 |
| Quadrant-wise count rates Data is divided into 100 sec bins |
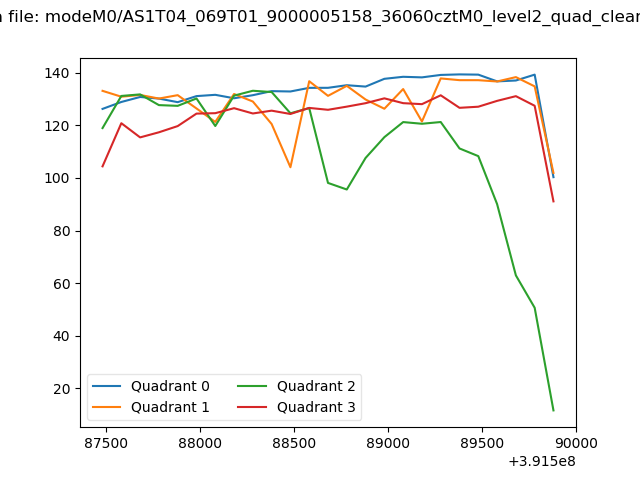 |
|
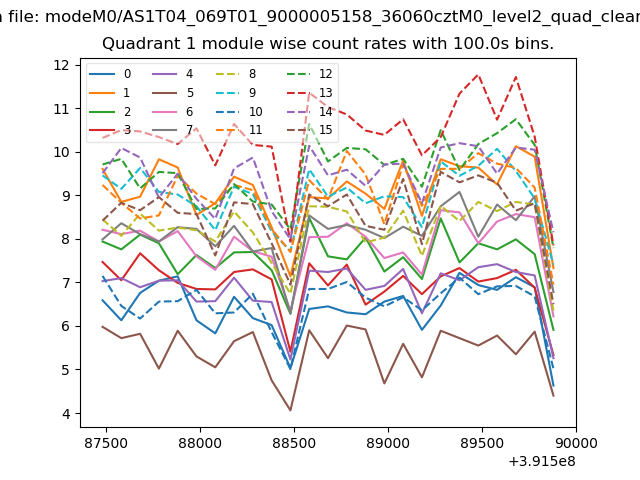
| Module-wise count rates for Quadrant A Data is divided into 100 sec bins |
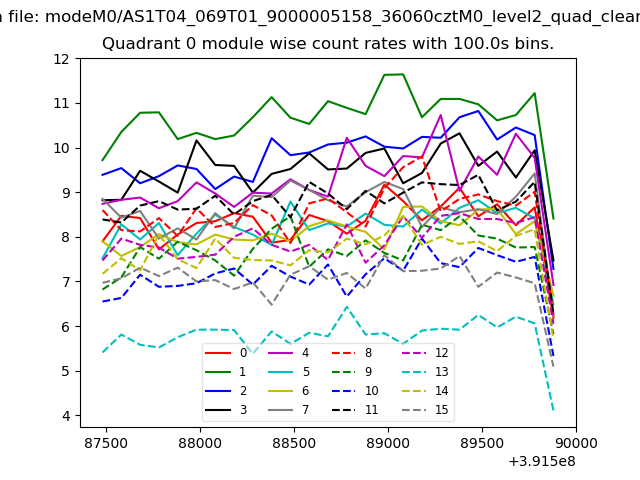 |
 |
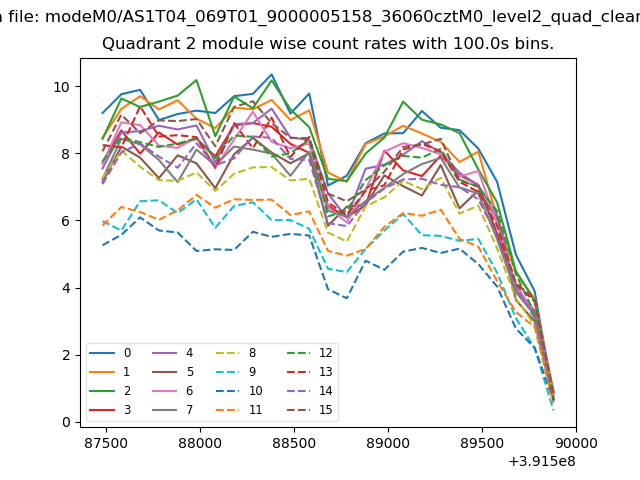
| Module-wise count rates for Quadrant B Data is divided into 100 sec bins |
 |
 |
| Module-wise count rates for Quadrant C Data is divided into 100 sec bins |
 |
 |
| Module-wise count rates for Quadrant D Data is divided into 100 sec bins |
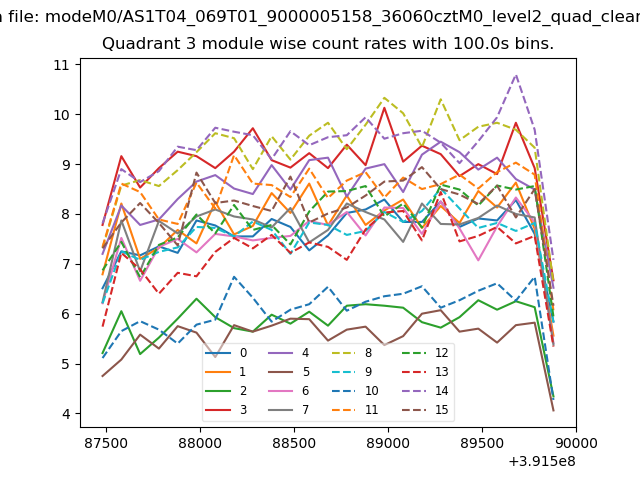 |
 |
| Parameter | Plot |
|---|---|
| CZT HV Monitor | 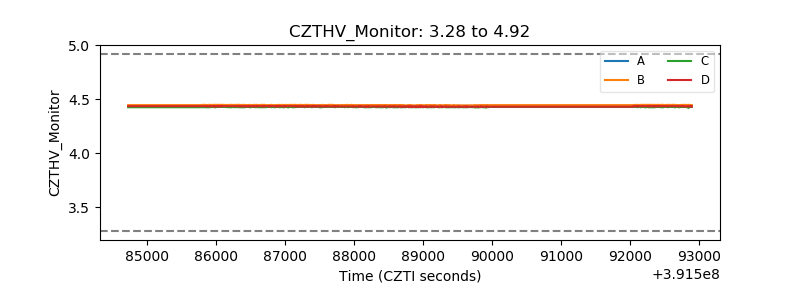 |
| D_VDD | 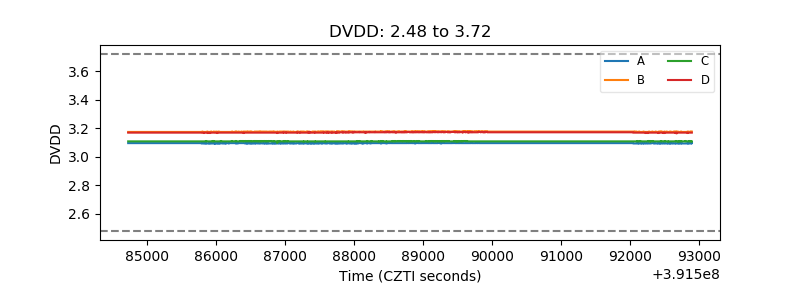 |
| Temperature 1 |  |
| Veto HV Monitor | 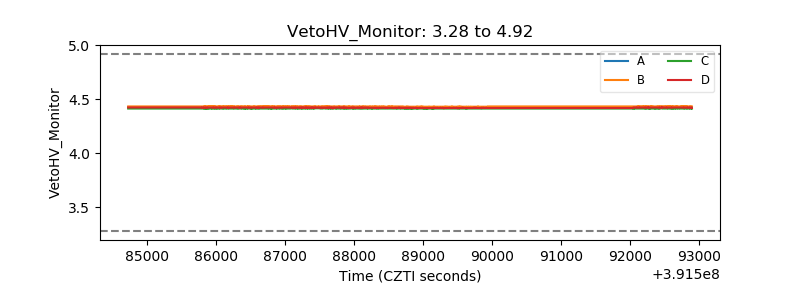 |
| Veto LLD | 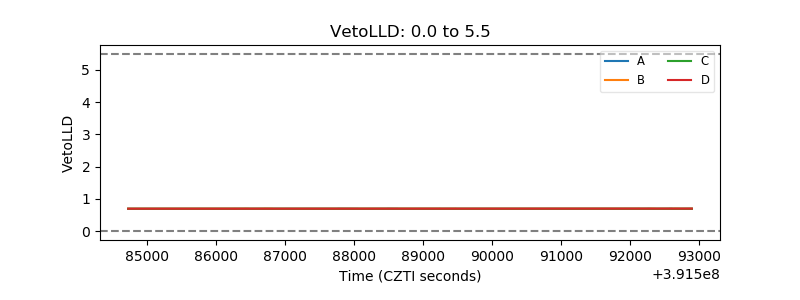 |
| Alpha Counter | 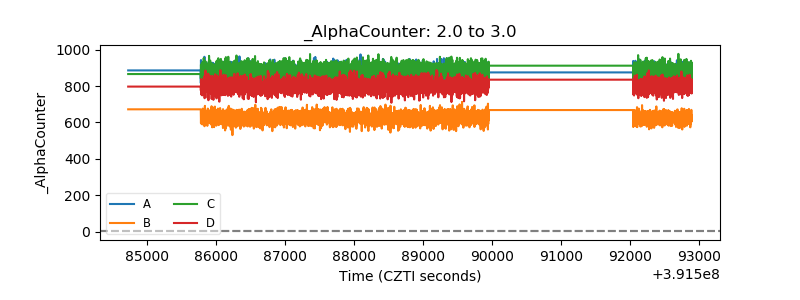 |
| _CPM_Rate | 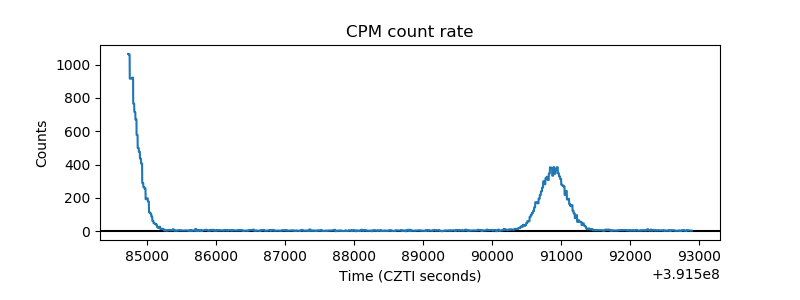 |
| CZT Counter | 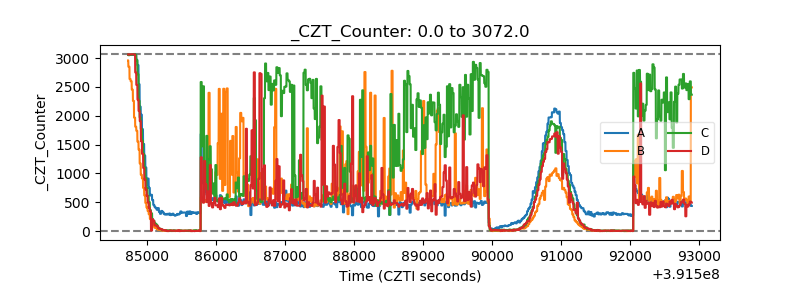 |
| +2.5 Volts monitor | 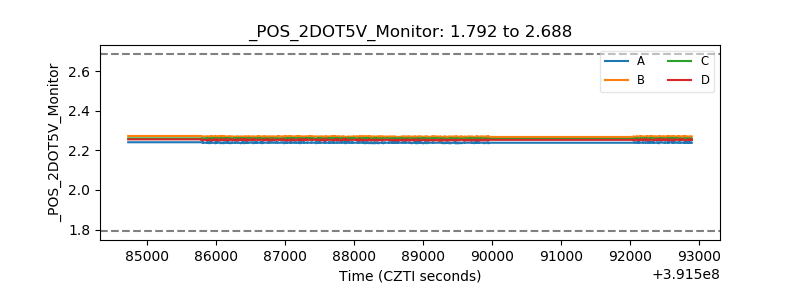 |
| +5 Volts monitor | 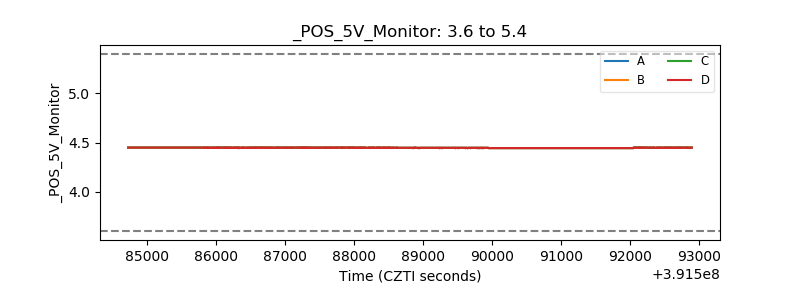 |
| _ROLL_ROT | 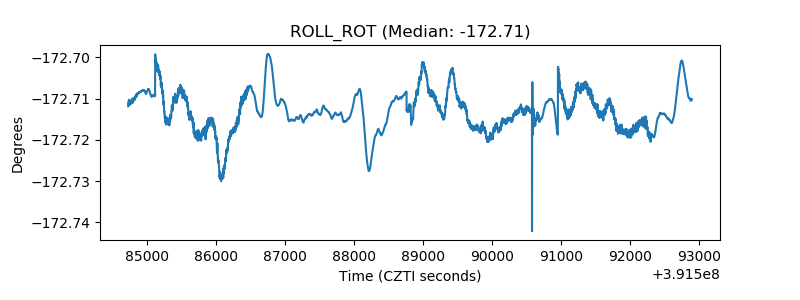 |
| _Roll_DEC | 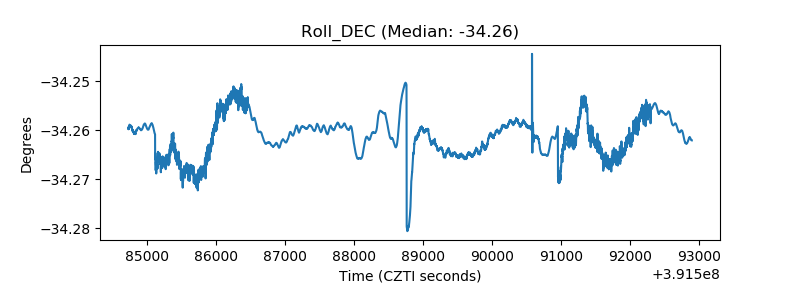 |
| _Roll_RA | 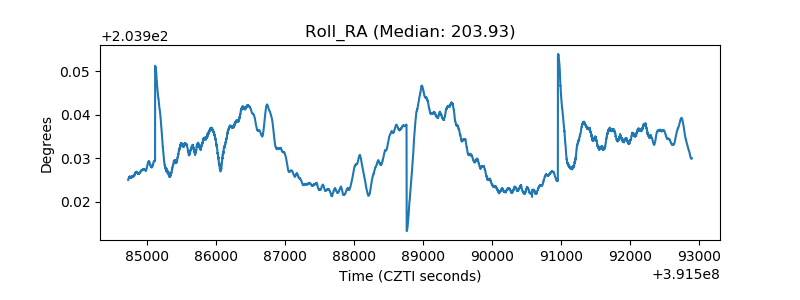 |
| Veto Counter | 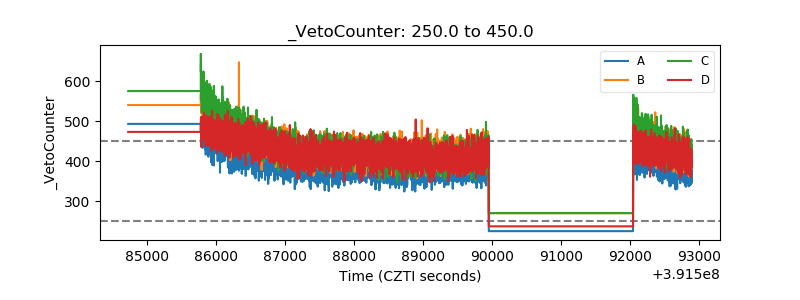 |