| Param | Original file | Final file |
|---|---|---|
| Filename | modeM0/AS1T04_069T01_9000005158_36052cztM0_level2.evt | modeM0/AS1T04_069T01_9000005158_36052cztM0_level2_quad_clean.evt |
| Size (bytes) | 1,553,192,640 | 185,114,880 |
| Size | 1.4 GB | 176.5 MB |
| Events in quadrant A | 7,414,826 | 1,209,924 |
| Events in quadrant B | 10,106,566 | 1,168,855 |
| Events in quadrant C | 13,303,714 | 1,127,632 |
| Events in quadrant D | 15,154,791 | 1,014,217 |
| Mode M0 | |||
|---|---|---|---|
| Quadrant | BADHDUFLAG | Total packets | Discarded packets |
| A | 0 | 32313 | 5 |
| B | 0 | 40307 | 4 |
| C | 0 | 49783 | 4 |
| D | 0 | 55619 | 4 |
| Mode M9 | |||
|---|---|---|---|
| Quadrant | BADHDUFLAG | Total packets | Discarded packets |
| A | 0 | 55 | 0 |
| B | 0 | 55 | 0 |
| C | 0 | 55 | 0 |
| D | 0 | 55 | 0 |
| Mode SS | |||
|---|---|---|---|
| Quadrant | BADHDUFLAG | Total packets | Discarded packets |
| A | 0 | 324 | 0 |
| B | 0 | 324 | 0 |
| C | 0 | 324 | 0 |
| D | 0 | 324 | 0 |
| Quadrant | Total seconds | Saturated seconds | Saturation percentage |
|---|---|---|---|
| A | 15716 | 28 | 0.178162% |
| B | 15716 | 645 | 4.104098% |
| C | 15716 | 1958 | 12.458641% |
| D | 15716 | 1965 | 12.503181% |
Noise dominated data is calculated using 1-second bins in cleaned event files. If a bin has >2000 counts, and if more than 50% of those come from <1% of pixels, then it is considered to be noise-dominated and hence unusable.
| Quadrant | # 1 sec bins | Bins with >0 counts | Bins with >2000 counts | High rate bins dominated by noise | Noise dominated (total time) | Noise dominated (detector-on time) | Marked lightcurve |
|---|---|---|---|---|---|---|---|
| A | 21240 | 15720 | 0 | 0 | 0.00% | 0.00% | 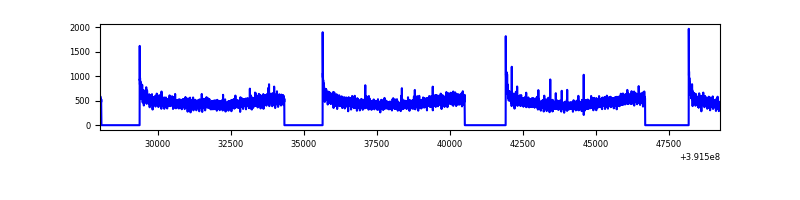 |
| B | 21240 | 15720 | 402 | 402 | 1.89% | 2.56% | 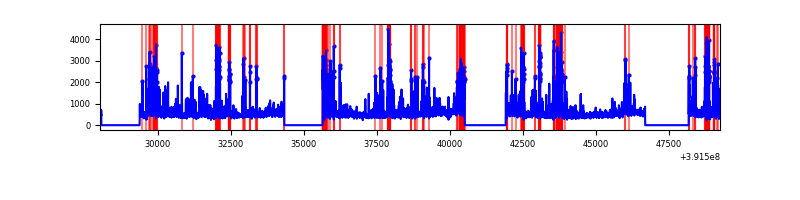 |
| C | 21240 | 15720 | 1580 | 1580 | 7.44% | 10.05% | 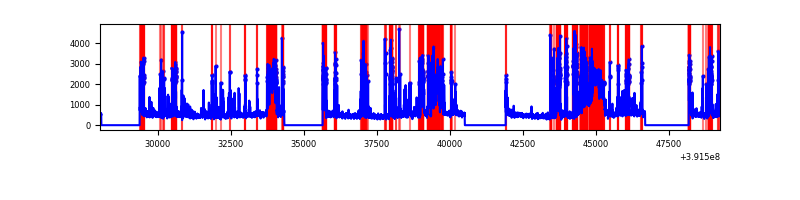 |
| D | 21240 | 15720 | 1907 | 1907 | 8.98% | 12.13% | 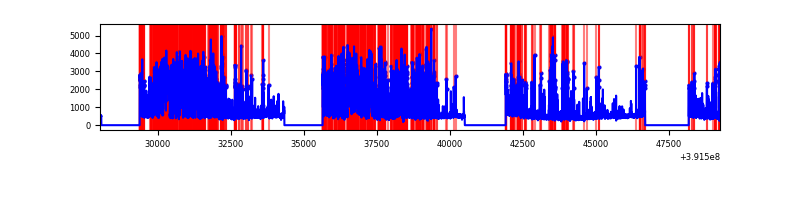 |
Top three noisy pixels from each quadrant. If the there are fewer than three noisy pixels in the level2.evt file, extra rows are filled as -1
| Pixel properties | Quadrant properties | ||||||
|---|---|---|---|---|---|---|---|
| Quadrant | DetID | PixID | Counts | Sigma | Mean | Median | Sigma |
| A | 10 | 83 | 437902 | 1208.04 | 1796 | 1764 | 361.0 |
| A | 13 | 254 | 25775 | 66.51 | 1796 | 1764 | 361.0 |
| A | 13 | 6 | 20016 | 50.56 | 1796 | 1764 | 361.0 |
| B | 5 | 236 | 1875425 | 5533.66 | 1757 | 1709 | 338.6 |
| B | 0 | 190 | 471810 | 1388.35 | 1757 | 1709 | 338.6 |
| B | 0 | 213 | 387959 | 1140.71 | 1757 | 1709 | 338.6 |
| C | 9 | 187 | 5078763 | 13441.28 | 1624 | 1633 | 377.7 |
| C | 0 | 207 | 821424 | 2170.33 | 1624 | 1633 | 377.7 |
| C | 15 | 214 | 615898 | 1626.22 | 1624 | 1633 | 377.7 |
| D | 12 | 235 | 5471517 | 13579.1 | 1640 | 1595 | 402.8 |
| D | 12 | 6 | 1102456 | 2732.89 | 1640 | 1595 | 402.8 |
| D | 12 | 17 | 452143 | 1118.49 | 1640 | 1595 | 402.8 |
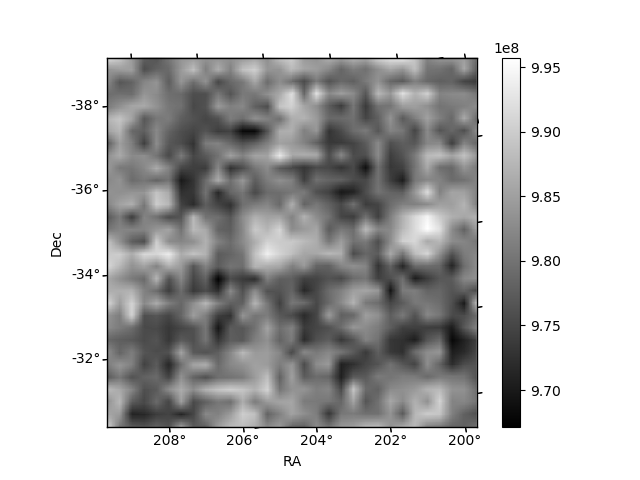
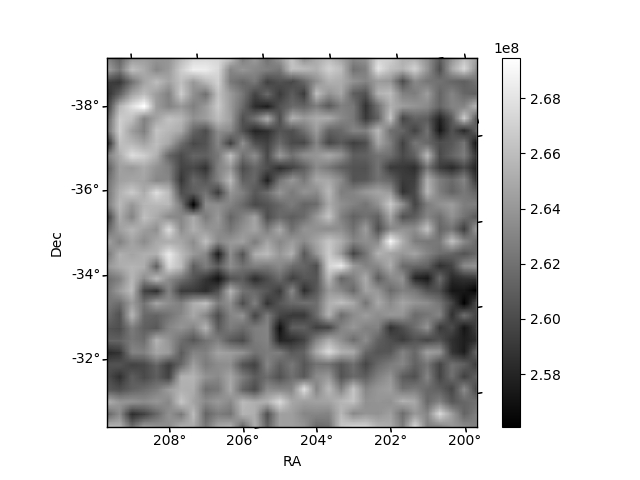
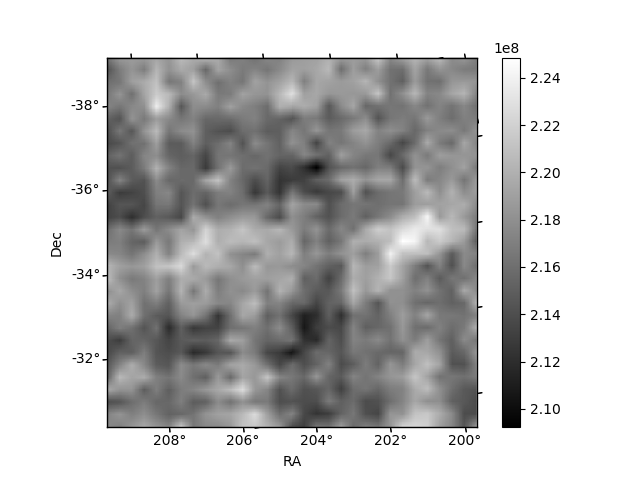
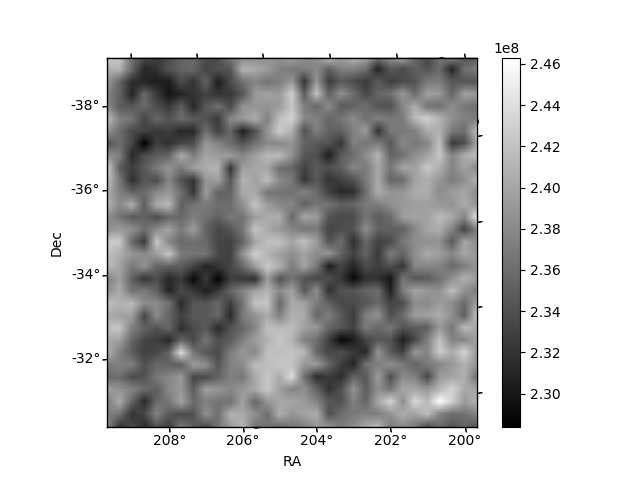
Histogram calculated using DETX and DETY for each event in the final _common_clean file
| Quadrant A | 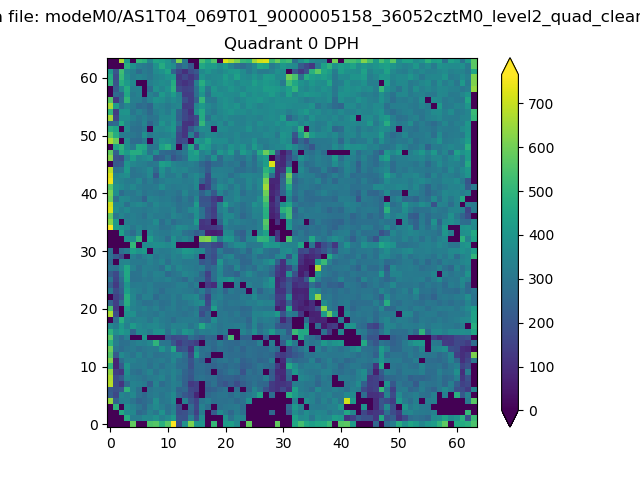 |
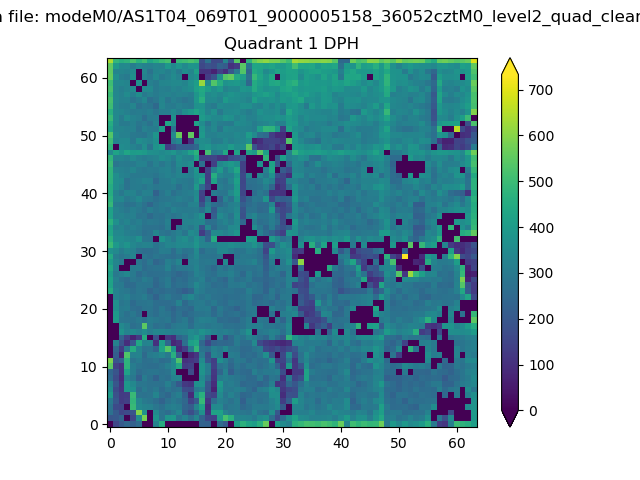 |
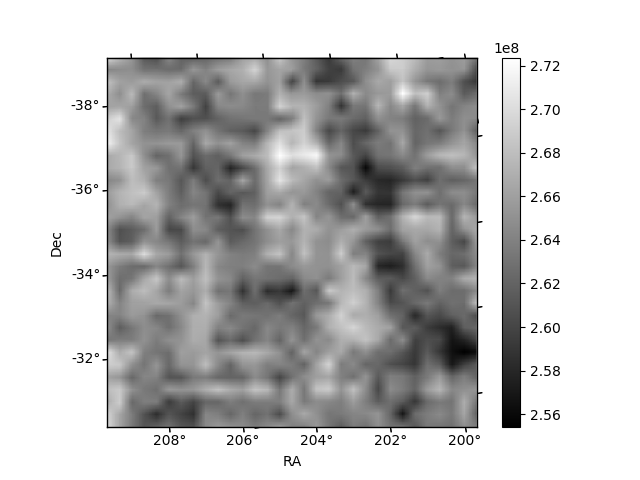
Quadrant B |
|---|---|---|---|
| Quadrant D | 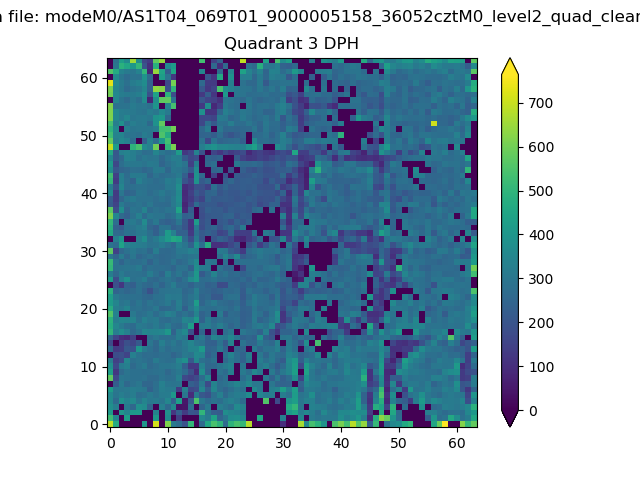 |
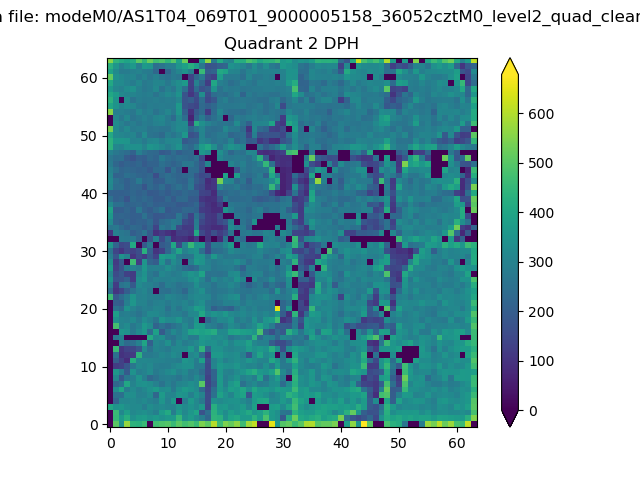 |
Quadrant C |
| Plot type | Count rate plots | Images |
|---|---|---|
| Comparison with Poisson distribution Blue bars denote a histogram of data divided into 1 sec bins. Red curve is a Poisson curve with rate = median count rate of data. |
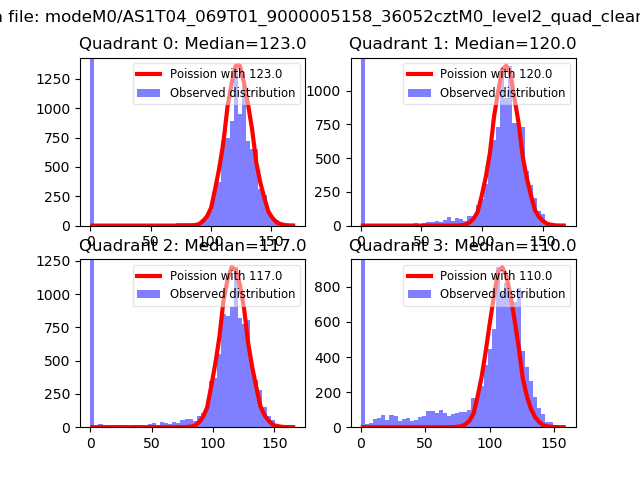 |
 |
| Quadrant-wise count rates Data is divided into 100 sec bins |
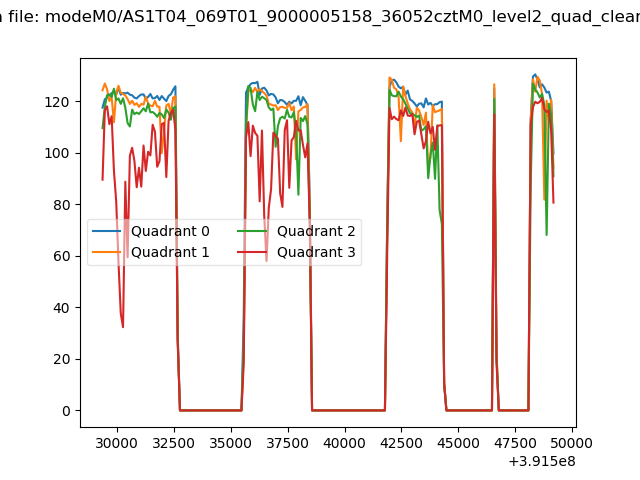 |
|
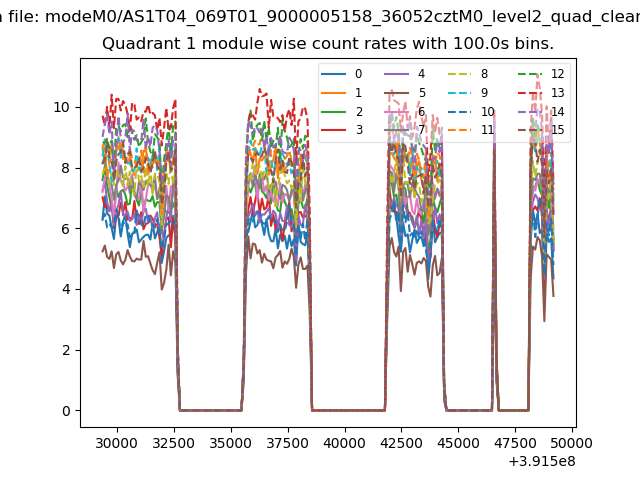
| Module-wise count rates for Quadrant A Data is divided into 100 sec bins |
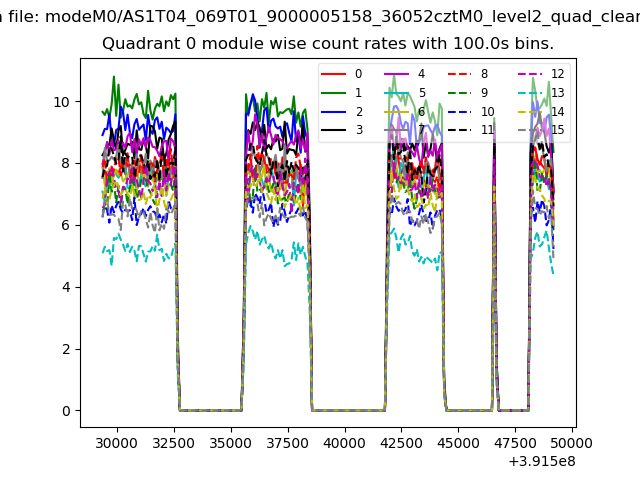 |
 |
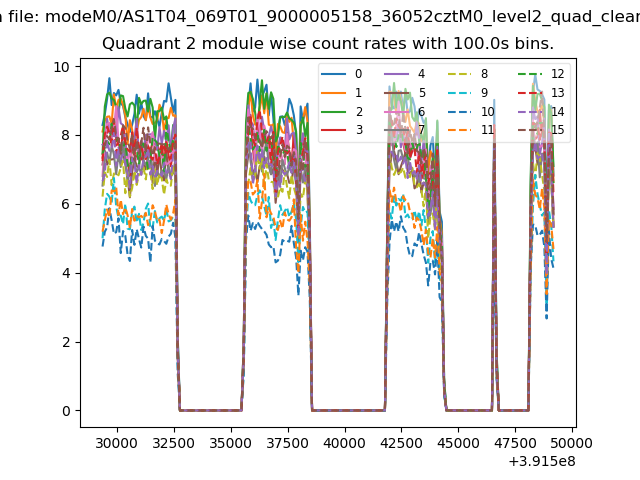
| Module-wise count rates for Quadrant B Data is divided into 100 sec bins |
 |
 |
| Module-wise count rates for Quadrant C Data is divided into 100 sec bins |
 |
 |
| Module-wise count rates for Quadrant D Data is divided into 100 sec bins |
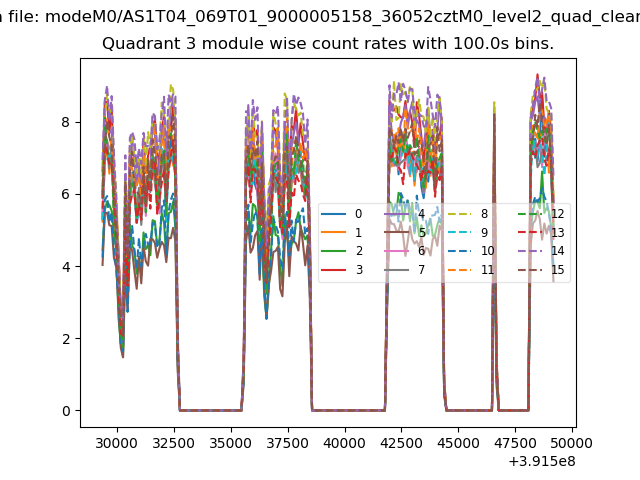 |
 |
| Parameter | Plot |
|---|---|
| CZT HV Monitor | 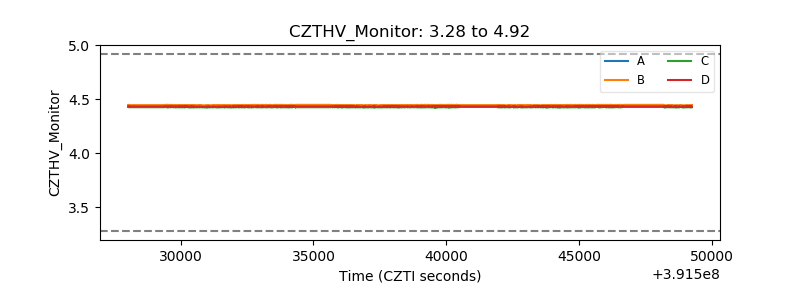 |
| D_VDD | 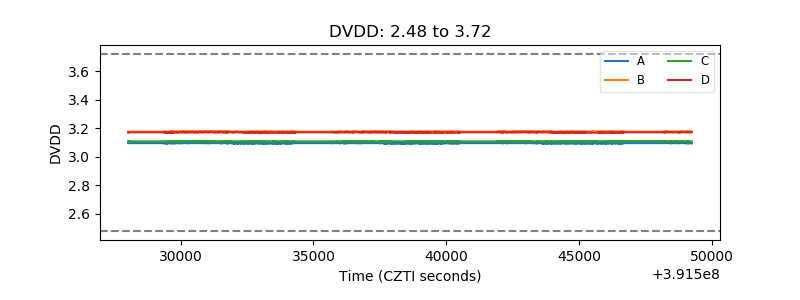 |
| Temperature 1 | 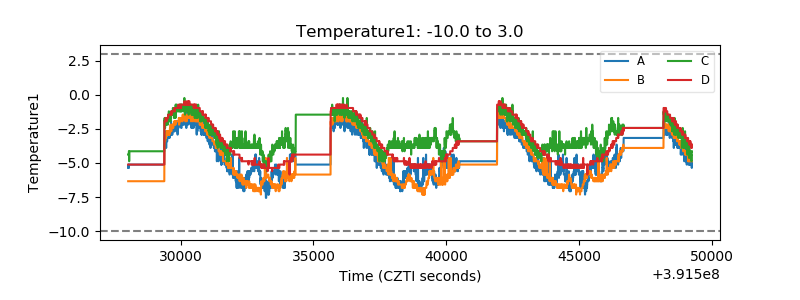 |
| Veto HV Monitor | 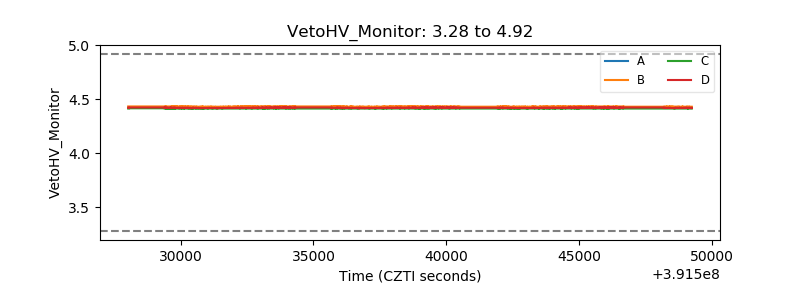 |
| Veto LLD | 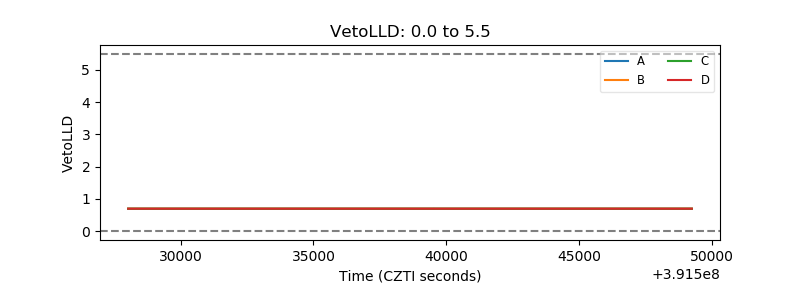 |
| Alpha Counter | 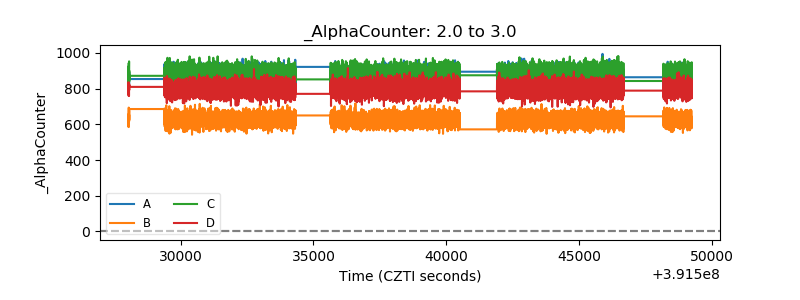 |
| _CPM_Rate | 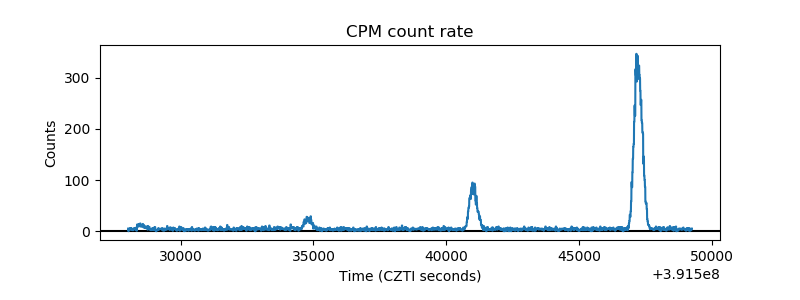 |
| CZT Counter | 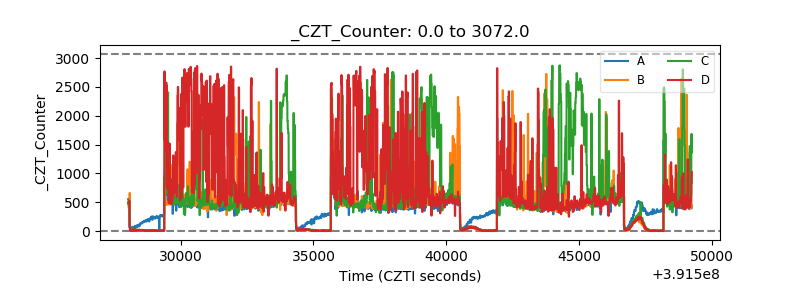 |
| +2.5 Volts monitor | 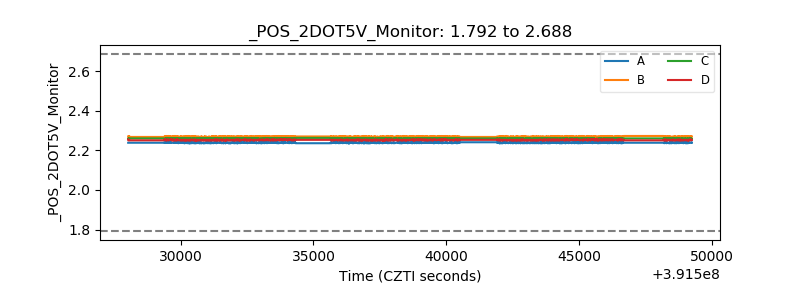 |
| +5 Volts monitor | 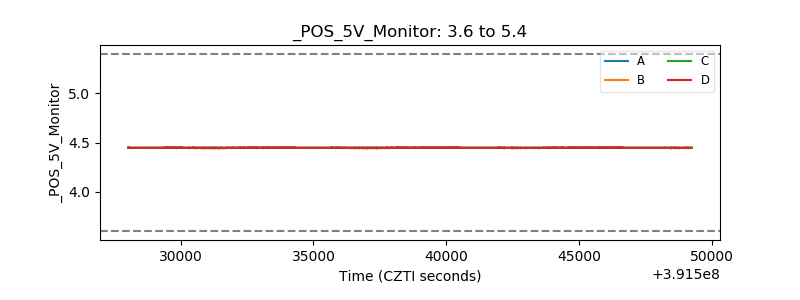 |
| _ROLL_ROT | 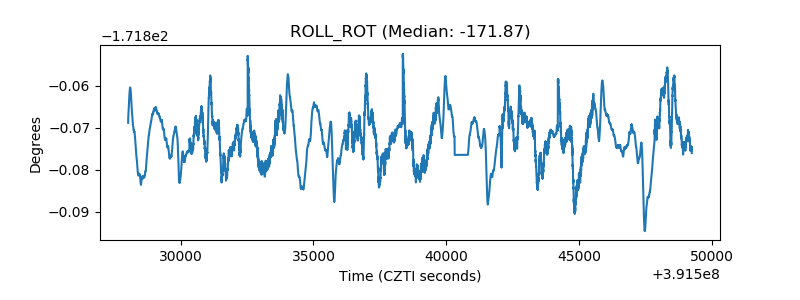 |
| _Roll_DEC | 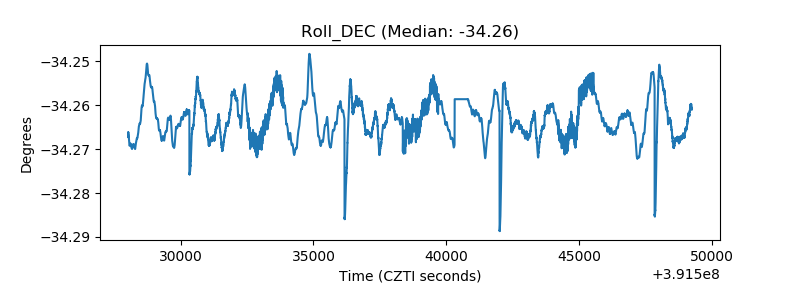 |
| _Roll_RA | 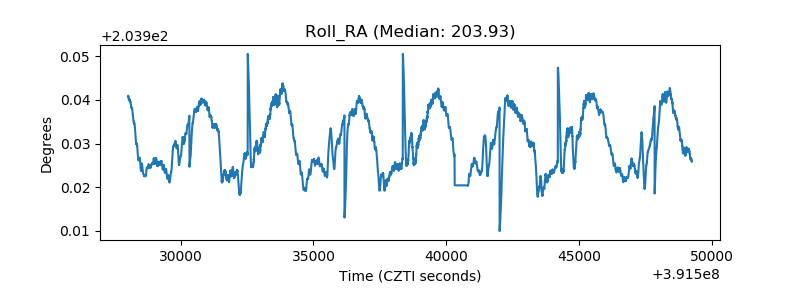 |
| Veto Counter | 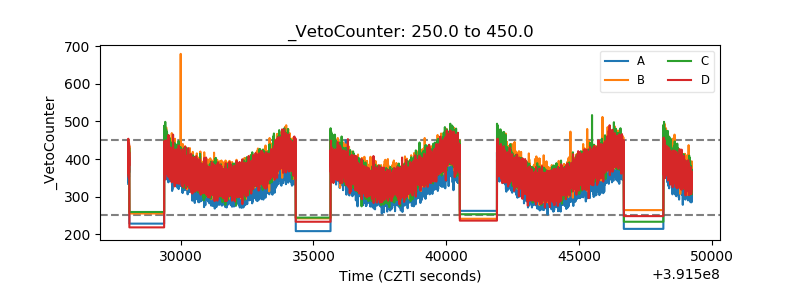 |