| Param | Original file | Final file |
|---|---|---|
| Filename | modeM0/AS1T04_069T01_9000005158_36044cztM0_level2.evt | modeM0/AS1T04_069T01_9000005158_36044cztM0_level2_quad_clean.evt |
| Size (bytes) | 403,462,080 | 46,808,640 |
| Size | 384.8 MB | 44.6 MB |
| Events in quadrant A | 2,630,606 | 268,664 |
| Events in quadrant B | 2,846,167 | 273,991 |
| Events in quadrant C | 3,126,044 | 269,426 |
| Events in quadrant D | 3,271,504 | 249,291 |
| Mode M0 | |||
|---|---|---|---|
| Quadrant | BADHDUFLAG | Total packets | Discarded packets |
| A | 0 | 10650 | 3 |
| B | 0 | 11384 | 2 |
| C | 0 | 12109 | 2 |
| D | 0 | 12910 | 2 |
| Mode M9 | |||
|---|---|---|---|
| Quadrant | BADHDUFLAG | Total packets | Discarded packets |
| A | 0 | 30 | 0 |
| B | 0 | 30 | 0 |
| C | 0 | 30 | 0 |
| D | 0 | 31 | 0 |
| Mode SS | |||
|---|---|---|---|
| Quadrant | BADHDUFLAG | Total packets | Discarded packets |
| A | 0 | 102 | 0 |
| B | 0 | 102 | 0 |
| C | 0 | 102 | 0 |
| D | 0 | 102 | 0 |
| Quadrant | Total seconds | Saturated seconds | Saturation percentage |
|---|---|---|---|
| A | 5075 | 10 | 0.197044% |
| B | 5075 | 38 | 0.748768% |
| C | 5075 | 104 | 2.049261% |
| D | 5075 | 146 | 2.876847% |
Noise dominated data is calculated using 1-second bins in cleaned event files. If a bin has >2000 counts, and if more than 50% of those come from <1% of pixels, then it is considered to be noise-dominated and hence unusable.
| Quadrant | # 1 sec bins | Bins with >0 counts | Bins with >2000 counts | High rate bins dominated by noise | Noise dominated (total time) | Noise dominated (detector-on time) | Marked lightcurve |
|---|---|---|---|---|---|---|---|
| A | 7198 | 5076 | 0 | 0 | 0.00% | 0.00% | 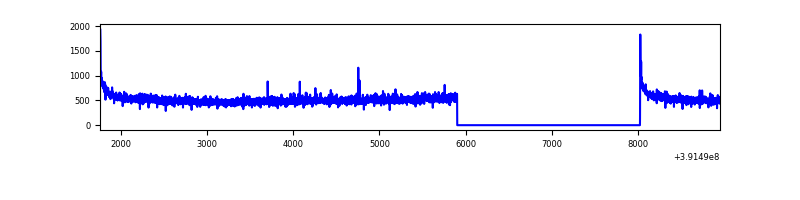 |
| B | 7198 | 5076 | 22 | 22 | 0.31% | 0.43% | 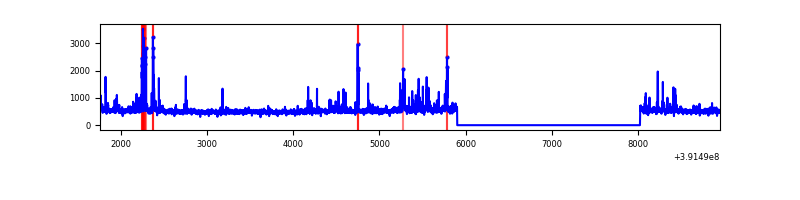 |
| C | 7198 | 5076 | 83 | 83 | 1.15% | 1.64% | 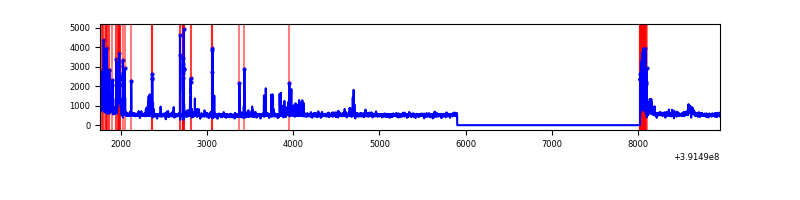 |
| D | 7198 | 5076 | 121 | 121 | 1.68% | 2.38% | 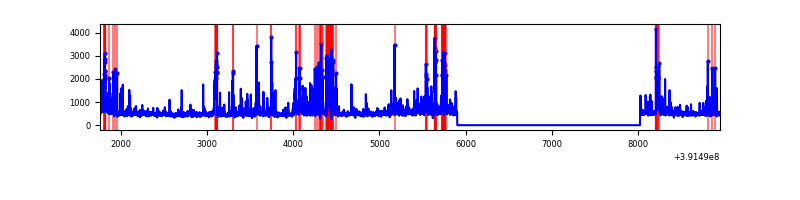 |
Top three noisy pixels from each quadrant. If the there are fewer than three noisy pixels in the level2.evt file, extra rows are filled as -1
| Pixel properties | Quadrant properties | ||||||
|---|---|---|---|---|---|---|---|
| Quadrant | DetID | PixID | Counts | Sigma | Mean | Median | Sigma |
| A | 10 | 83 | 167206 | 1318.55 | 630 | 619 | 126.3 |
| A | 13 | 6 | 11180 | 83.59 | 630 | 619 | 126.3 |
| A | 0 | 31 | 9403 | 69.53 | 630 | 619 | 126.3 |
| B | 5 | 236 | 142518 | 1194.7 | 631 | 616 | 118.8 |
| B | 5 | 172 | 74217 | 619.66 | 631 | 616 | 118.8 |
| B | 0 | 189 | 43429 | 360.45 | 631 | 616 | 118.8 |
| C | 0 | 207 | 245702 | 1734.28 | 613 | 618 | 141.3 |
| C | 15 | 214 | 211890 | 1495.01 | 613 | 618 | 141.3 |
| C | 0 | 10 | 183544 | 1294.43 | 613 | 618 | 141.3 |
| D | 12 | 6 | 563573 | 3798.92 | 609 | 593 | 148.2 |
| D | 10 | 118 | 150308 | 1010.26 | 609 | 593 | 148.2 |
| D | 13 | 249 | 67559 | 451.88 | 609 | 593 | 148.2 |
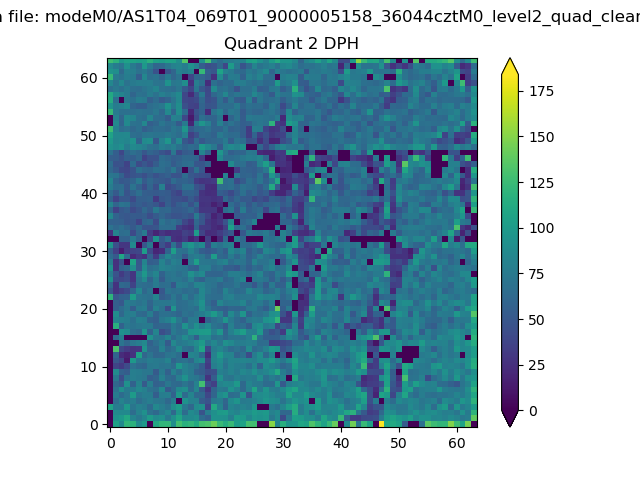
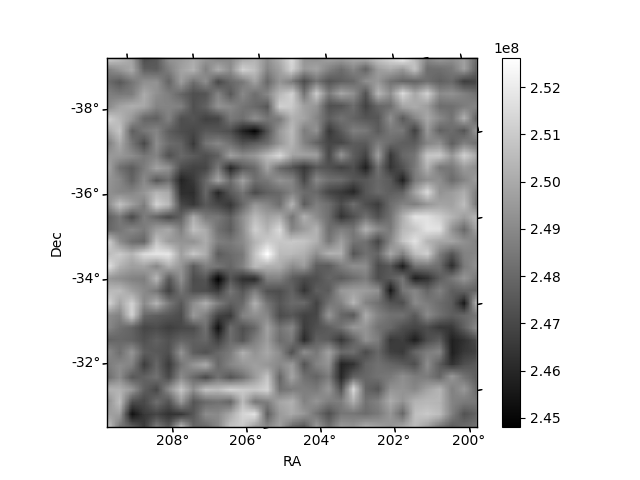
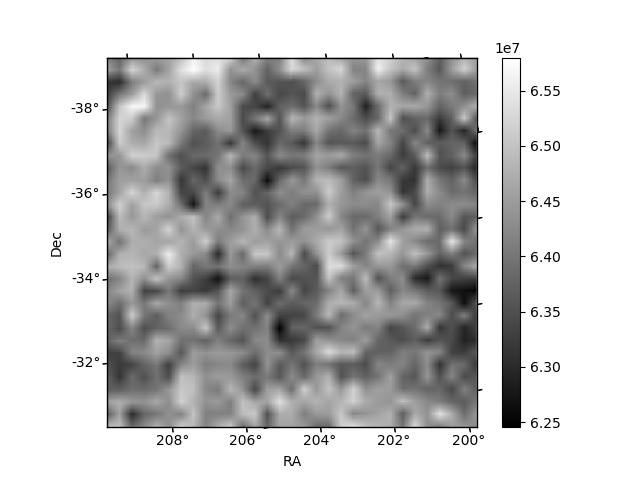
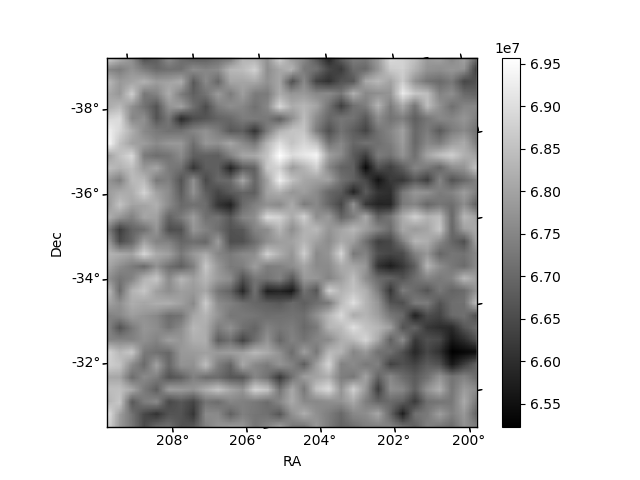
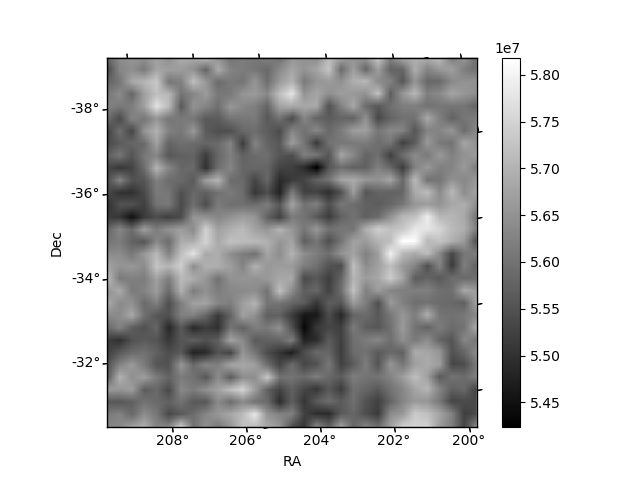
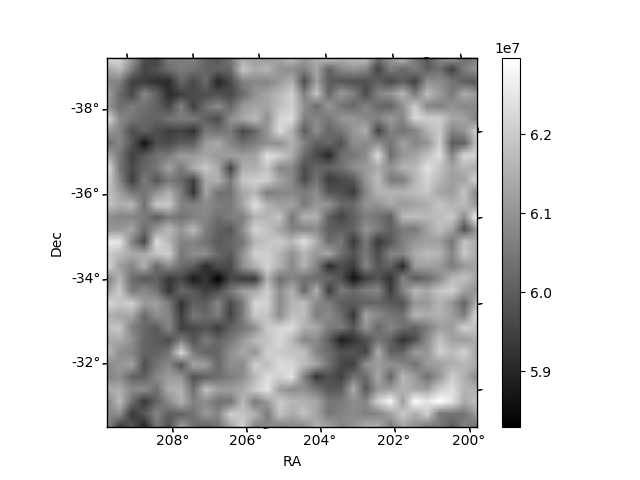
Histogram calculated using DETX and DETY for each event in the final _common_clean file
| Quadrant A | 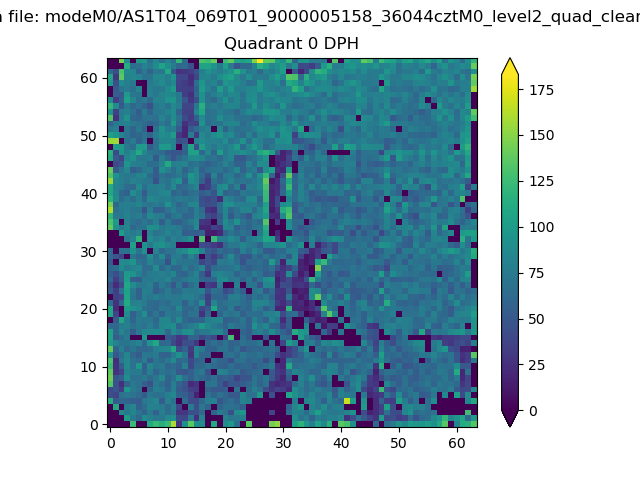 |
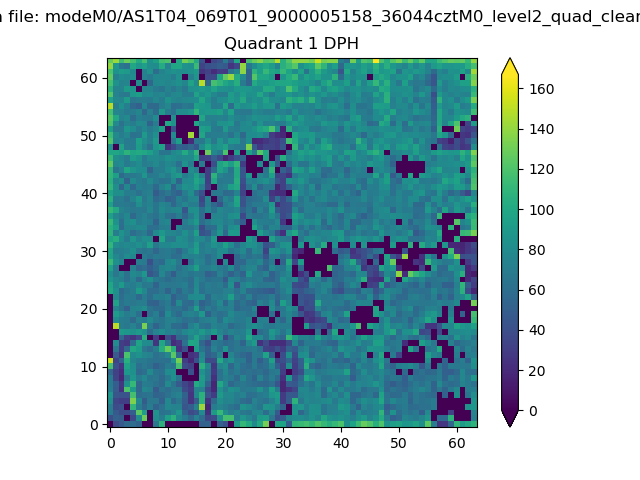 |
Quadrant B |
|---|---|---|---|
| Quadrant D | 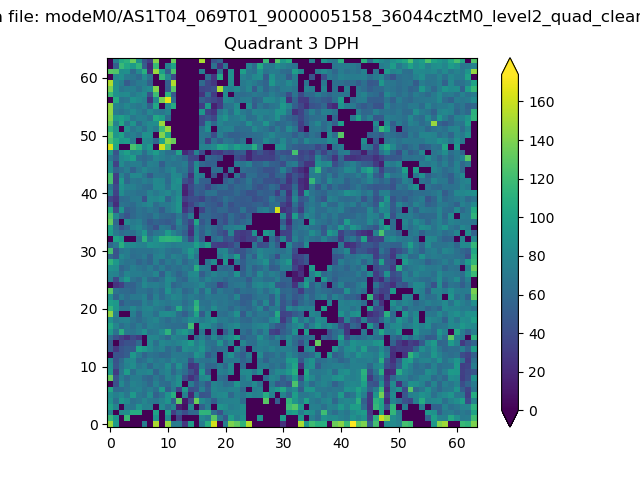 |
 |
Quadrant C |
| Plot type | Count rate plots | Images |
|---|---|---|
| Comparison with Poisson distribution Blue bars denote a histogram of data divided into 1 sec bins. Red curve is a Poisson curve with rate = median count rate of data. |
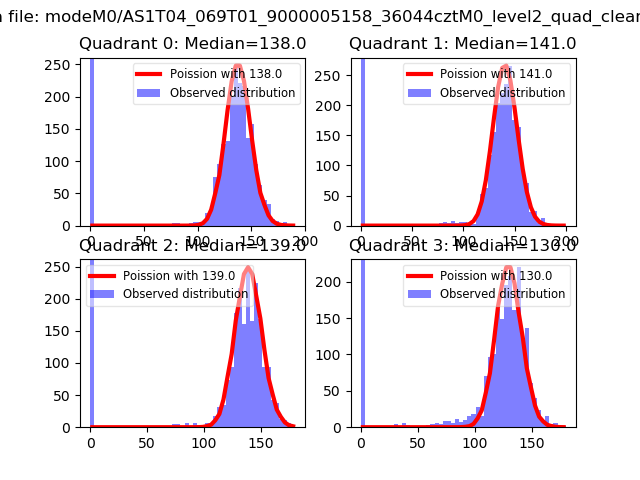 |
 |
| Quadrant-wise count rates Data is divided into 100 sec bins |
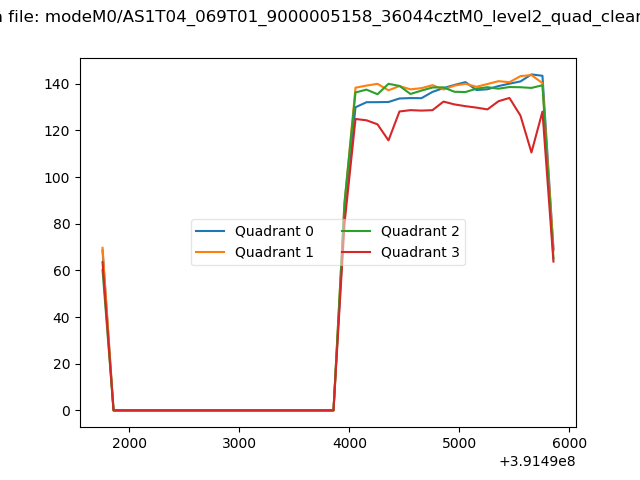 |
|
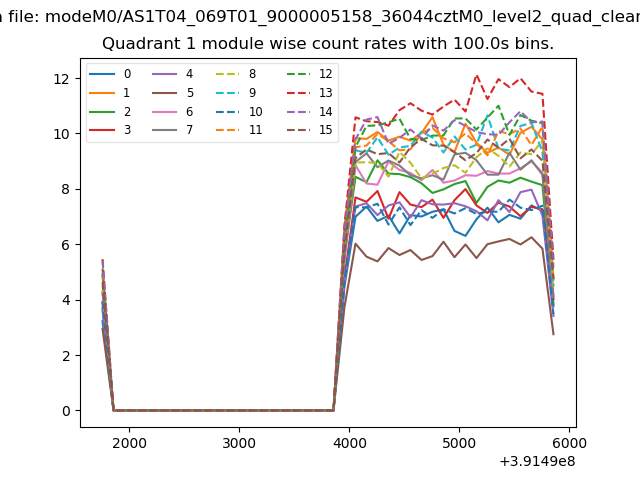
| Module-wise count rates for Quadrant A Data is divided into 100 sec bins |
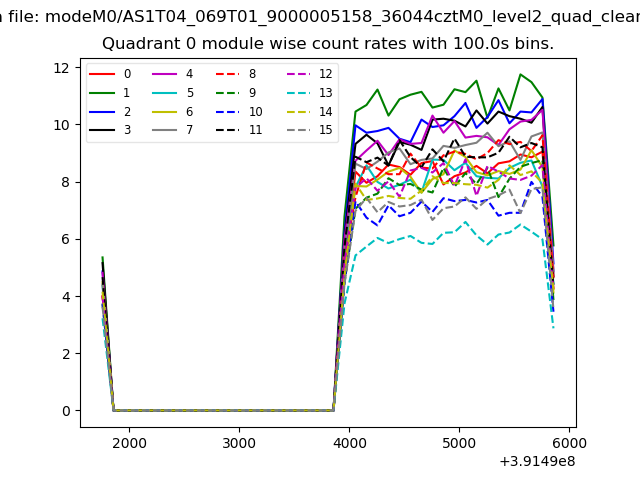 |
 |
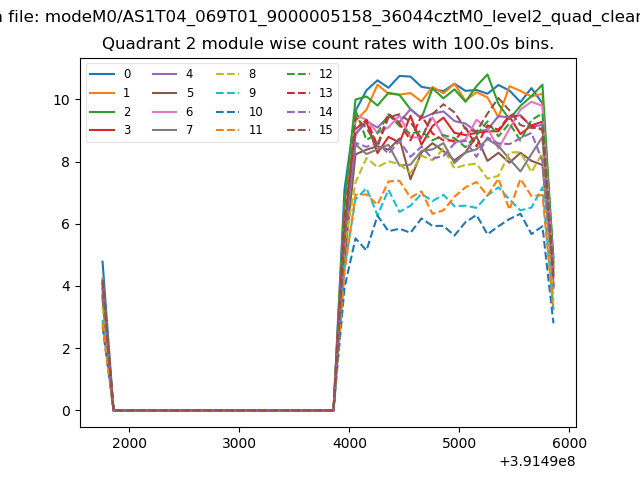
| Module-wise count rates for Quadrant B Data is divided into 100 sec bins |
 |
 |
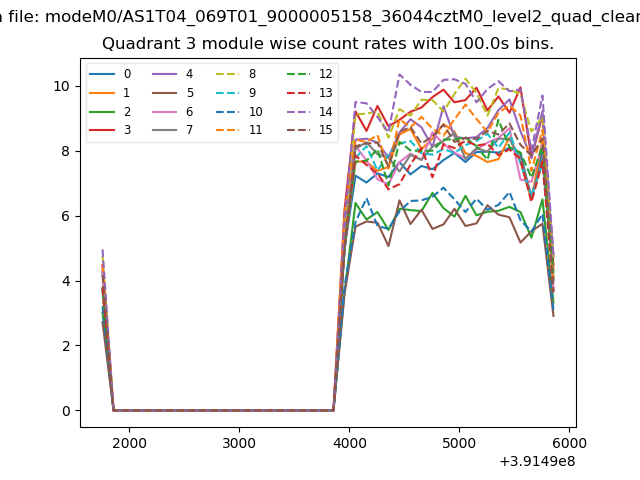
| Module-wise count rates for Quadrant C Data is divided into 100 sec bins |
 |
 |
| Module-wise count rates for Quadrant D Data is divided into 100 sec bins |
 |
 |
| Parameter | Plot |
|---|---|
| CZT HV Monitor | 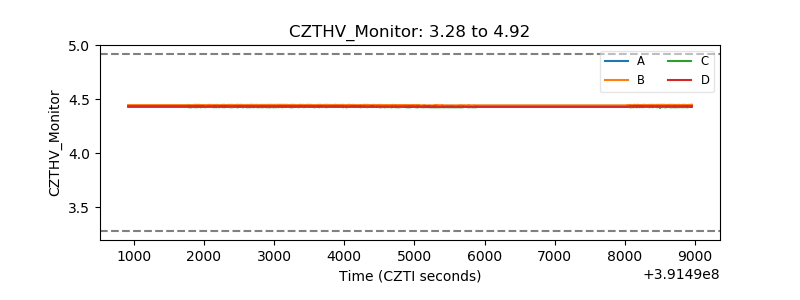 |
| D_VDD | 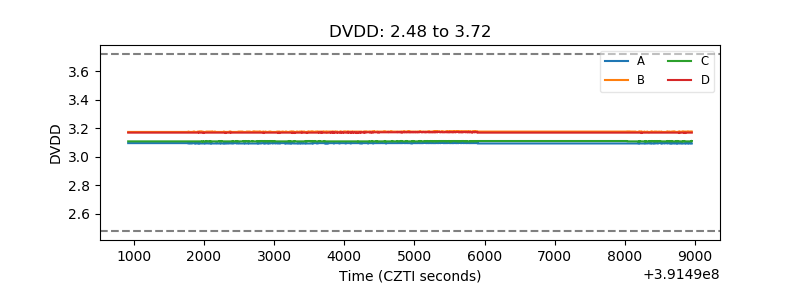 |
| Temperature 1 | 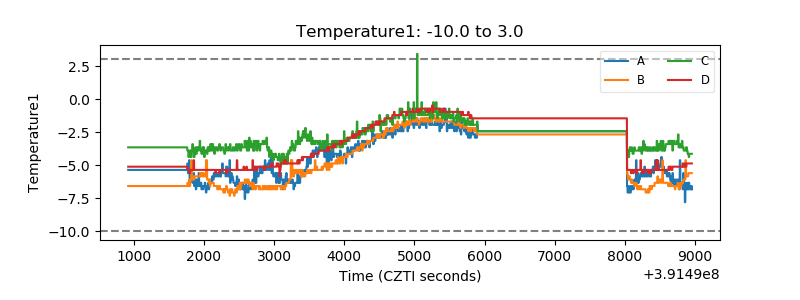 |
| Veto HV Monitor | 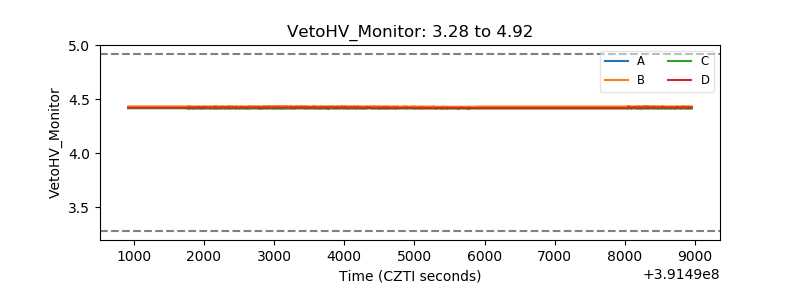 |
| Veto LLD | 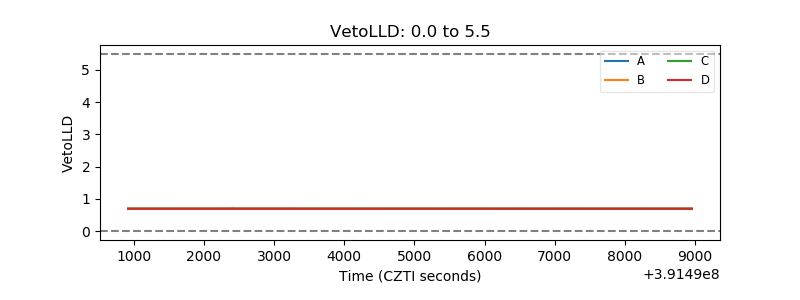 |
| Alpha Counter | 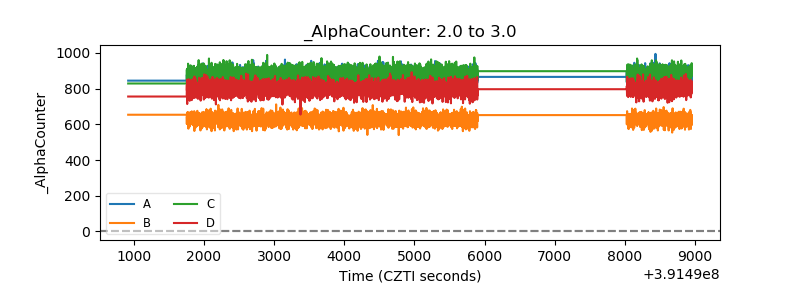 |
| _CPM_Rate | 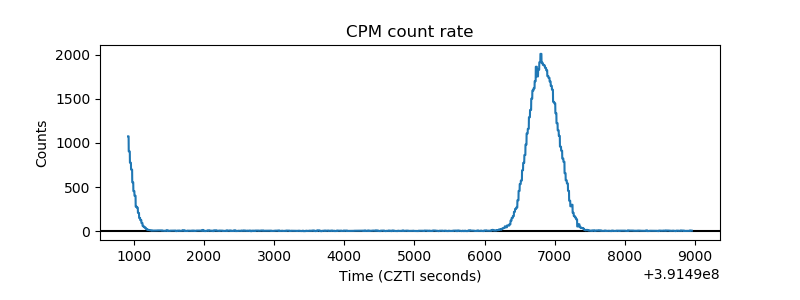 |
| CZT Counter | 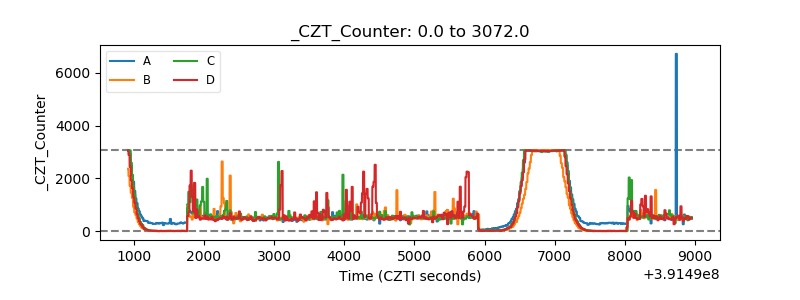 |
| +2.5 Volts monitor | 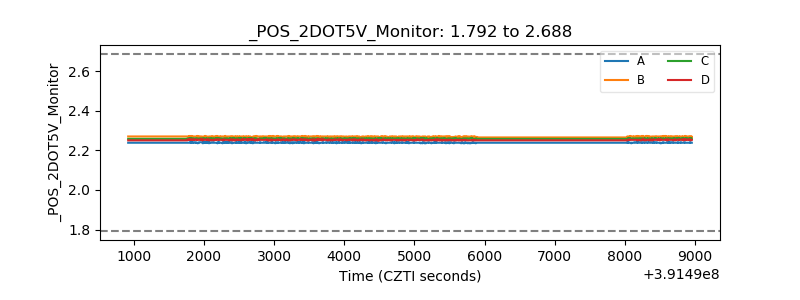 |
| +5 Volts monitor | 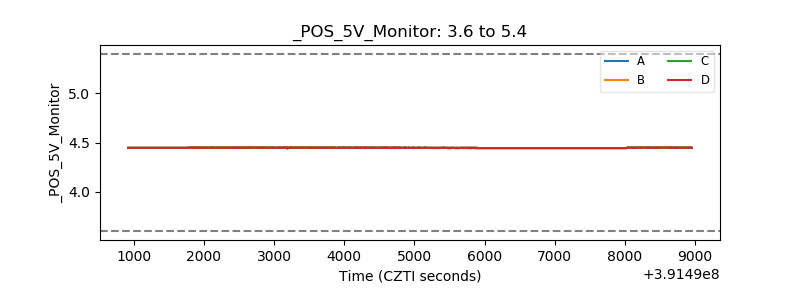 |
| _ROLL_ROT | 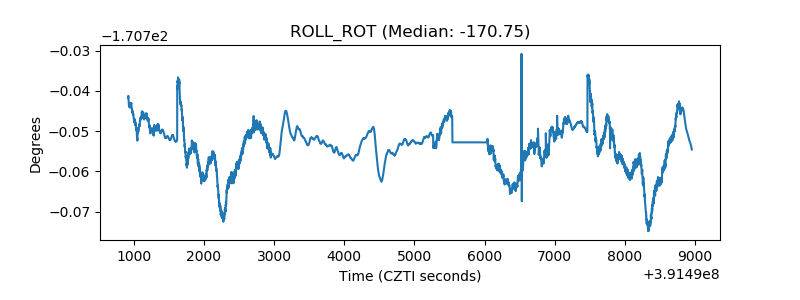 |
| _Roll_DEC | 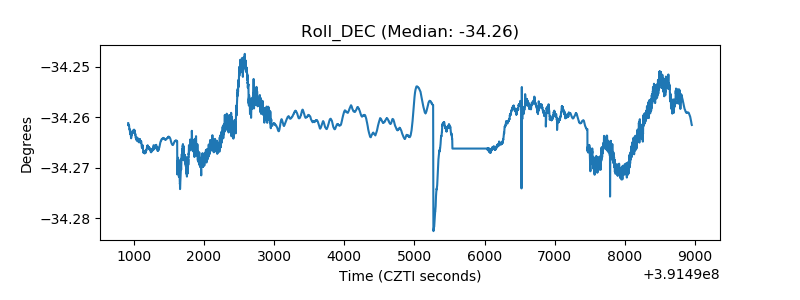 |
| _Roll_RA | 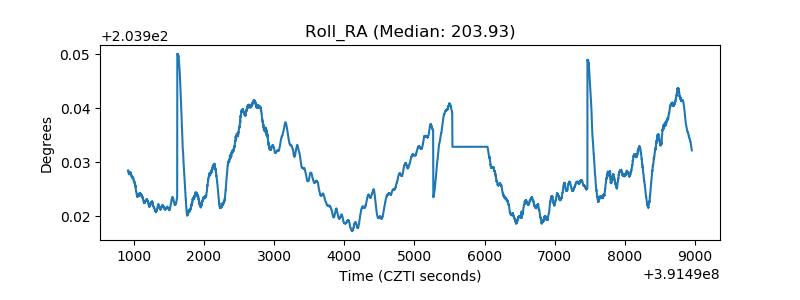 |
| Veto Counter | 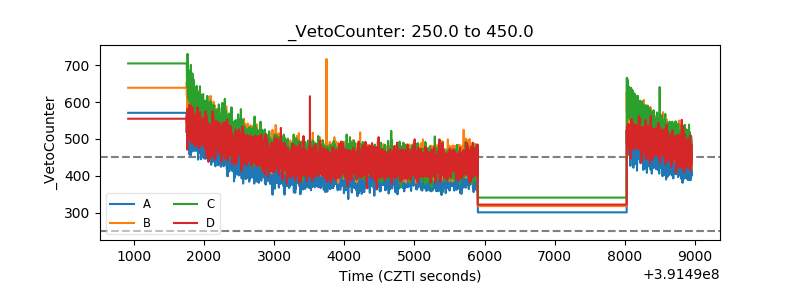 |