| Param | Original file | Final file |
|---|---|---|
| Filename | modeM0/AS1T04_069T01_9000005158_36043cztM0_level2.evt | modeM0/AS1T04_069T01_9000005158_36043cztM0_level2_quad_clean.evt |
| Size (bytes) | 476,582,400 | 49,124,160 |
| Size | 454.5 MB | 46.8 MB |
| Events in quadrant A | 2,678,363 | 292,245 |
| Events in quadrant B | 2,952,104 | 298,502 |
| Events in quadrant C | 3,316,386 | 289,862 |
| Events in quadrant D | 5,134,831 | 243,198 |
| Mode M0 | |||
|---|---|---|---|
| Quadrant | BADHDUFLAG | Total packets | Discarded packets |
| A | 0 | 10918 | 3 |
| B | 0 | 11872 | 2 |
| C | 0 | 12826 | 2 |
| D | 0 | 18586 | 2 |
| Mode M9 | |||
|---|---|---|---|
| Quadrant | BADHDUFLAG | Total packets | Discarded packets |
| A | 0 | 28 | 0 |
| B | 0 | 28 | 0 |
| C | 0 | 28 | 0 |
| D | 0 | 29 | 0 |
| Mode SS | |||
|---|---|---|---|
| Quadrant | BADHDUFLAG | Total packets | Discarded packets |
| A | 0 | 106 | 0 |
| B | 0 | 106 | 0 |
| C | 0 | 106 | 0 |
| D | 0 | 106 | 0 |
| Quadrant | Total seconds | Saturated seconds | Saturation percentage |
|---|---|---|---|
| A | 5179 | 11 | 0.212396% |
| B | 5179 | 62 | 1.197142% |
| C | 5179 | 99 | 1.911566% |
| D | 5179 | 966 | 18.652249% |
Noise dominated data is calculated using 1-second bins in cleaned event files. If a bin has >2000 counts, and if more than 50% of those come from <1% of pixels, then it is considered to be noise-dominated and hence unusable.
| Quadrant | # 1 sec bins | Bins with >0 counts | Bins with >2000 counts | High rate bins dominated by noise | Noise dominated (total time) | Noise dominated (detector-on time) | Marked lightcurve |
|---|---|---|---|---|---|---|---|
| A | 7212 | 5180 | 1 | 1 | 0.01% | 0.02% | 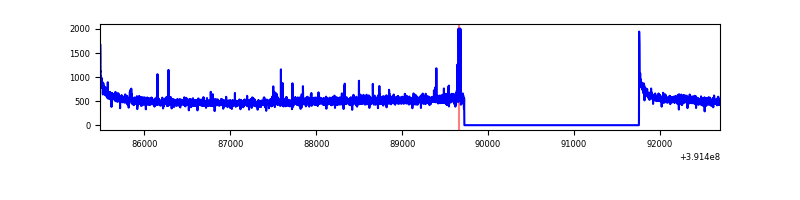 |
| B | 7212 | 5180 | 35 | 35 | 0.49% | 0.68% | 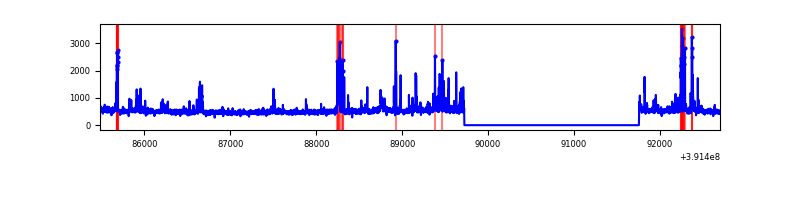 |
| C | 7212 | 5180 | 78 | 78 | 1.08% | 1.51% | 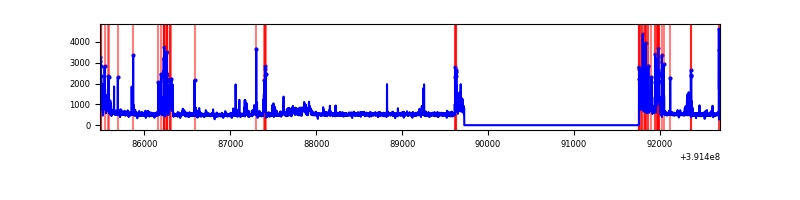 |
| D | 7212 | 5180 | 870 | 870 | 12.06% | 16.80% | 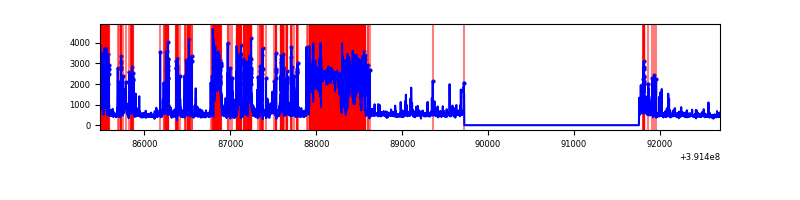 |
Top three noisy pixels from each quadrant. If the there are fewer than three noisy pixels in the level2.evt file, extra rows are filled as -1
| Pixel properties | Quadrant properties | ||||||
|---|---|---|---|---|---|---|---|
| Quadrant | DetID | PixID | Counts | Sigma | Mean | Median | Sigma |
| A | 10 | 83 | 162239 | 1265.49 | 638 | 627 | 127.7 |
| A | 0 | 31 | 38627 | 297.56 | 638 | 627 | 127.7 |
| A | 13 | 6 | 9757 | 71.49 | 638 | 627 | 127.7 |
| B | 5 | 172 | 213251 | 1756.78 | 638 | 621 | 121.0 |
| B | 5 | 236 | 99259 | 814.96 | 638 | 621 | 121.0 |
| B | 0 | 190 | 42712 | 347.76 | 638 | 621 | 121.0 |
| C | 9 | 187 | 312482 | 2180.04 | 619 | 625 | 143.1 |
| C | 15 | 214 | 214933 | 1498.12 | 619 | 625 | 143.1 |
| C | 0 | 207 | 159043 | 1107.42 | 619 | 625 | 143.1 |
| D | 12 | 6 | 2678273 | 19471.64 | 556 | 541 | 137.5 |
| D | 13 | 249 | 85557 | 618.21 | 556 | 541 | 137.5 |
| D | 15 | 0 | 37435 | 268.28 | 556 | 541 | 137.5 |
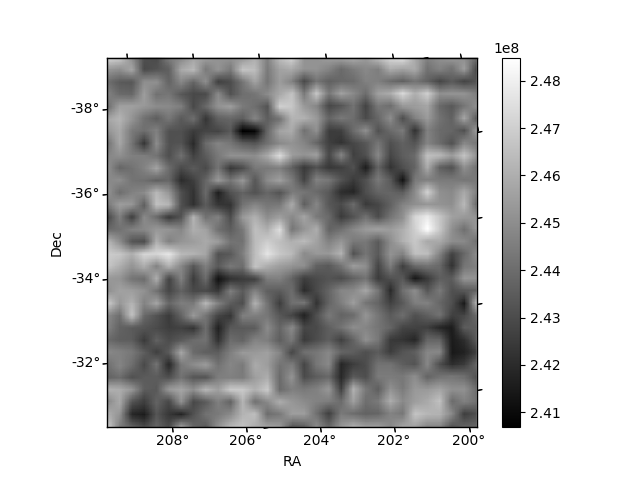
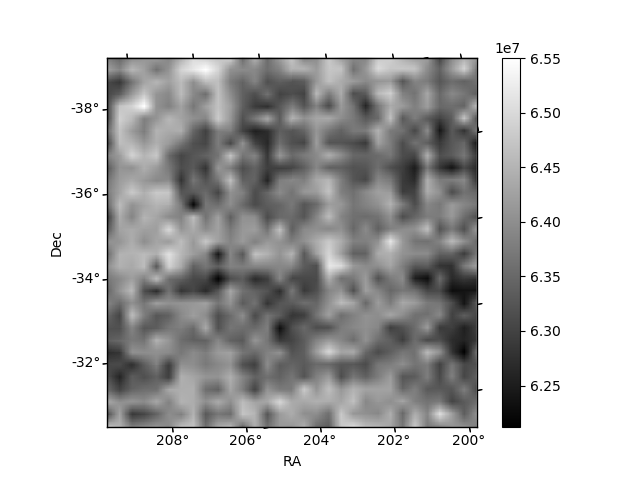
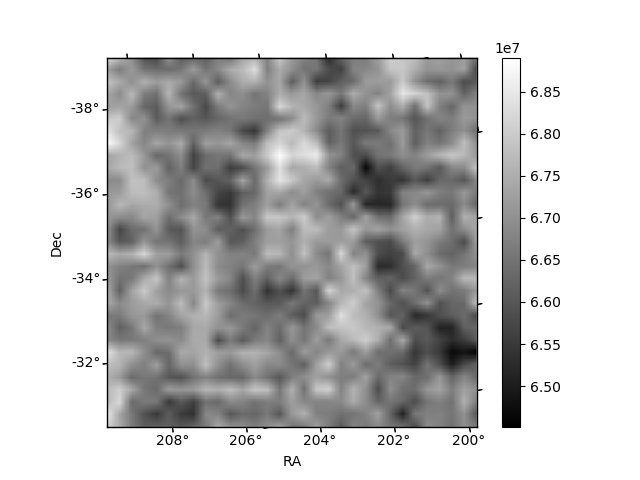
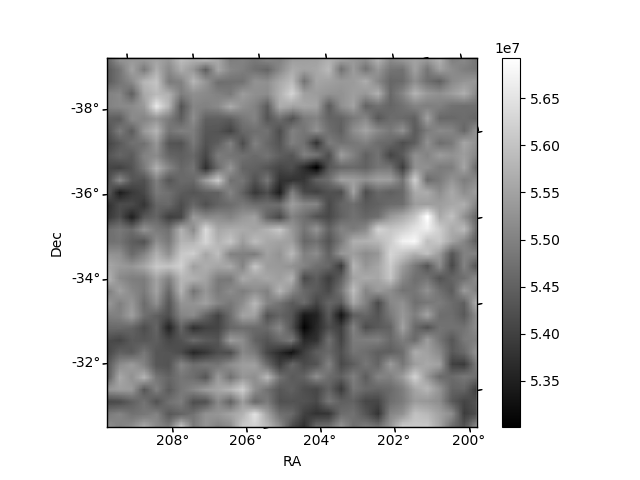
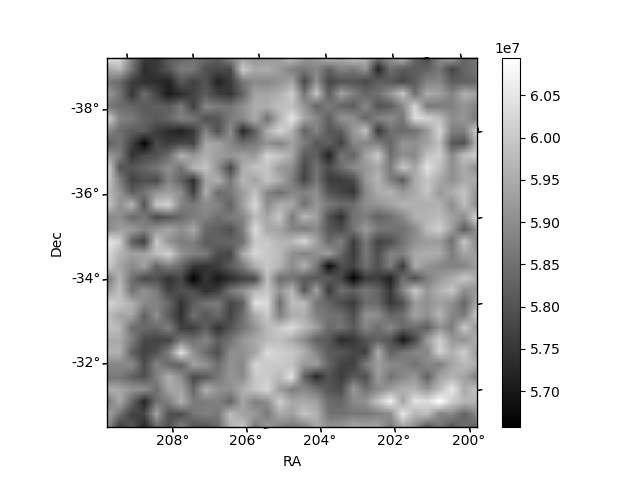
Histogram calculated using DETX and DETY for each event in the final _common_clean file
| Quadrant A | 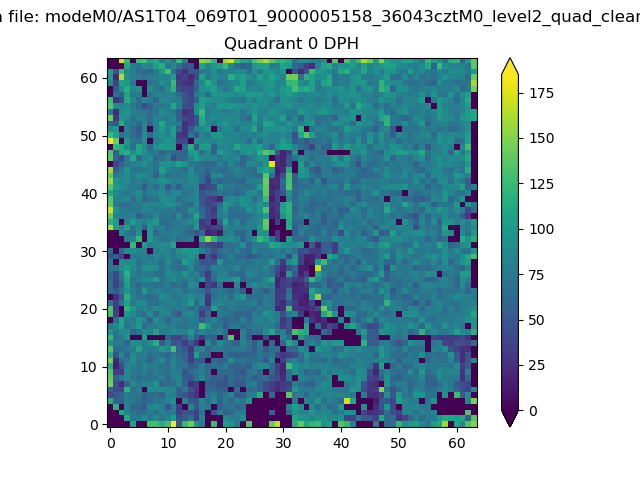 |
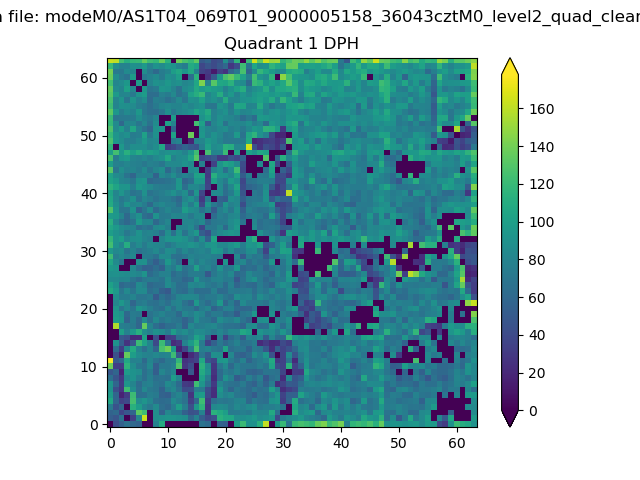 |
Quadrant B |
|---|---|---|---|
| Quadrant D | 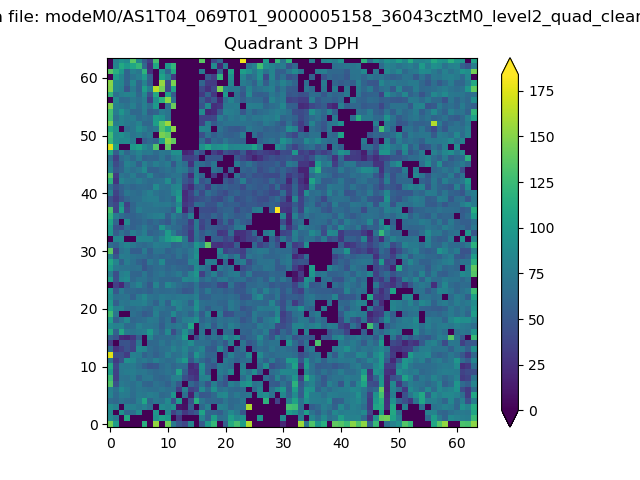 |
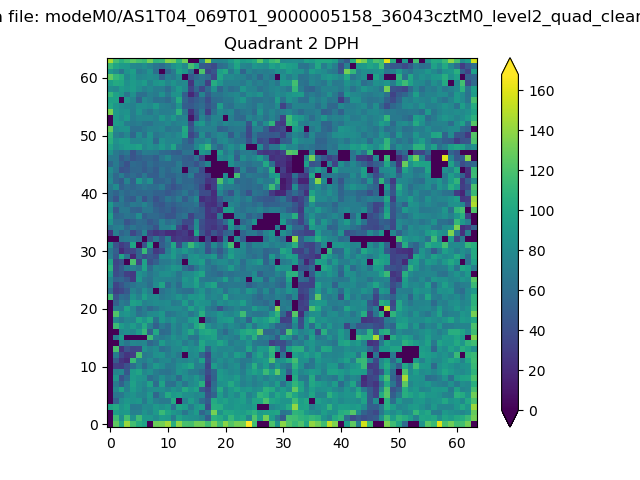 |
Quadrant C |
| Plot type | Count rate plots | Images |
|---|---|---|
| Comparison with Poisson distribution Blue bars denote a histogram of data divided into 1 sec bins. Red curve is a Poisson curve with rate = median count rate of data. |
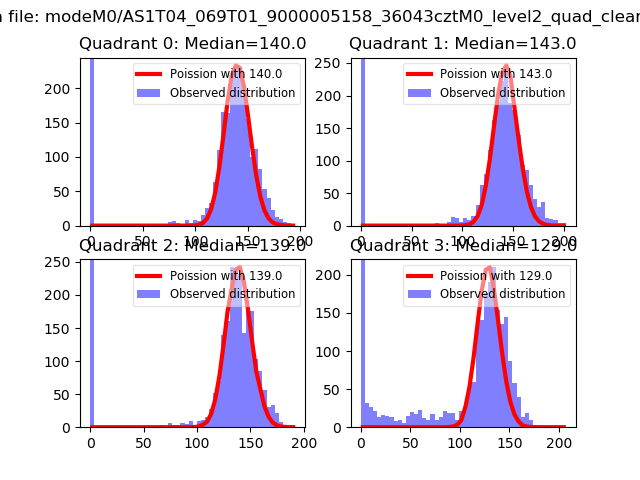 |
 |
| Quadrant-wise count rates Data is divided into 100 sec bins |
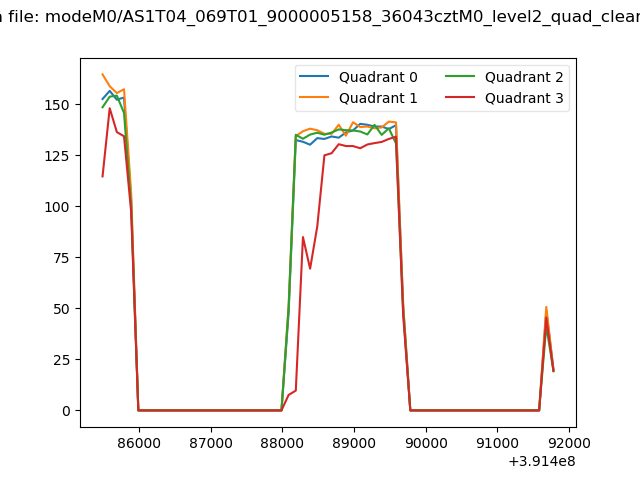 |
|
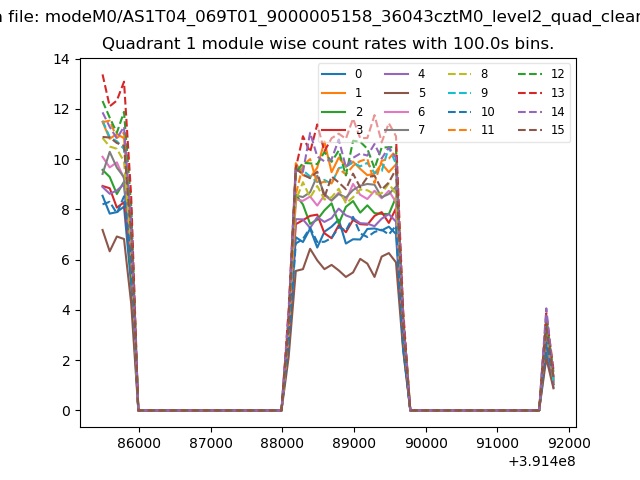
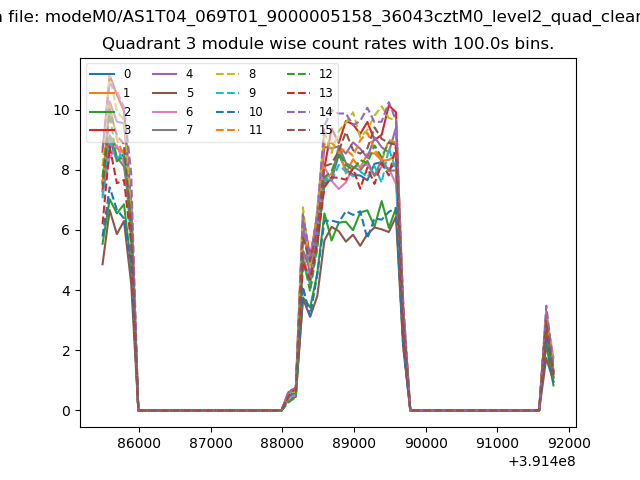
| Module-wise count rates for Quadrant A Data is divided into 100 sec bins |
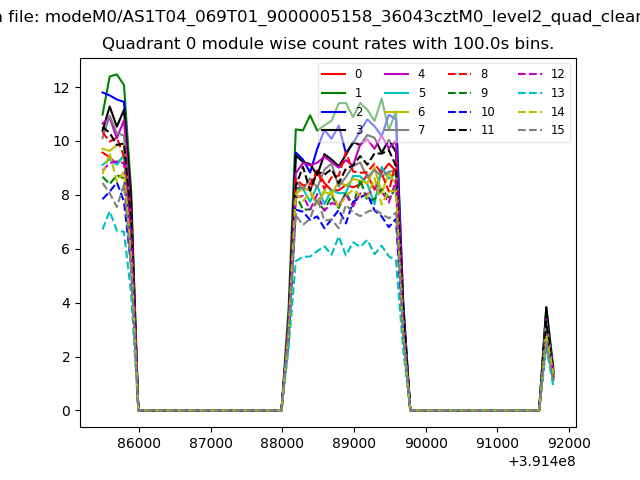 |
 |
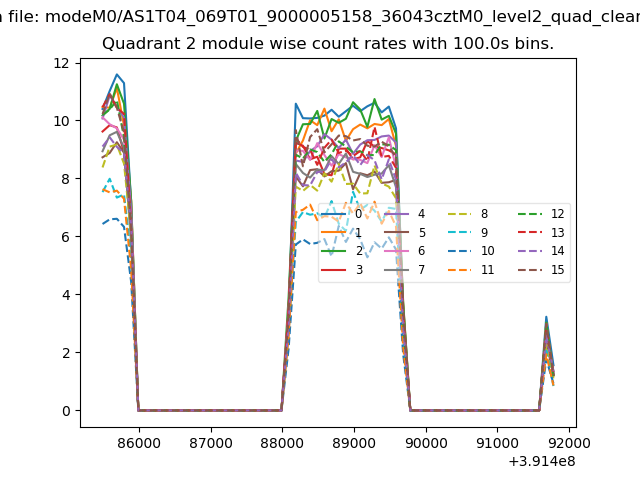
| Module-wise count rates for Quadrant B Data is divided into 100 sec bins |
 |
 |
| Module-wise count rates for Quadrant C Data is divided into 100 sec bins |
 |
 |
| Module-wise count rates for Quadrant D Data is divided into 100 sec bins |
 |
 |
| Parameter | Plot |
|---|---|
| CZT HV Monitor | 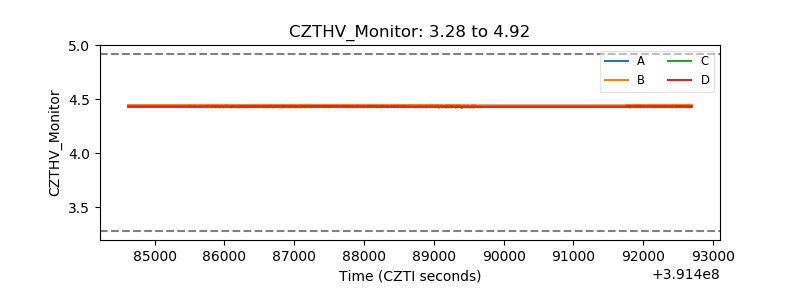 |
| D_VDD | 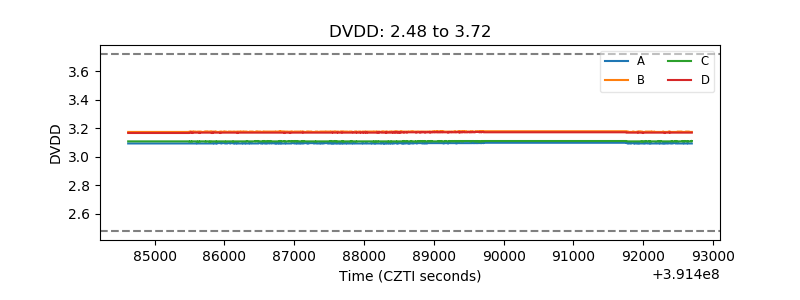 |
| Temperature 1 | 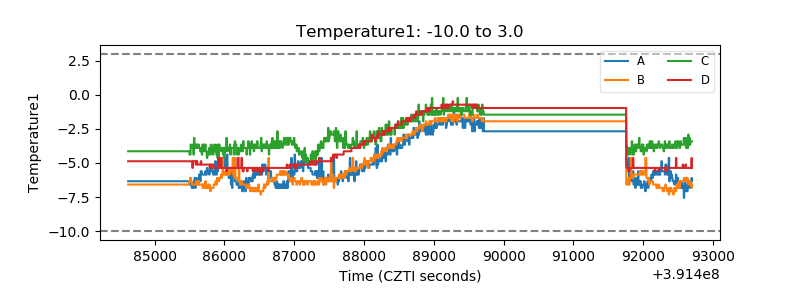 |
| Veto HV Monitor | 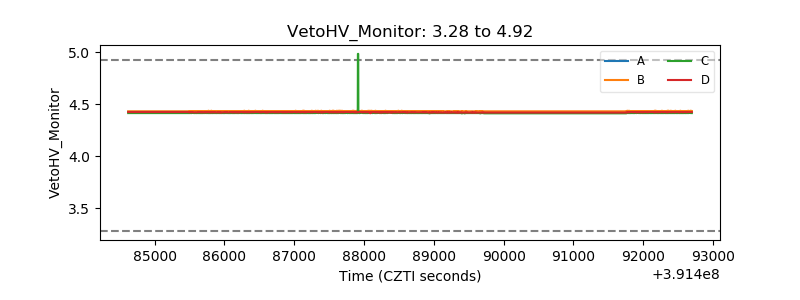 |
| Veto LLD | 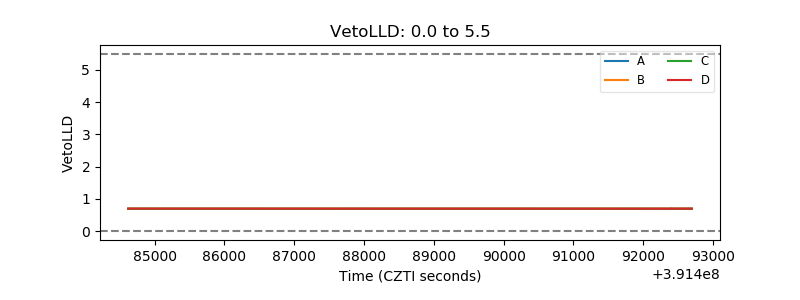 |
| Alpha Counter | 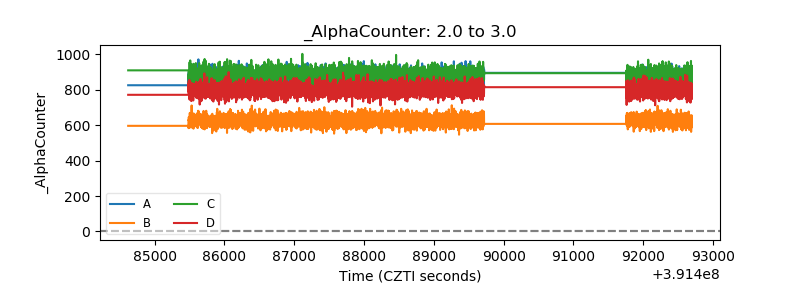 |
| _CPM_Rate | 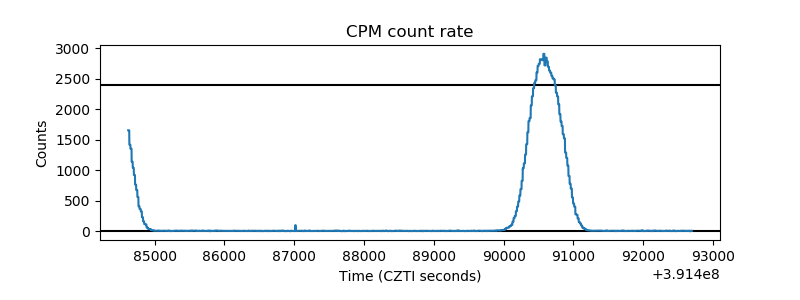 |
| CZT Counter |  |
| +2.5 Volts monitor | 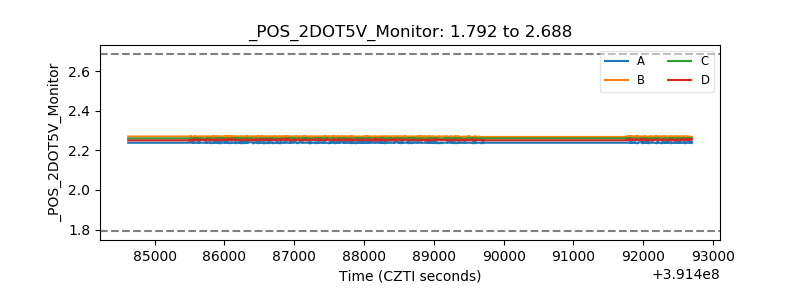 |
| +5 Volts monitor | 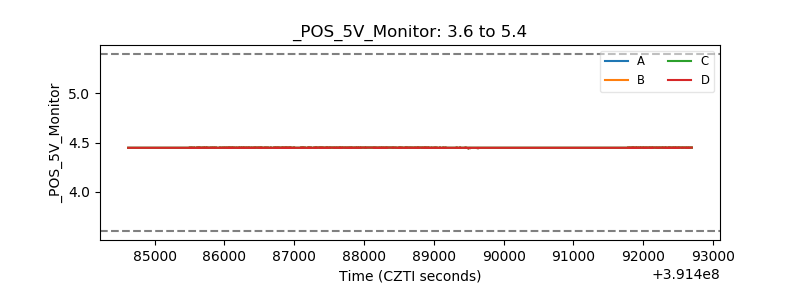 |
| _ROLL_ROT | 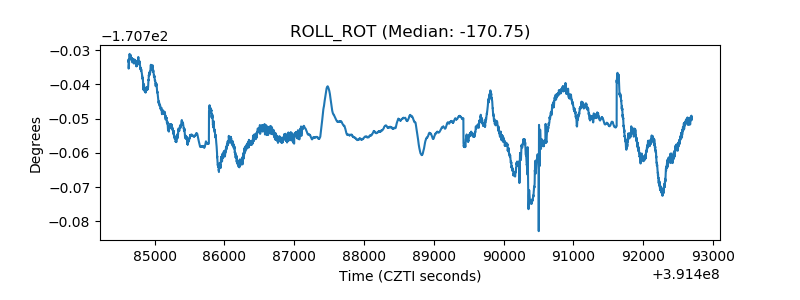 |
| _Roll_DEC | 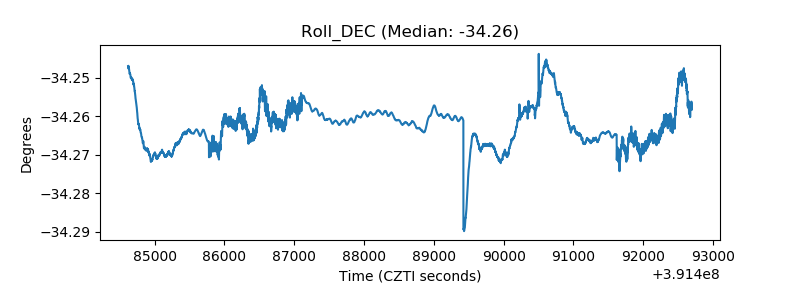 |
| _Roll_RA | 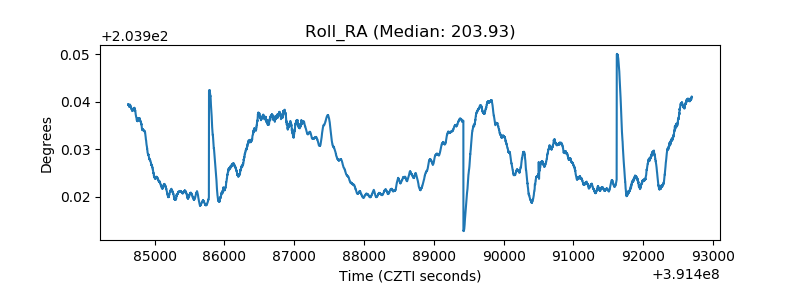 |
| Veto Counter | 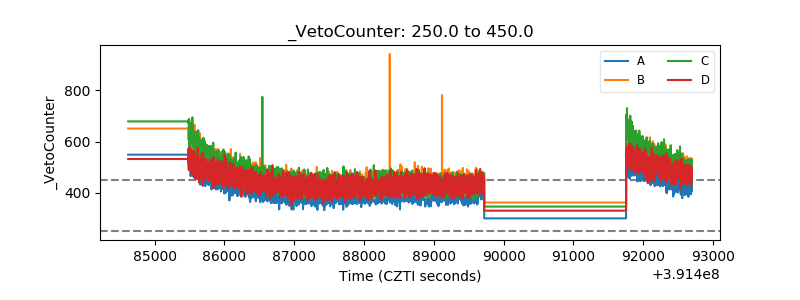 |