| Param | Original file | Final file |
|---|---|---|
| Filename | modeM0/AS1T04_069T01_9000005158_36042cztM0_level2.evt | modeM0/AS1T04_069T01_9000005158_36042cztM0_level2_quad_clean.evt |
| Size (bytes) | 444,908,160 | 57,787,200 |
| Size | 424.3 MB | 55.1 MB |
| Events in quadrant A | 2,592,908 | 361,091 |
| Events in quadrant B | 2,996,144 | 364,967 |
| Events in quadrant C | 4,180,581 | 332,403 |
| Events in quadrant D | 3,352,676 | 327,961 |
| Mode M0 | |||
|---|---|---|---|
| Quadrant | BADHDUFLAG | Total packets | Discarded packets |
| A | 0 | 10850 | 3 |
| B | 0 | 12152 | 2 |
| C | 0 | 15789 | 2 |
| D | 0 | 13476 | 2 |
| Mode M9 | |||
|---|---|---|---|
| Quadrant | BADHDUFLAG | Total packets | Discarded packets |
| A | 0 | 28 | 0 |
| B | 0 | 28 | 0 |
| C | 0 | 28 | 0 |
| D | 0 | 29 | 0 |
| Mode SS | |||
|---|---|---|---|
| Quadrant | BADHDUFLAG | Total packets | Discarded packets |
| A | 0 | 108 | 0 |
| B | 0 | 108 | 0 |
| C | 0 | 108 | 0 |
| D | 0 | 108 | 0 |
| Quadrant | Total seconds | Saturated seconds | Saturation percentage |
|---|---|---|---|
| A | 5172 | 8 | 0.154679% |
| B | 5172 | 90 | 1.740139% |
| C | 5172 | 440 | 8.507347% |
| D | 5172 | 260 | 5.027069% |
Noise dominated data is calculated using 1-second bins in cleaned event files. If a bin has >2000 counts, and if more than 50% of those come from <1% of pixels, then it is considered to be noise-dominated and hence unusable.
| Quadrant | # 1 sec bins | Bins with >0 counts | Bins with >2000 counts | High rate bins dominated by noise | Noise dominated (total time) | Noise dominated (detector-on time) | Marked lightcurve |
|---|---|---|---|---|---|---|---|
| A | 7115 | 5173 | 0 | 0 | 0.00% | 0.00% | 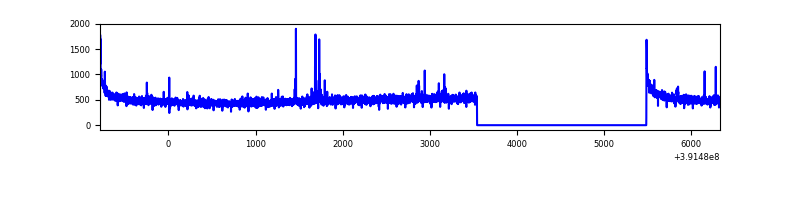 |
| B | 7115 | 5173 | 64 | 64 | 0.90% | 1.24% | 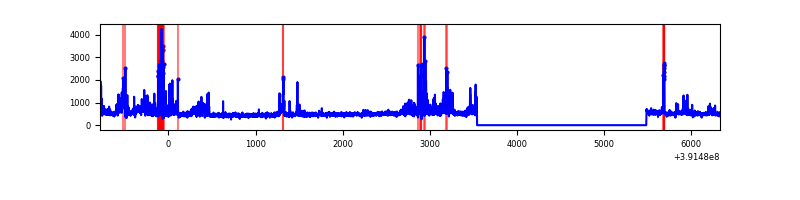 |
| C | 7115 | 5173 | 324 | 324 | 4.55% | 6.26% | 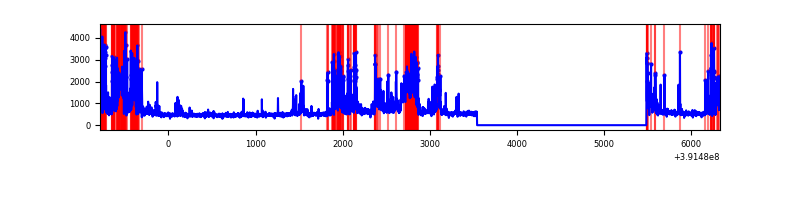 |
| D | 7115 | 5173 | 254 | 254 | 3.57% | 4.91% | 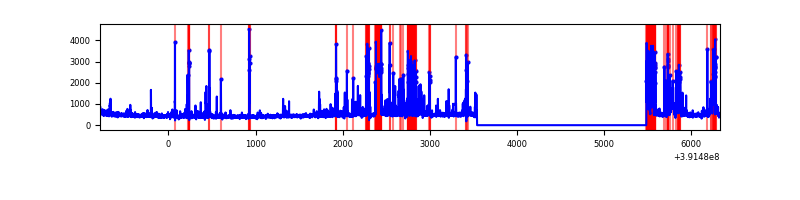 |
Top three noisy pixels from each quadrant. If the there are fewer than three noisy pixels in the level2.evt file, extra rows are filled as -1
| Pixel properties | Quadrant properties | ||||||
|---|---|---|---|---|---|---|---|
| Quadrant | DetID | PixID | Counts | Sigma | Mean | Median | Sigma |
| A | 10 | 83 | 160155 | 1279.2 | 616 | 604 | 124.7 |
| A | 0 | 31 | 43218 | 341.66 | 616 | 604 | 124.7 |
| A | 13 | 254 | 7496 | 55.26 | 616 | 604 | 124.7 |
| B | 5 | 236 | 209948 | 1789.2 | 615 | 599 | 117.0 |
| B | 0 | 213 | 121279 | 1031.39 | 615 | 599 | 117.0 |
| B | 0 | 190 | 114087 | 969.92 | 615 | 599 | 117.0 |
| C | 9 | 187 | 1468858 | 10833.73 | 580 | 584 | 135.5 |
| C | 15 | 214 | 209085 | 1538.43 | 580 | 584 | 135.5 |
| C | 0 | 10 | 160344 | 1178.79 | 580 | 584 | 135.5 |
| D | 12 | 6 | 489848 | 3417.07 | 582 | 566 | 143.2 |
| D | 1 | 52 | 369488 | 2576.5 | 582 | 566 | 143.2 |
| D | 13 | 249 | 58899 | 407.39 | 582 | 566 | 143.2 |
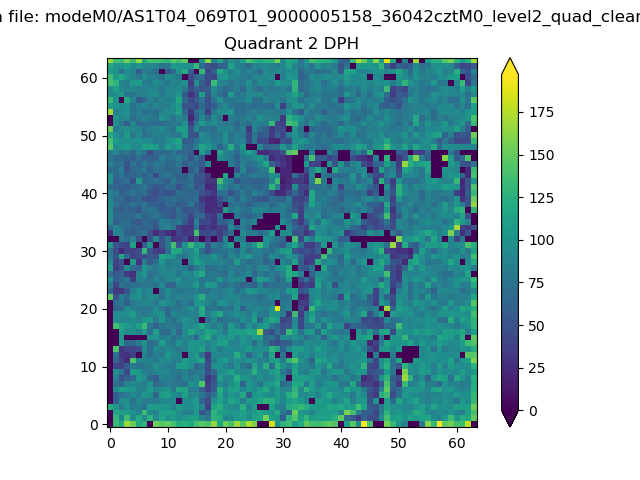
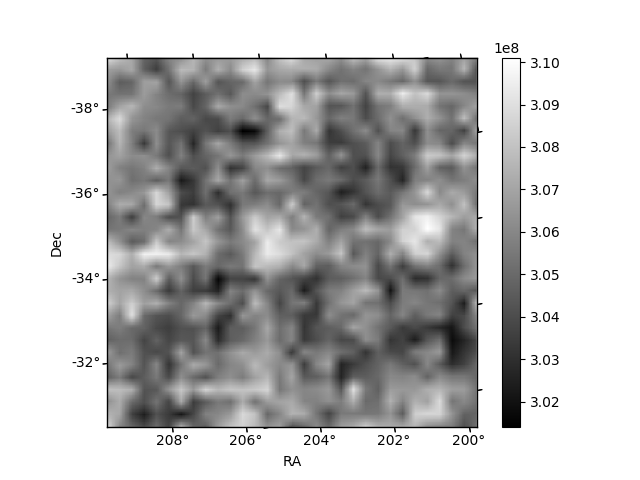
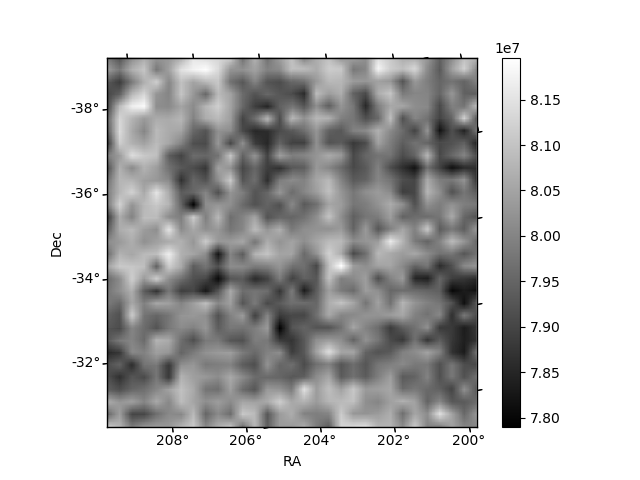
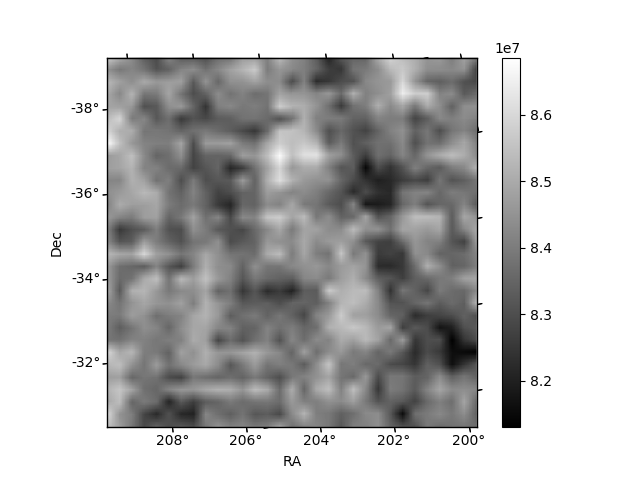
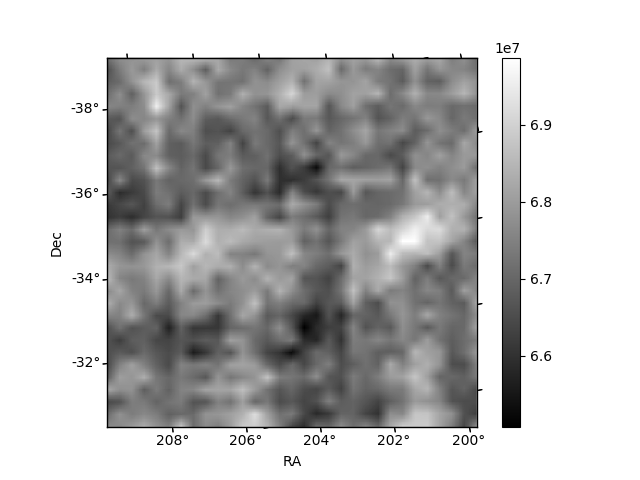
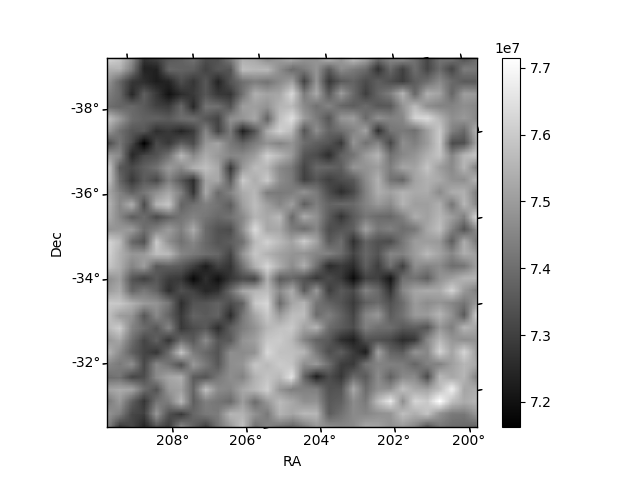
Histogram calculated using DETX and DETY for each event in the final _common_clean file
| Quadrant A | 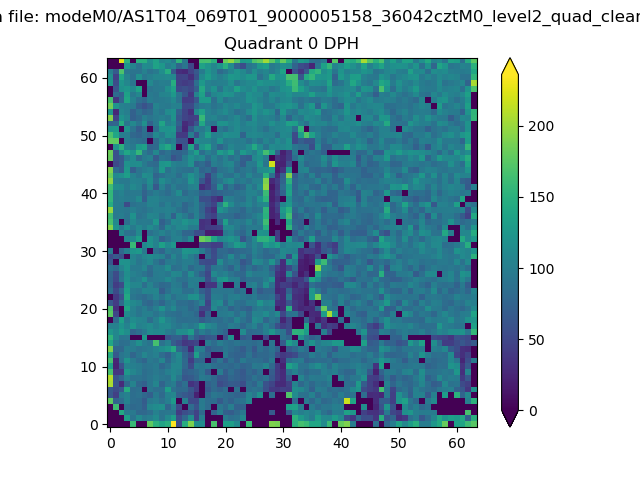 |
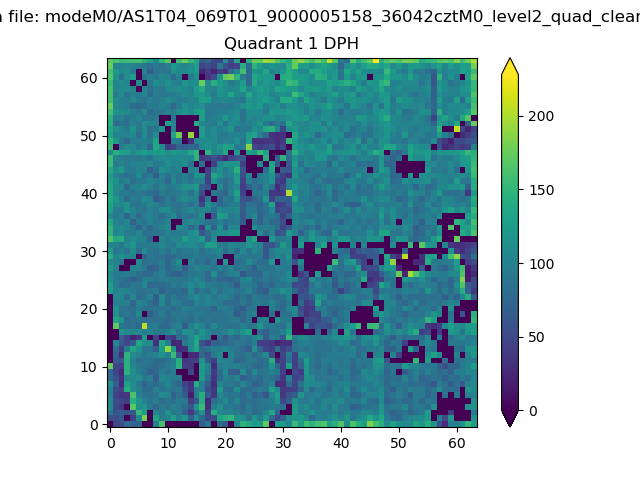 |
Quadrant B |
|---|---|---|---|
| Quadrant D | 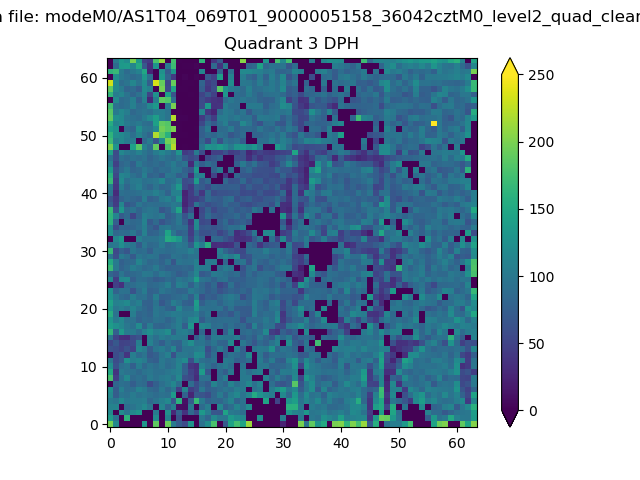 |
 |
Quadrant C |
| Plot type | Count rate plots | Images |
|---|---|---|
| Comparison with Poisson distribution Blue bars denote a histogram of data divided into 1 sec bins. Red curve is a Poisson curve with rate = median count rate of data. |
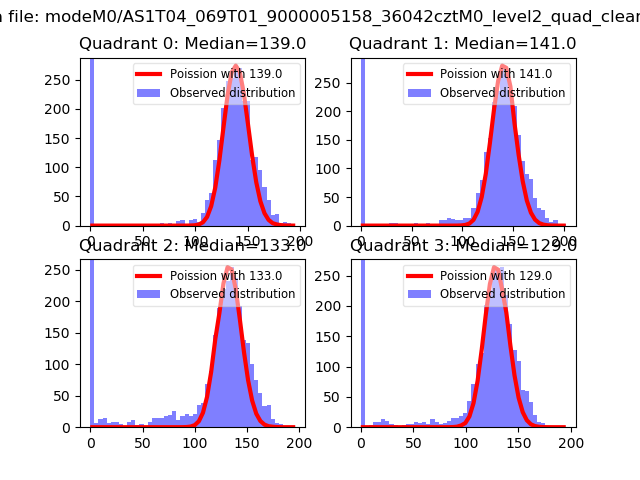 |
 |
| Quadrant-wise count rates Data is divided into 100 sec bins |
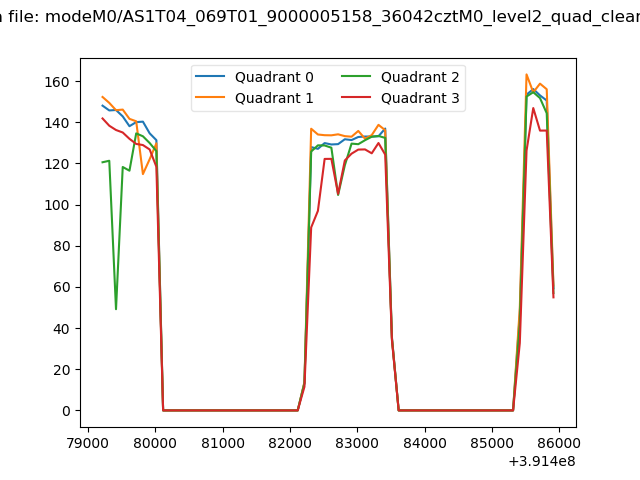 |
|
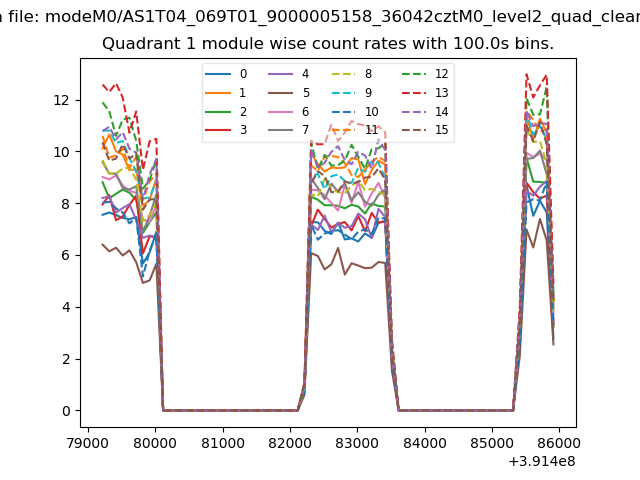
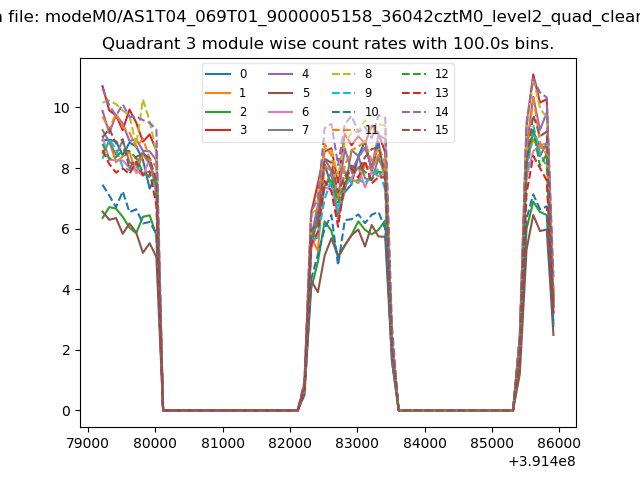
| Module-wise count rates for Quadrant A Data is divided into 100 sec bins |
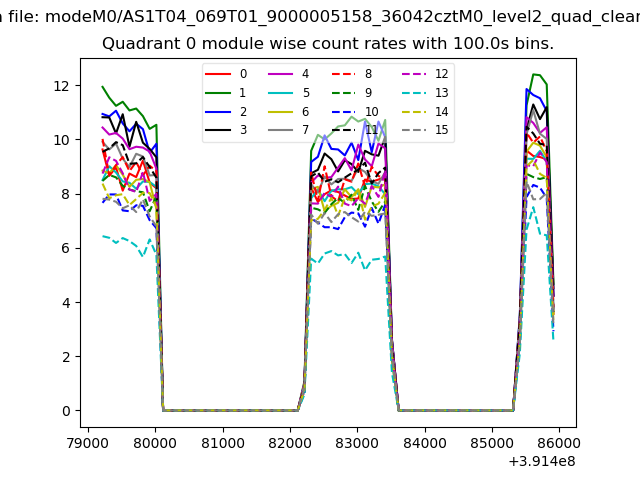 |
 |
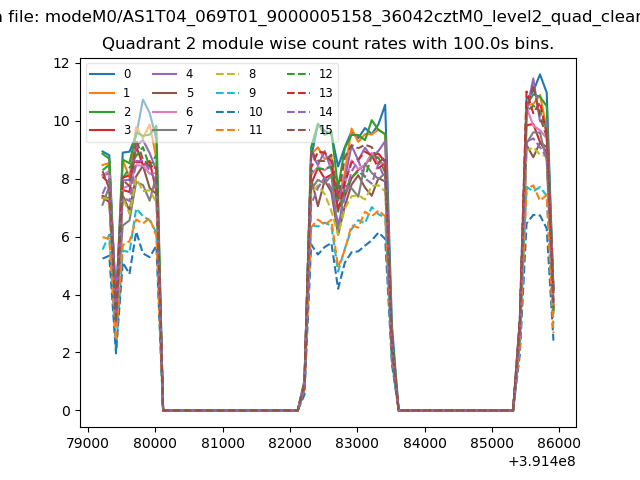
| Module-wise count rates for Quadrant B Data is divided into 100 sec bins |
 |
 |
| Module-wise count rates for Quadrant C Data is divided into 100 sec bins |
 |
 |
| Module-wise count rates for Quadrant D Data is divided into 100 sec bins |
 |
 |
| Parameter | Plot |
|---|---|
| CZT HV Monitor | 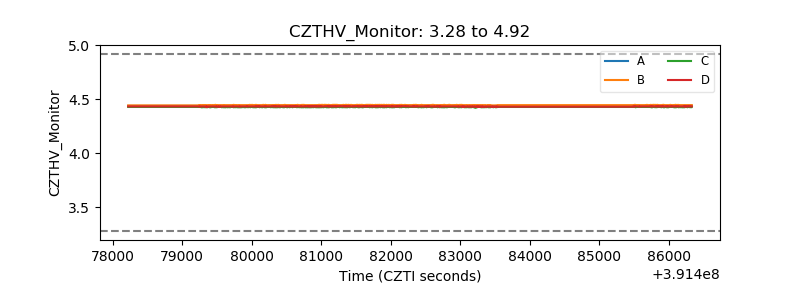 |
| D_VDD | 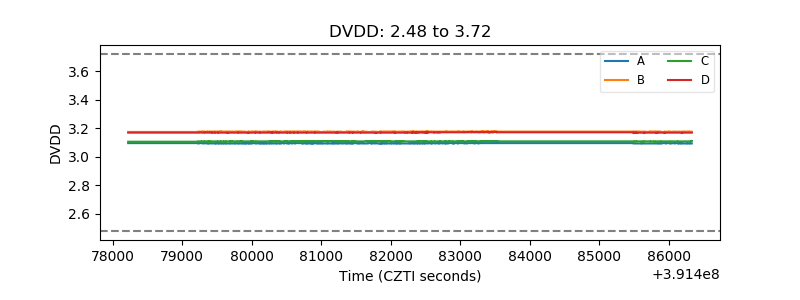 |
| Temperature 1 | 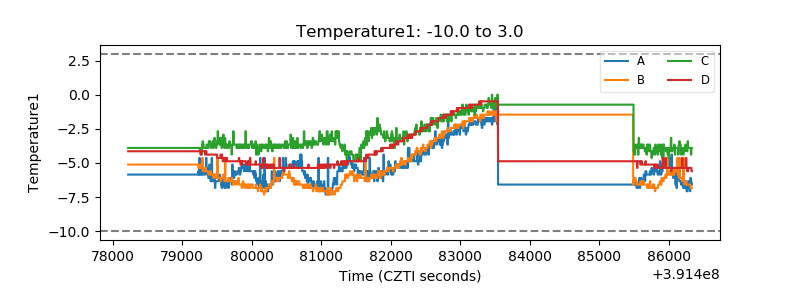 |
| Veto HV Monitor | 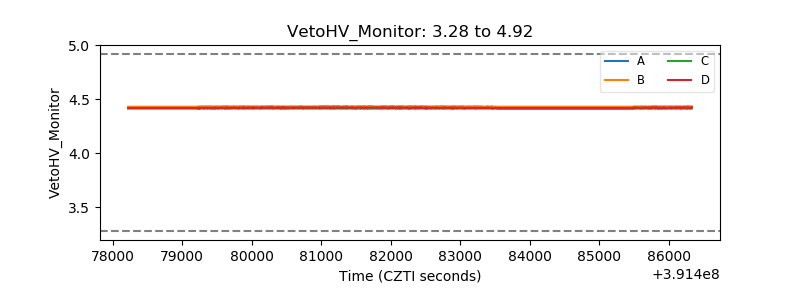 |
| Veto LLD | 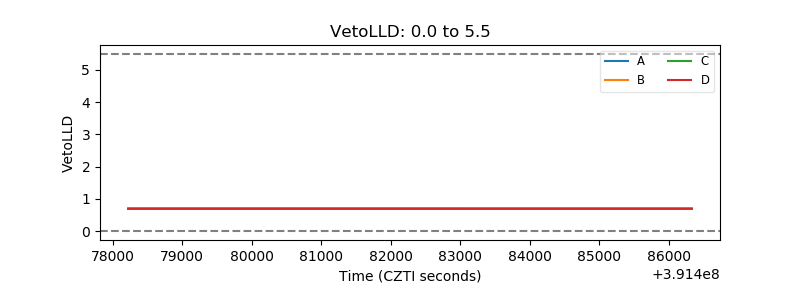 |
| Alpha Counter | 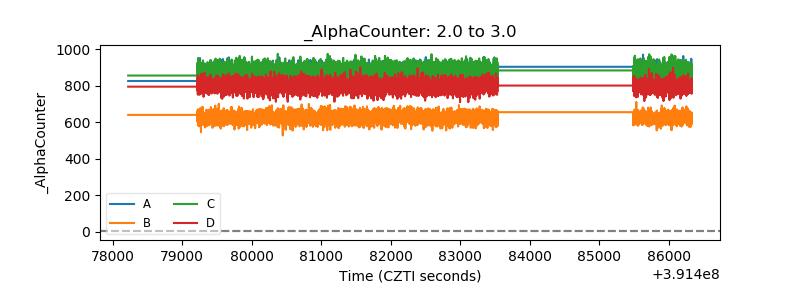 |
| _CPM_Rate | 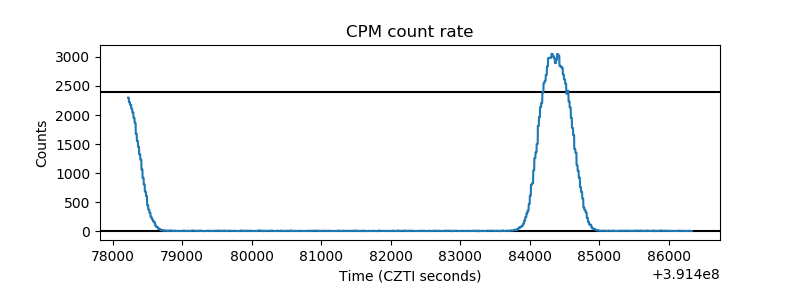 |
| CZT Counter | 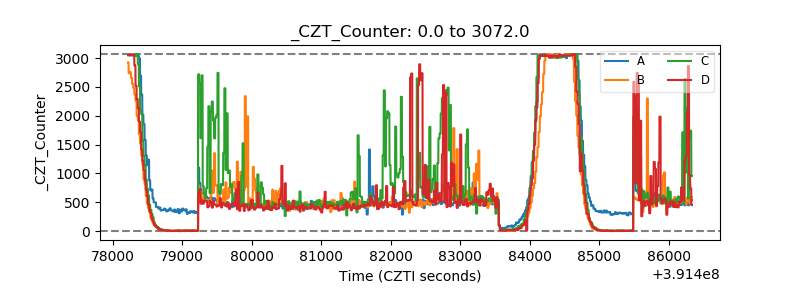 |
| +2.5 Volts monitor | 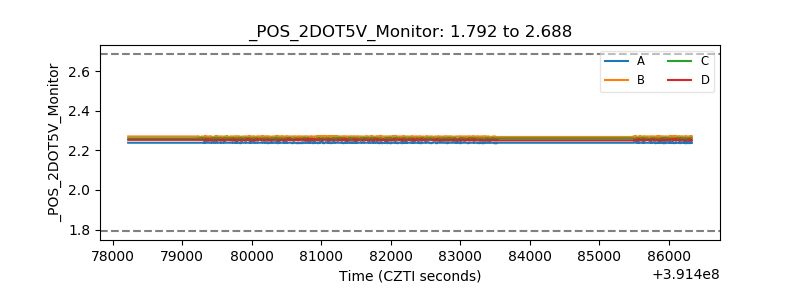 |
| +5 Volts monitor | 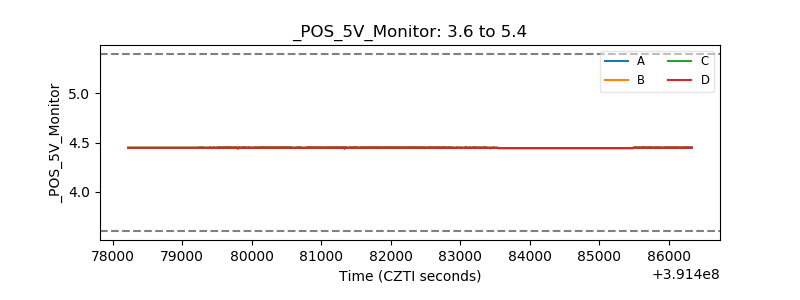 |
| _ROLL_ROT | 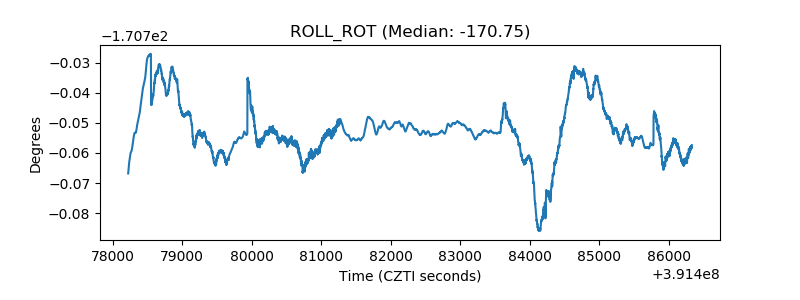 |
| _Roll_DEC | 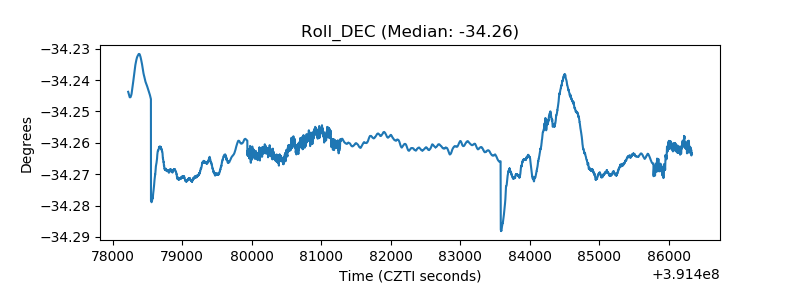 |
| _Roll_RA | 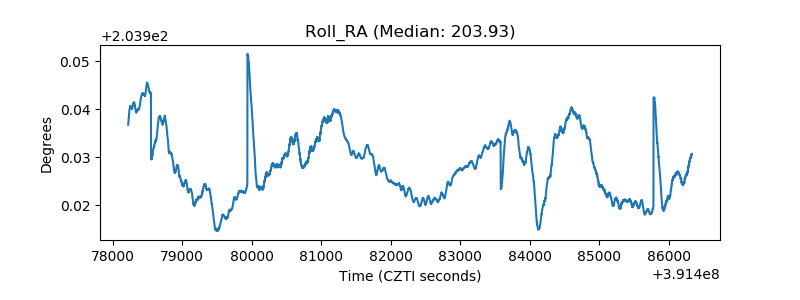 |
| Veto Counter | 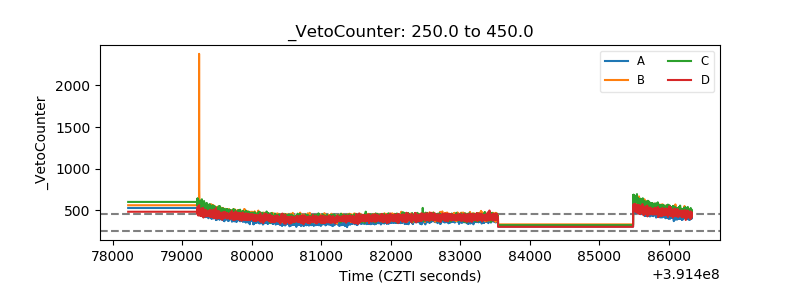 |