| Param | Original file | Final file |
|---|---|---|
| Filename | modeM0/AS1T04_069T01_9000005158_36038cztM0_level2.evt | modeM0/AS1T04_069T01_9000005158_36038cztM0_level2_quad_clean.evt |
| Size (bytes) | 908,962,560 | 97,862,400 |
| Size | 866.9 MB | 93.3 MB |
| Events in quadrant A | 4,424,181 | 617,350 |
| Events in quadrant B | 6,501,181 | 590,752 |
| Events in quadrant C | 10,086,829 | 530,865 |
| Events in quadrant D | 5,880,483 | 571,894 |
| Mode M0 | |||
|---|---|---|---|
| Quadrant | BADHDUFLAG | Total packets | Discarded packets |
| A | 0 | 19450 | 3 |
| B | 0 | 25406 | 2 |
| C | 0 | 36220 | 2 |
| D | 0 | 24041 | 2 |
| Mode M9 | |||
|---|---|---|---|
| Quadrant | BADHDUFLAG | Total packets | Discarded packets |
| A | 0 | 29 | 0 |
| B | 0 | 29 | 0 |
| C | 0 | 29 | 0 |
| D | 0 | 29 | 0 |
| Mode SS | |||
|---|---|---|---|
| Quadrant | BADHDUFLAG | Total packets | Discarded packets |
| A | 0 | 192 | 0 |
| B | 0 | 192 | 0 |
| C | 0 | 192 | 0 |
| D | 0 | 192 | 0 |
| Quadrant | Total seconds | Saturated seconds | Saturation percentage |
|---|---|---|---|
| A | 9402 | 40 | 0.425441% |
| B | 9402 | 468 | 4.977664% |
| C | 9402 | 2296 | 24.420336% |
| D | 9402 | 290 | 3.084450% |
Noise dominated data is calculated using 1-second bins in cleaned event files. If a bin has >2000 counts, and if more than 50% of those come from <1% of pixels, then it is considered to be noise-dominated and hence unusable.
| Quadrant | # 1 sec bins | Bins with >0 counts | Bins with >2000 counts | High rate bins dominated by noise | Noise dominated (total time) | Noise dominated (detector-on time) | Marked lightcurve |
|---|---|---|---|---|---|---|---|
| A | 12357 | 9404 | 22 | 22 | 0.18% | 0.23% | 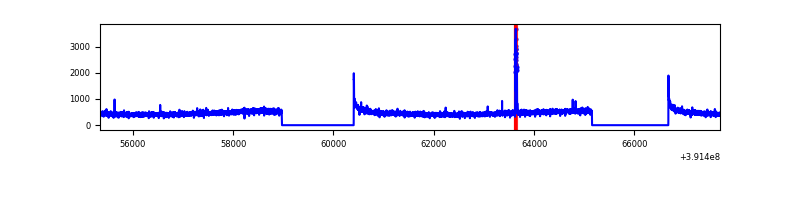 |
| B | 12357 | 9404 | 300 | 300 | 2.43% | 3.19% | 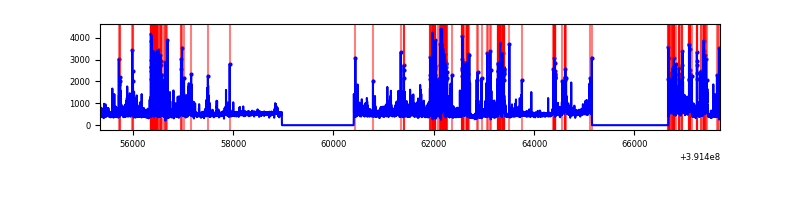 |
| C | 12357 | 9404 | 2015 | 2015 | 16.31% | 21.43% | 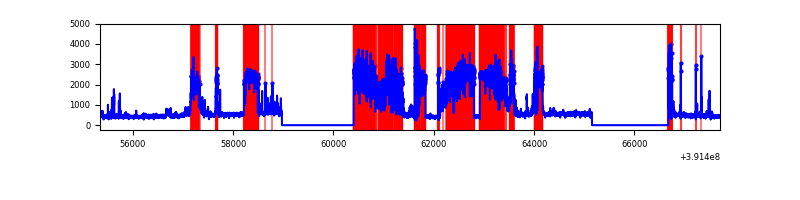 |
| D | 12357 | 9404 | 301 | 301 | 2.44% | 3.20% | 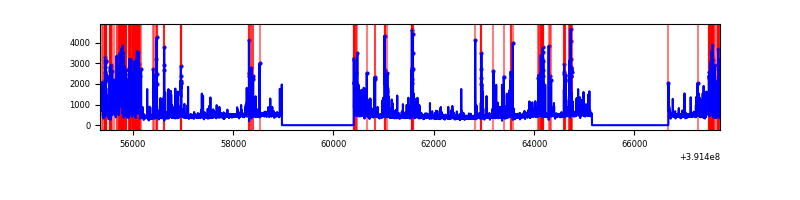 |
Top three noisy pixels from each quadrant. If the there are fewer than three noisy pixels in the level2.evt file, extra rows are filled as -1
| Pixel properties | Quadrant properties | ||||||
|---|---|---|---|---|---|---|---|
| Quadrant | DetID | PixID | Counts | Sigma | Mean | Median | Sigma |
| A | 10 | 83 | 238178 | 1098.51 | 1063 | 1041 | 215.9 |
| A | 10 | 248 | 64648 | 294.65 | 1063 | 1041 | 215.9 |
| A | 13 | 254 | 14654 | 63.06 | 1063 | 1041 | 215.9 |
| B | 5 | 236 | 1359715 | 6793.91 | 1040 | 1013 | 200.0 |
| B | 0 | 190 | 516424 | 2577.2 | 1040 | 1013 | 200.0 |
| B | 0 | 213 | 346515 | 1727.61 | 1040 | 1013 | 200.0 |
| C | 9 | 187 | 6009734 | 28252.62 | 909 | 914 | 212.7 |
| C | 15 | 214 | 340931 | 1598.71 | 909 | 914 | 212.7 |
| C | 0 | 10 | 113044 | 527.22 | 909 | 914 | 212.7 |
| D | 1 | 52 | 544013 | 2183.54 | 1019 | 992 | 248.7 |
| D | 12 | 6 | 315631 | 1265.19 | 1019 | 992 | 248.7 |
| D | 8 | 230 | 242602 | 971.54 | 1019 | 992 | 248.7 |
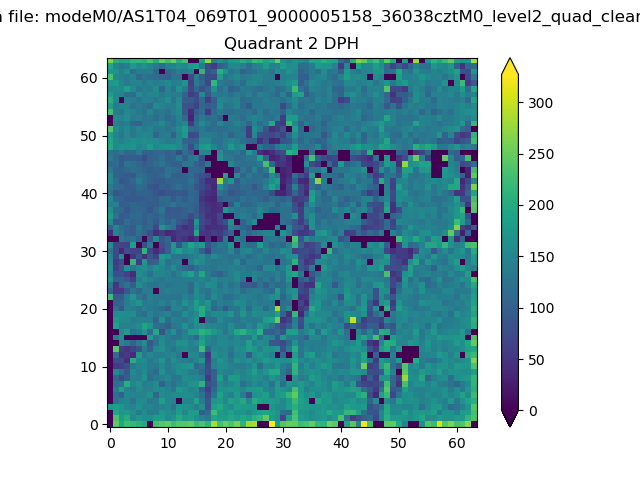
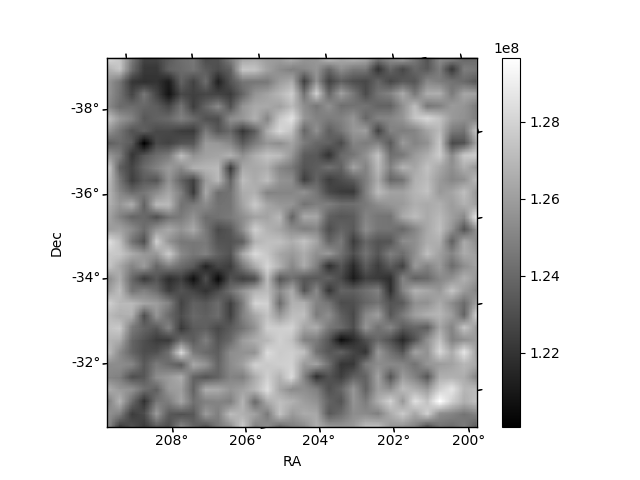
Histogram calculated using DETX and DETY for each event in the final _common_clean file
| Quadrant A | 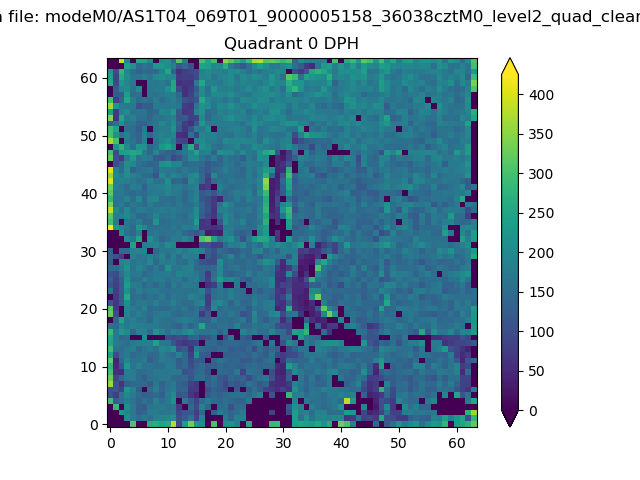 |
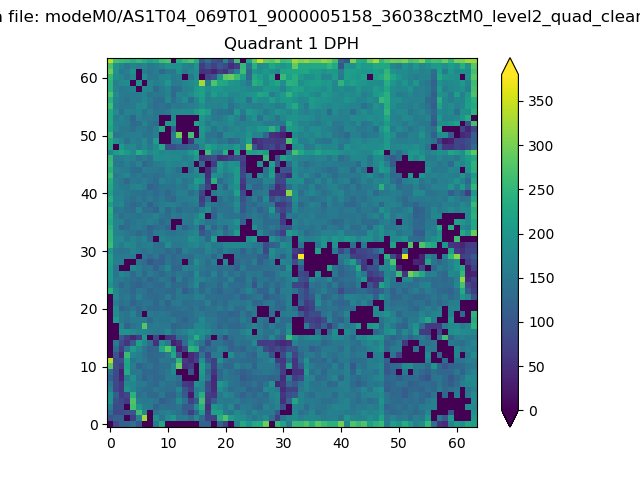 |
Quadrant B |
|---|---|---|---|
| Quadrant D | 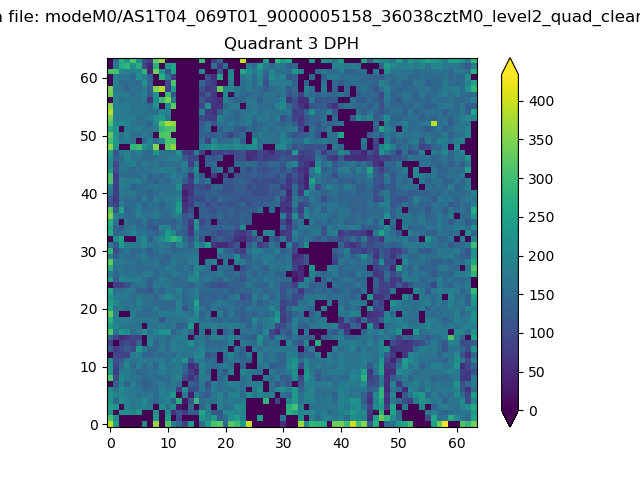 |
 |
Quadrant C |
| Plot type | Count rate plots | Images |
|---|---|---|
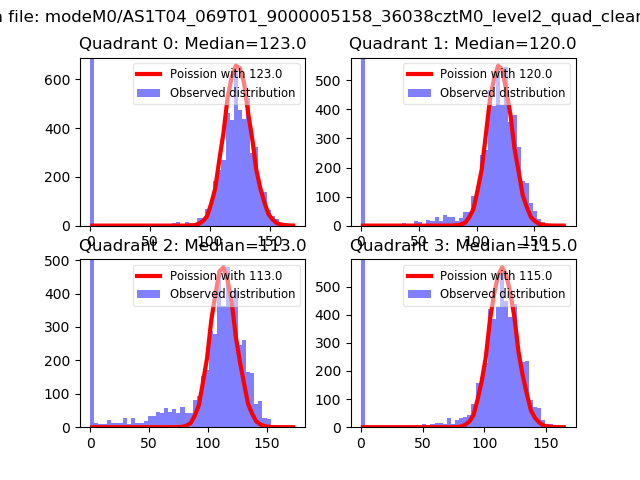
| Comparison with Poisson distribution Blue bars denote a histogram of data divided into 1 sec bins. Red curve is a Poisson curve with rate = median count rate of data. |
 |
 |
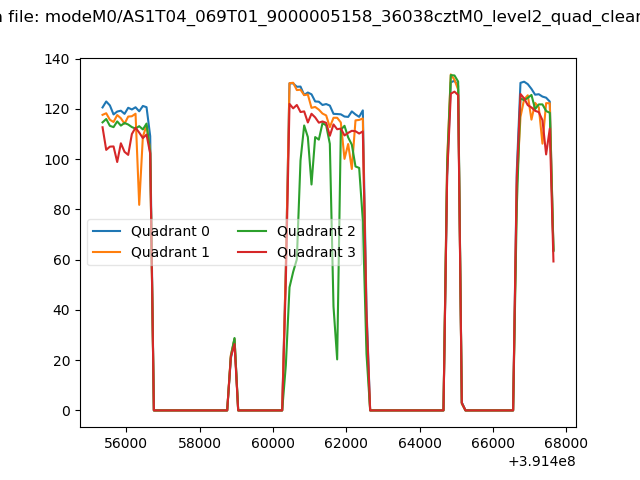
| Quadrant-wise count rates Data is divided into 100 sec bins |
 |
|
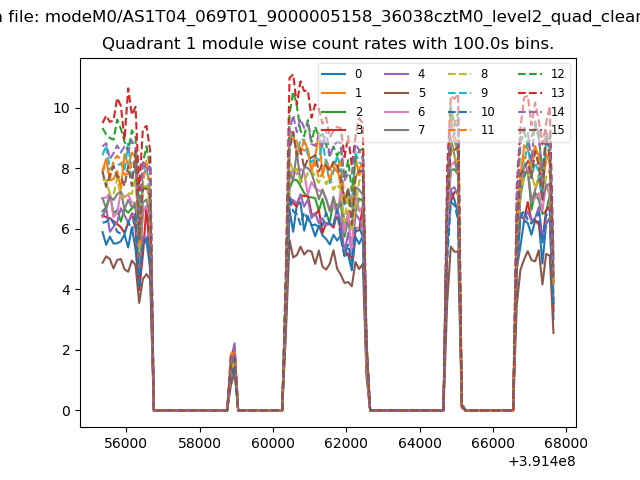
| Module-wise count rates for Quadrant A Data is divided into 100 sec bins |
 |
 |
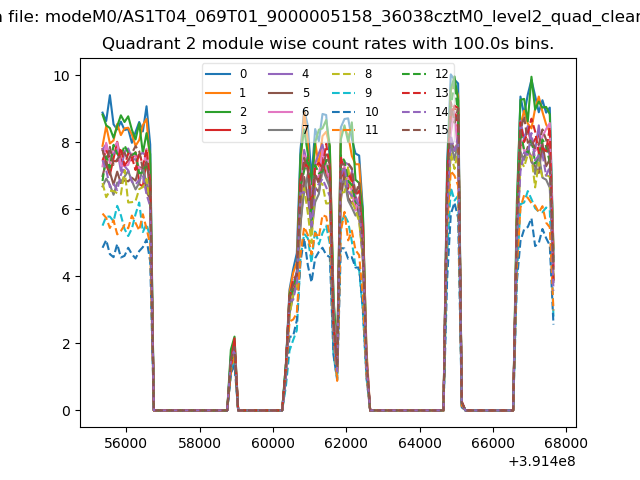
| Module-wise count rates for Quadrant B Data is divided into 100 sec bins |
 |
 |
| Module-wise count rates for Quadrant C Data is divided into 100 sec bins |
 |
 |
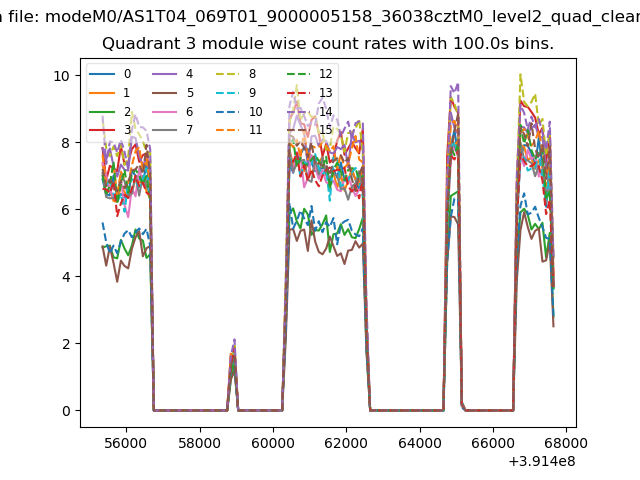
| Module-wise count rates for Quadrant D Data is divided into 100 sec bins |
 |
 |
| Parameter | Plot |
|---|---|
| CZT HV Monitor | 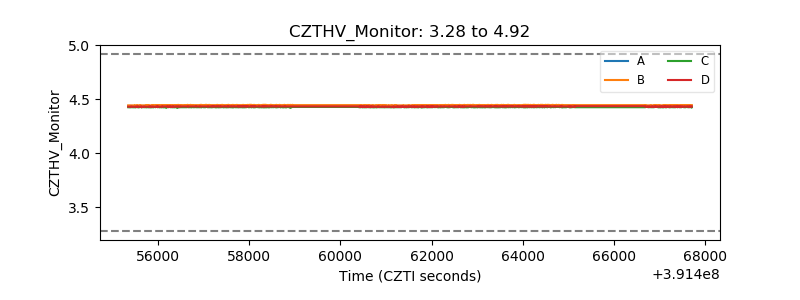 |
| D_VDD | 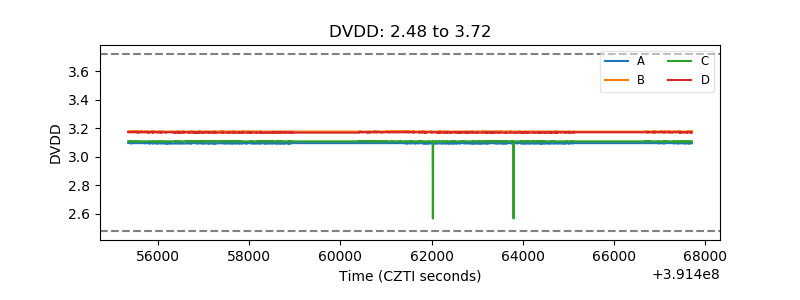 |
| Temperature 1 | 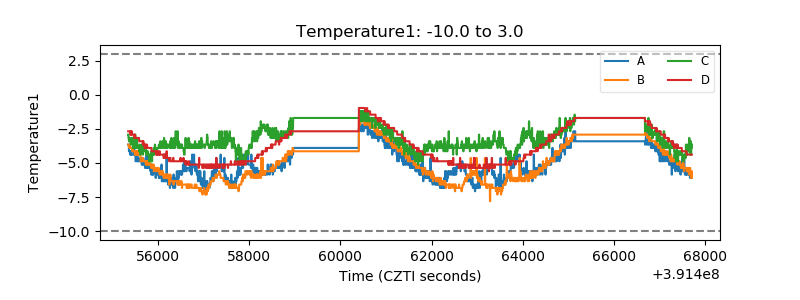 |
| Veto HV Monitor | 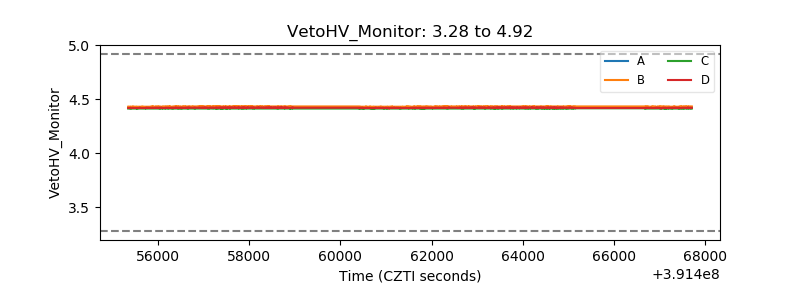 |
| Veto LLD | 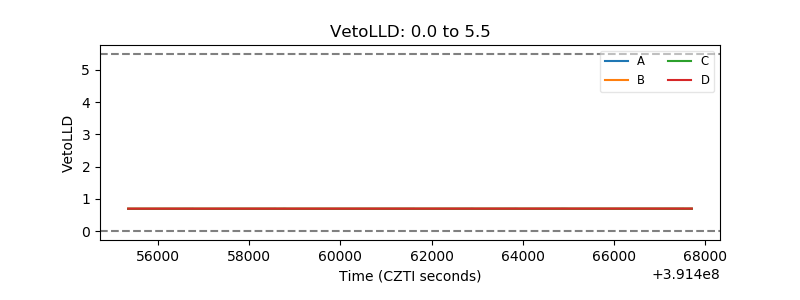 |
| Alpha Counter | 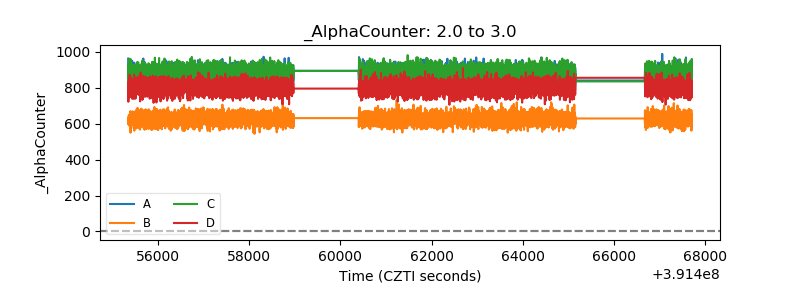 |
| _CPM_Rate | 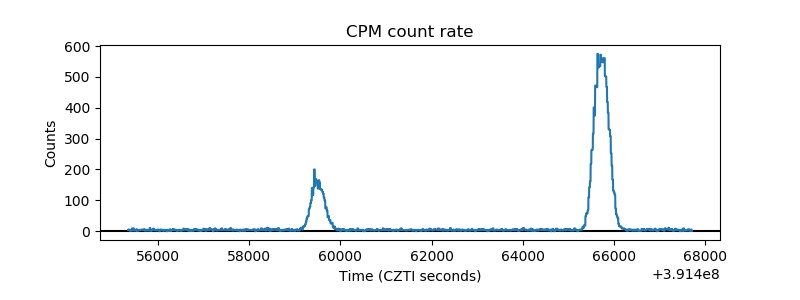 |
| CZT Counter | 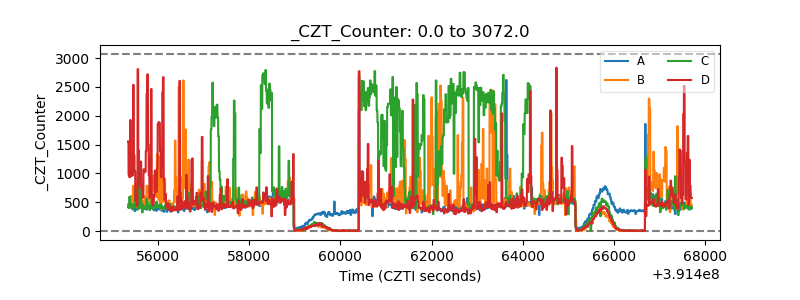 |
| +2.5 Volts monitor | 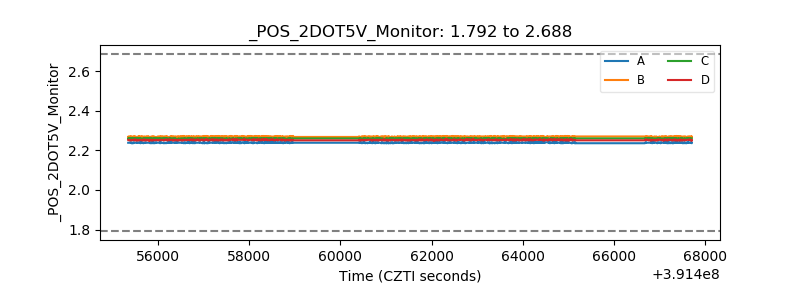 |
| +5 Volts monitor | 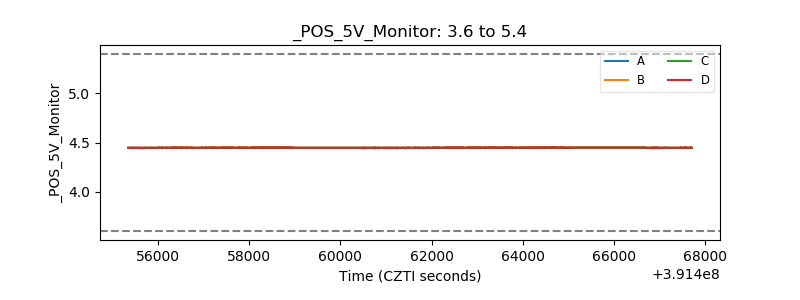 |
| _ROLL_ROT | 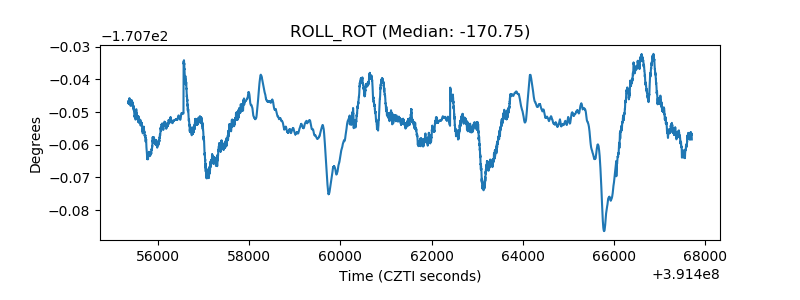 |
| _Roll_DEC | 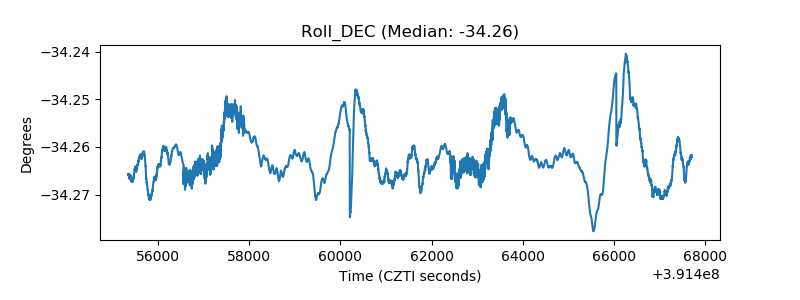 |
| _Roll_RA | 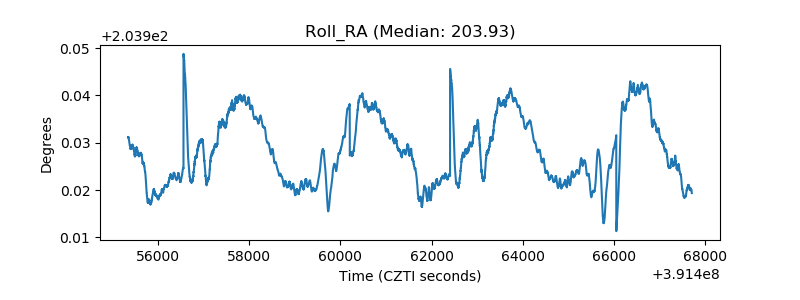 |
| Veto Counter | 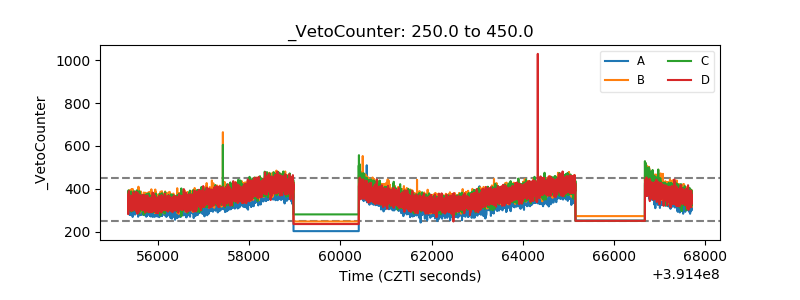 |