| Param | Original file | Final file |
|---|---|---|
| Filename | modeM0/AS1T04_069T01_9000005158_36037cztM0_level2.evt | modeM0/AS1T04_069T01_9000005158_36037cztM0_level2_quad_clean.evt |
| Size (bytes) | 580,973,760 | 82,077,120 |
| Size | 554.1 MB | 78.3 MB |
| Events in quadrant A | 2,972,080 | 536,980 |
| Events in quadrant B | 4,769,779 | 515,543 |
| Events in quadrant C | 5,587,901 | 498,542 |
| Events in quadrant D | 3,840,487 | 496,823 |
| Mode M0 | |||
|---|---|---|---|
| Quadrant | BADHDUFLAG | Total packets | Discarded packets |
| A | 0 | 12912 | 3 |
| B | 0 | 18366 | 2 |
| C | 0 | 20744 | 2 |
| D | 0 | 15669 | 2 |
| Mode M9 | |||
|---|---|---|---|
| Quadrant | BADHDUFLAG | Total packets | Discarded packets |
| A | 0 | 13 | 0 |
| B | 0 | 13 | 0 |
| C | 0 | 13 | 0 |
| D | 0 | 14 | 0 |
| Mode SS | |||
|---|---|---|---|
| Quadrant | BADHDUFLAG | Total packets | Discarded packets |
| A | 0 | 128 | 0 |
| B | 0 | 128 | 0 |
| C | 0 | 128 | 0 |
| D | 0 | 128 | 0 |
| Quadrant | Total seconds | Saturated seconds | Saturation percentage |
|---|---|---|---|
| A | 6263 | 10 | 0.159668% |
| B | 6263 | 564 | 9.005269% |
| C | 6263 | 699 | 11.160786% |
| D | 6263 | 151 | 2.410985% |
Noise dominated data is calculated using 1-second bins in cleaned event files. If a bin has >2000 counts, and if more than 50% of those come from <1% of pixels, then it is considered to be noise-dominated and hence unusable.
| Quadrant | # 1 sec bins | Bins with >0 counts | Bins with >2000 counts | High rate bins dominated by noise | Noise dominated (total time) | Noise dominated (detector-on time) | Marked lightcurve |
|---|---|---|---|---|---|---|---|
| A | 7576 | 6264 | 0 | 0 | 0.00% | 0.00% | 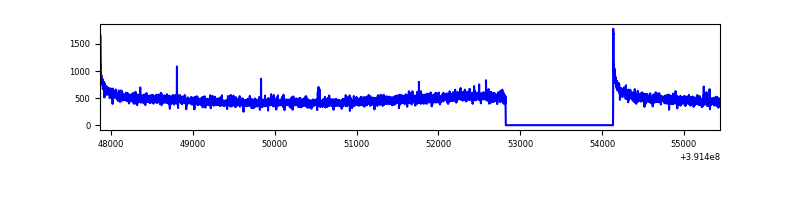 |
| B | 7576 | 6264 | 362 | 362 | 4.78% | 5.78% | 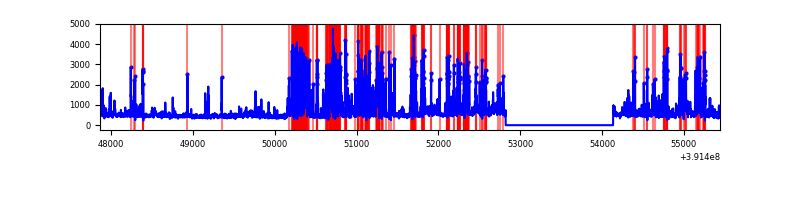 |
| C | 7576 | 6264 | 579 | 579 | 7.64% | 9.24% | 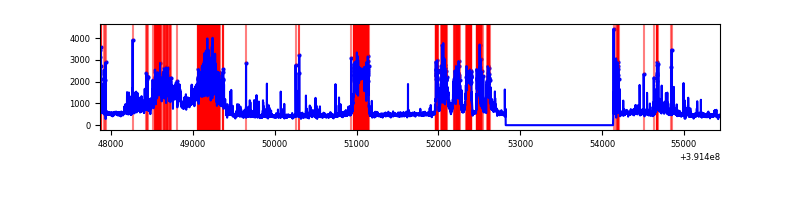 |
| D | 7576 | 6264 | 119 | 119 | 1.57% | 1.90% | 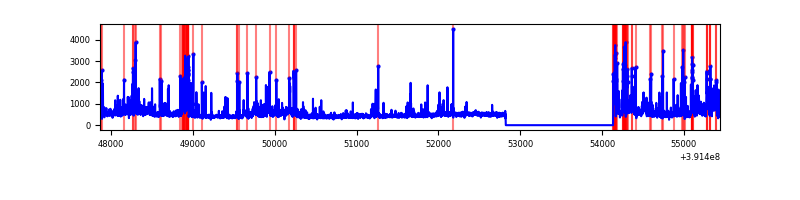 |
Top three noisy pixels from each quadrant. If the there are fewer than three noisy pixels in the level2.evt file, extra rows are filled as -1
| Pixel properties | Quadrant properties | ||||||
|---|---|---|---|---|---|---|---|
| Quadrant | DetID | PixID | Counts | Sigma | Mean | Median | Sigma |
| A | 10 | 83 | 194081 | 1321.22 | 718 | 705 | 146.4 |
| A | 13 | 254 | 9001 | 56.68 | 718 | 705 | 146.4 |
| A | 3 | 137 | 7472 | 46.23 | 718 | 705 | 146.4 |
| B | 5 | 236 | 1640641 | 12432.04 | 681 | 661 | 131.9 |
| B | 0 | 190 | 220073 | 1663.27 | 681 | 661 | 131.9 |
| B | 0 | 213 | 87571 | 658.83 | 681 | 661 | 131.9 |
| C | 9 | 187 | 2507359 | 16271.64 | 654 | 659 | 154.1 |
| C | 15 | 214 | 249577 | 1615.79 | 654 | 659 | 154.1 |
| C | 0 | 207 | 160781 | 1039.39 | 654 | 659 | 154.1 |
| D | 8 | 230 | 315460 | 1863.54 | 684 | 664 | 168.9 |
| D | 10 | 118 | 309246 | 1826.76 | 684 | 664 | 168.9 |
| D | 12 | 227 | 104312 | 613.58 | 684 | 664 | 168.9 |
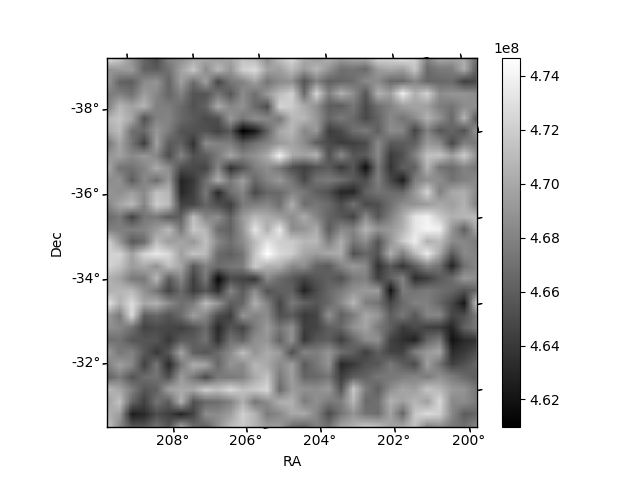
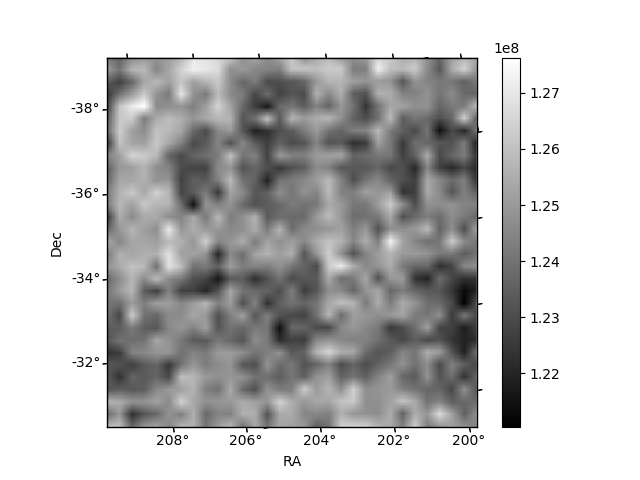
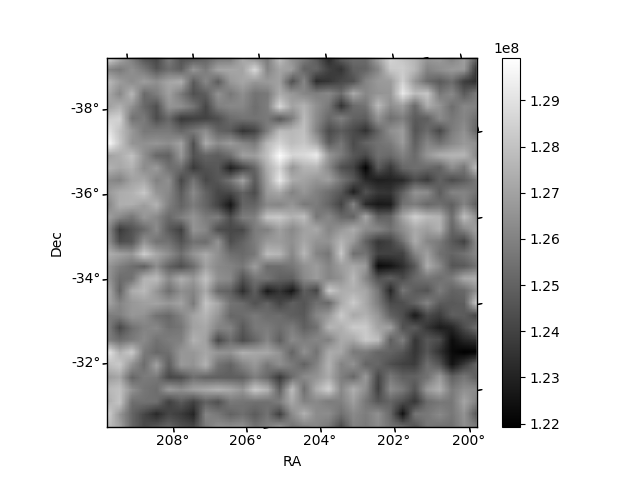
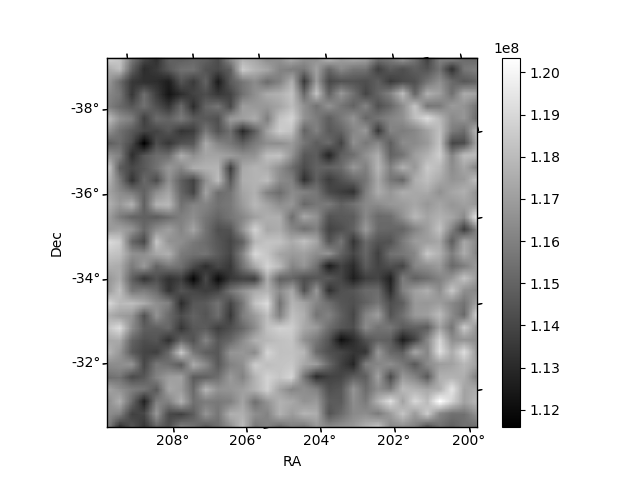
Histogram calculated using DETX and DETY for each event in the final _common_clean file
| Quadrant A | 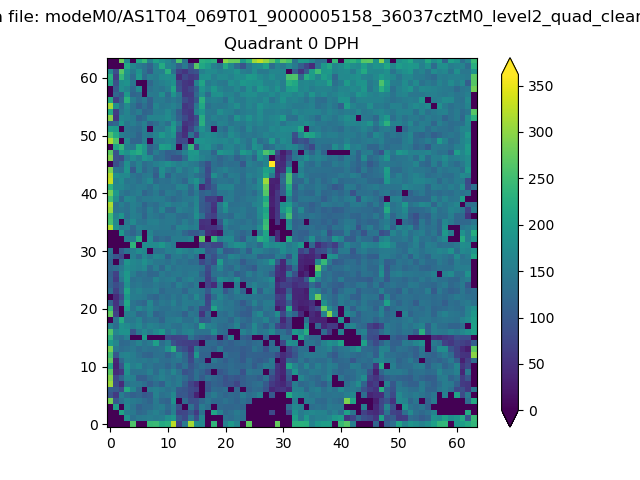 |
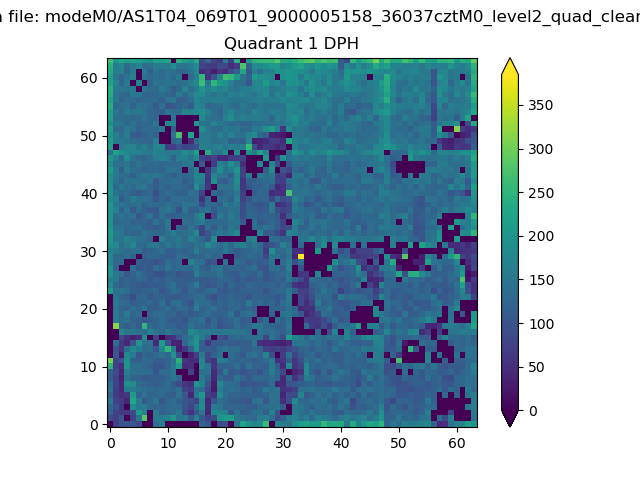 |
Quadrant B |
|---|---|---|---|
| Quadrant D | 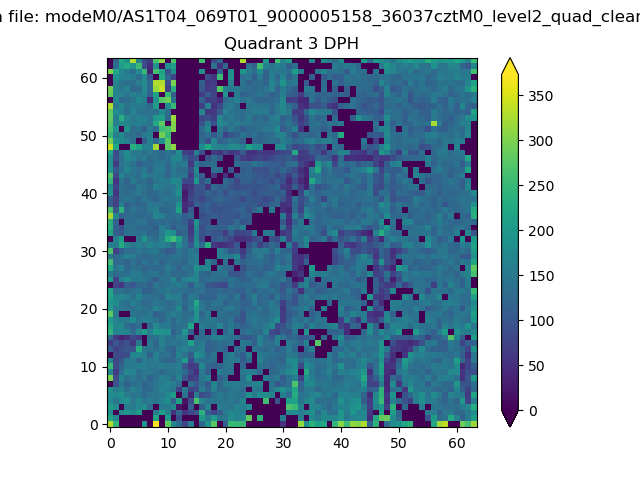 |
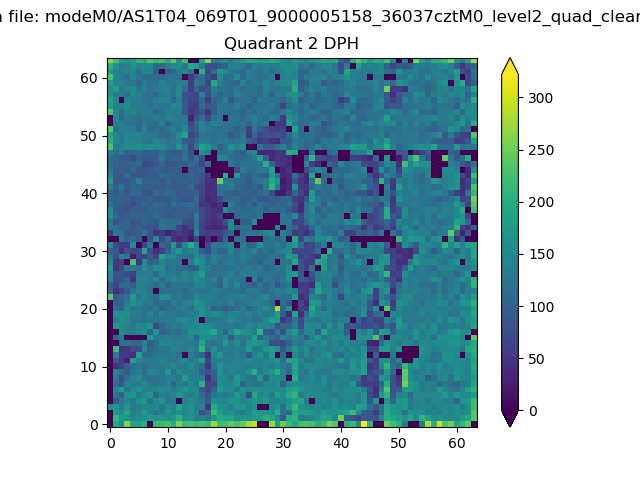 |
Quadrant C |
| Plot type | Count rate plots | Images |
|---|---|---|
| Comparison with Poisson distribution Blue bars denote a histogram of data divided into 1 sec bins. Red curve is a Poisson curve with rate = median count rate of data. |
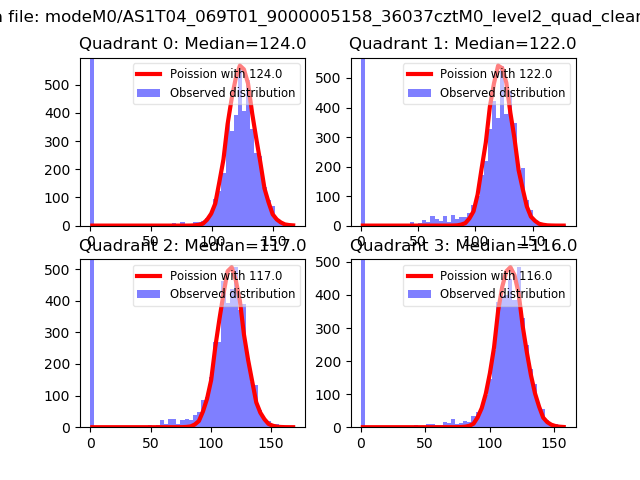 |
 |
| Quadrant-wise count rates Data is divided into 100 sec bins |
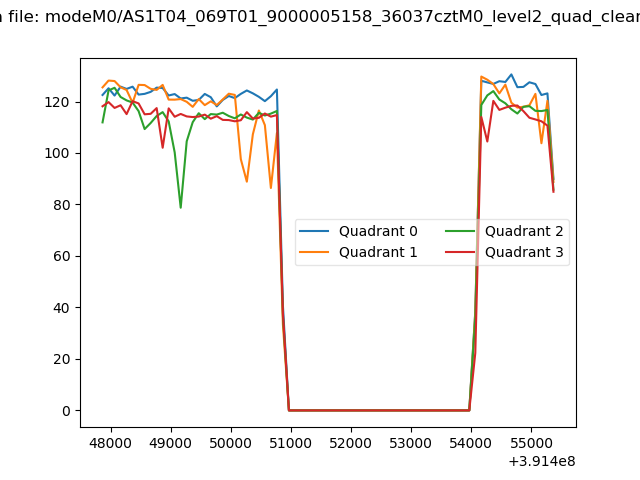 |
|
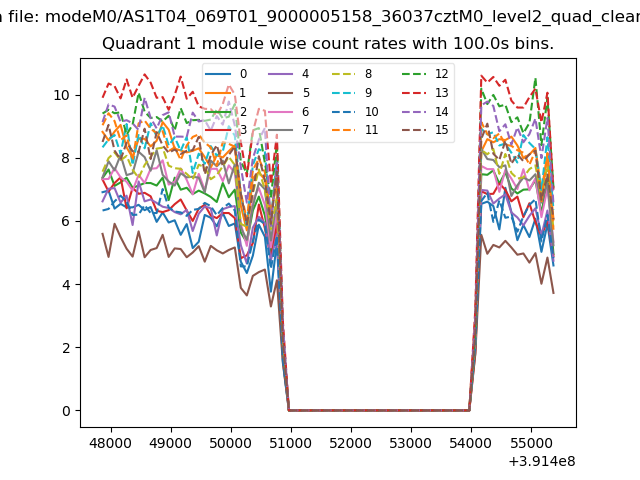
| Module-wise count rates for Quadrant A Data is divided into 100 sec bins |
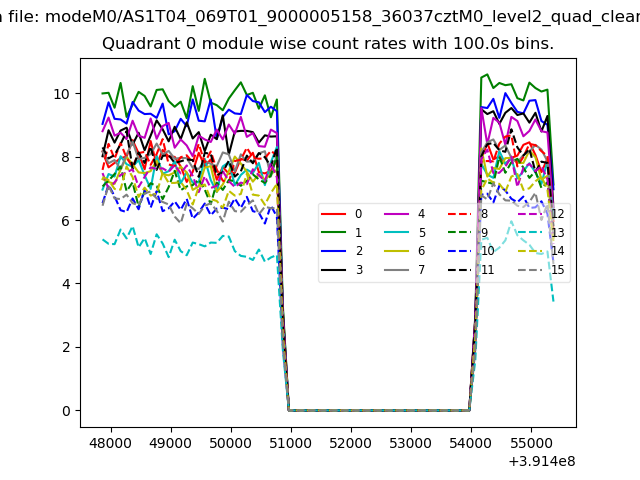 |
 |
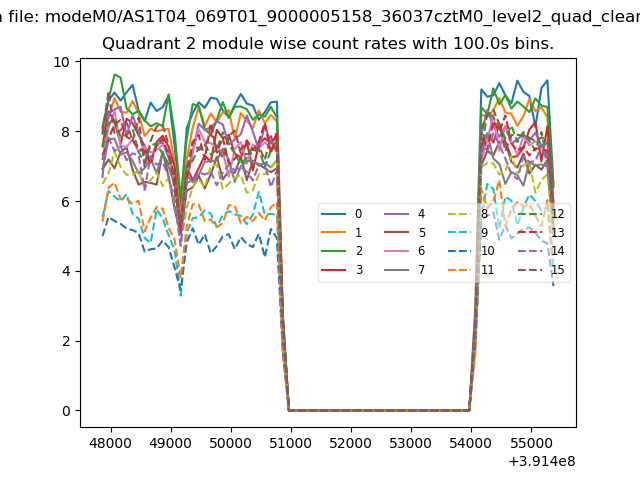
| Module-wise count rates for Quadrant B Data is divided into 100 sec bins |
 |
 |
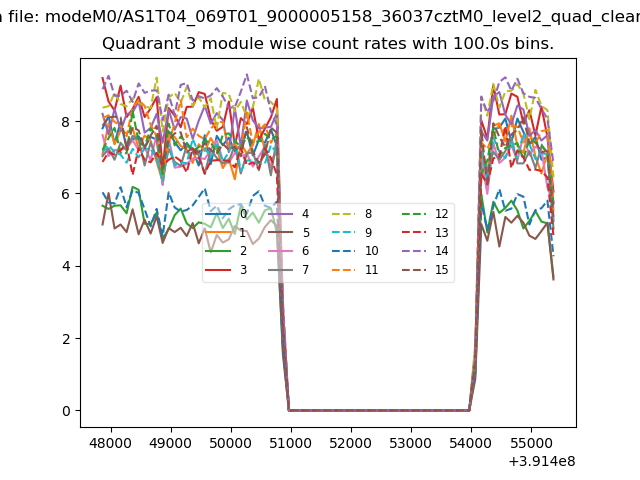
| Module-wise count rates for Quadrant C Data is divided into 100 sec bins |
 |
 |
| Module-wise count rates for Quadrant D Data is divided into 100 sec bins |
 |
 |
| Parameter | Plot |
|---|---|
| CZT HV Monitor | 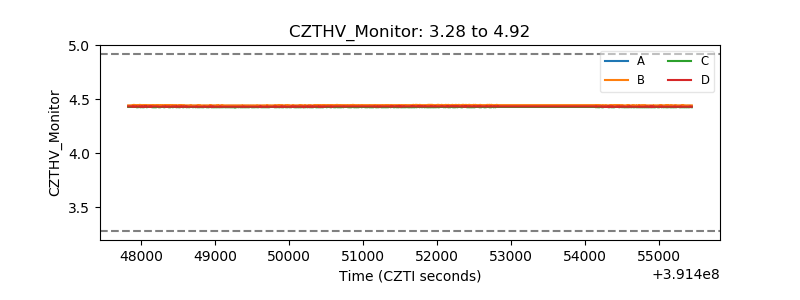 |
| D_VDD | 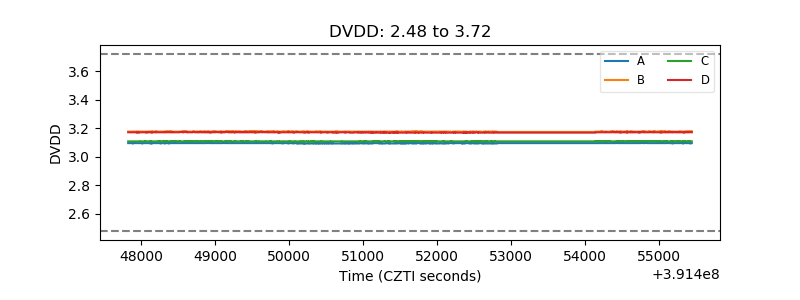 |
| Temperature 1 | 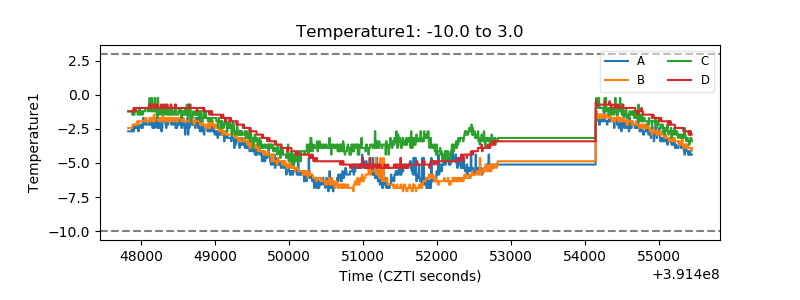 |
| Veto HV Monitor | 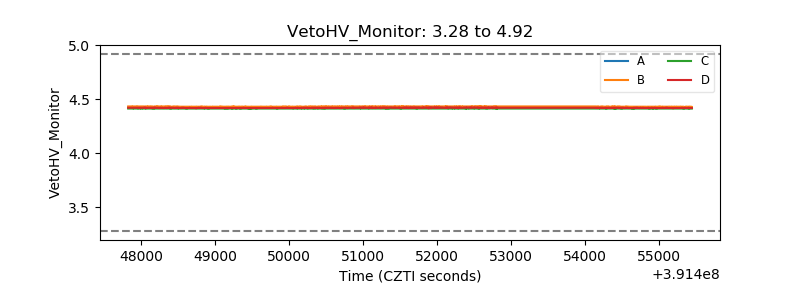 |
| Veto LLD |  |
| Alpha Counter | 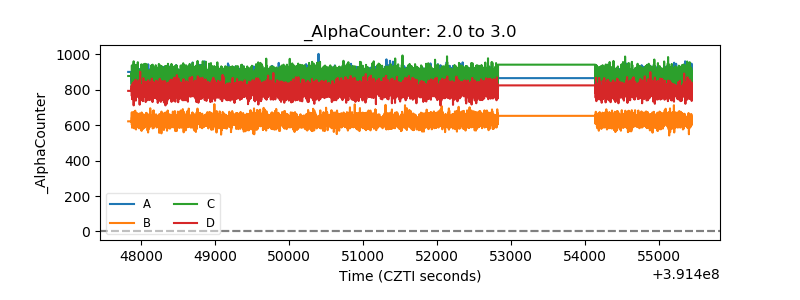 |
| _CPM_Rate | 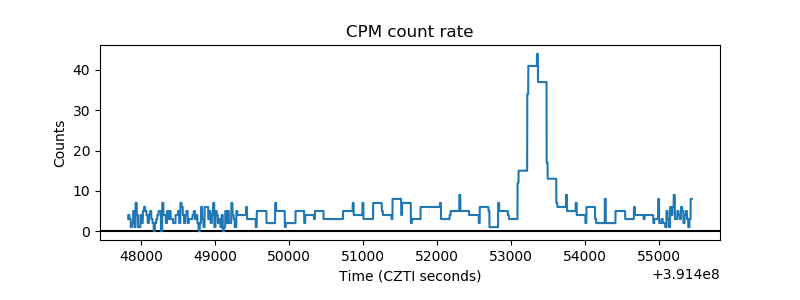 |
| CZT Counter | 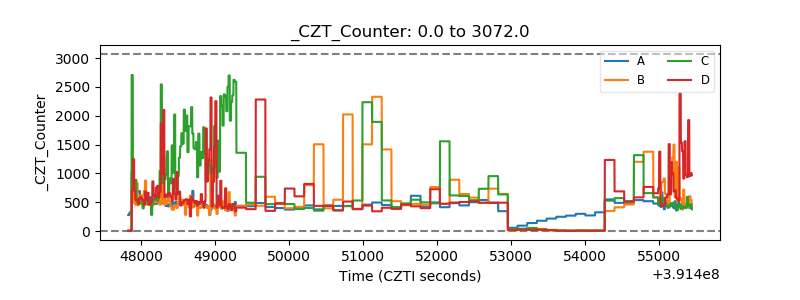 |
| +2.5 Volts monitor | 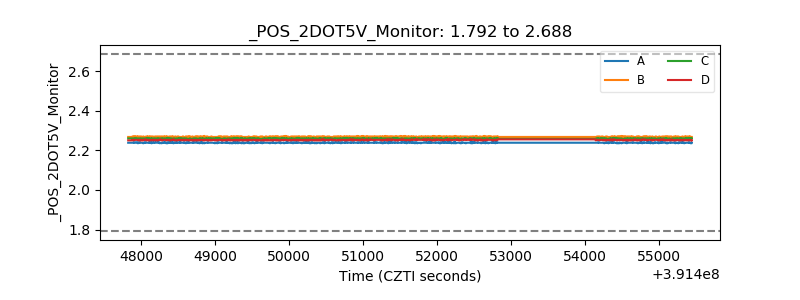 |
| +5 Volts monitor | 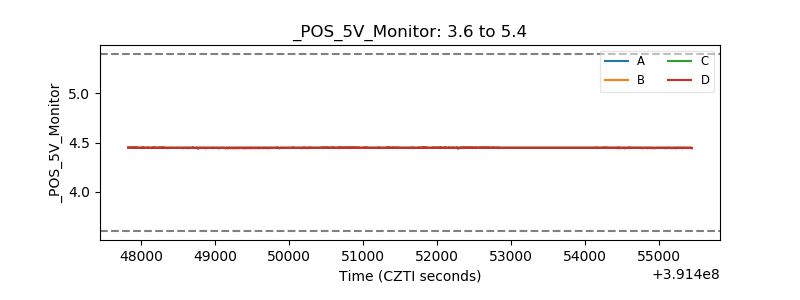 |
| _ROLL_ROT | 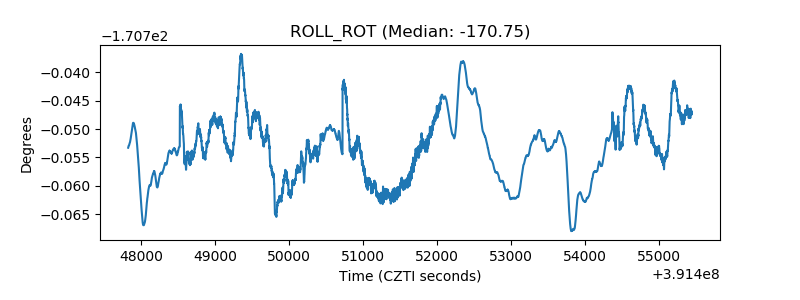 |
| _Roll_DEC | 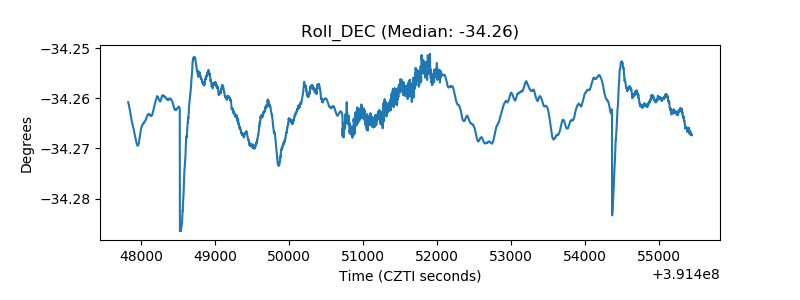 |
| _Roll_RA | 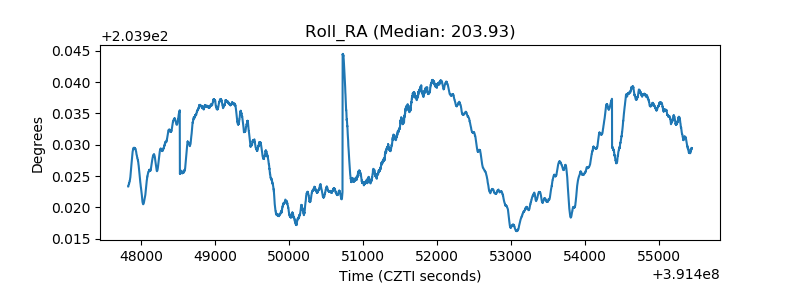 |
| Veto Counter | 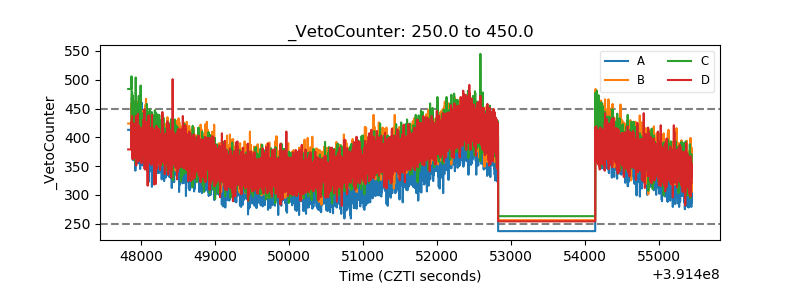 |