| Param | Original file | Final file |
|---|---|---|
| Filename | modeM0/AS1T04_069T01_9000005158_36030cztM0_level2.evt | modeM0/AS1T04_069T01_9000005158_36030cztM0_level2_quad_clean.evt |
| Size (bytes) | 475,971,840 | 49,487,040 |
| Size | 453.9 MB | 47.2 MB |
| Events in quadrant A | 2,548,453 | 303,825 |
| Events in quadrant B | 2,865,204 | 305,440 |
| Events in quadrant C | 4,158,691 | 275,396 |
| Events in quadrant D | 4,509,682 | 268,714 |
Noise dominated data is calculated using 1-second bins in cleaned event files. If a bin has >2000 counts, and if more than 50% of those come from <1% of pixels, then it is considered to be noise-dominated and hence unusable.
| Quadrant | # 1 sec bins | Bins with >0 counts | Bins with >2000 counts | High rate bins dominated by noise | Noise dominated (total time) | Noise dominated (detector-on time) | Marked lightcurve |
|---|---|---|---|---|---|---|---|
| A | 7060 | 4908 | 0 | 0 | 0.00% | 0.00% | 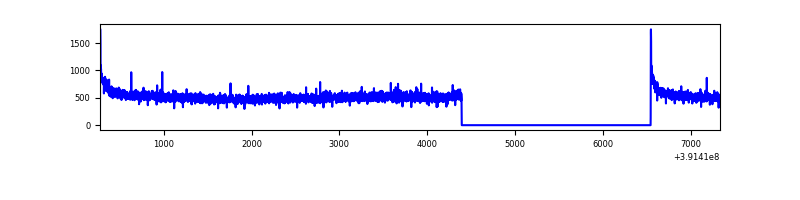 |
| B | 7060 | 4908 | 56 | 56 | 0.79% | 1.14% | 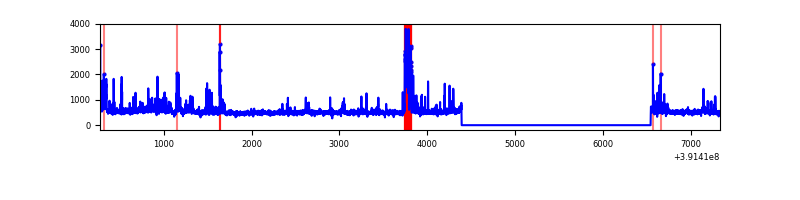 |
| C | 7060 | 4908 | 425 | 425 | 6.02% | 8.66% | 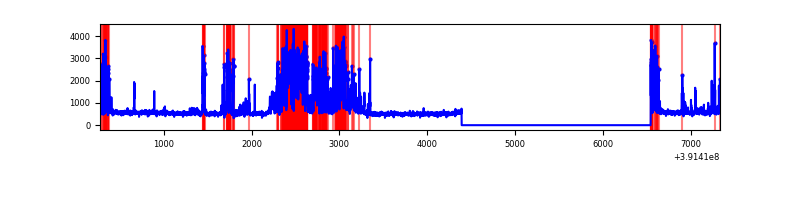 |
| D | 7060 | 4908 | 356 | 356 | 5.04% | 7.25% | 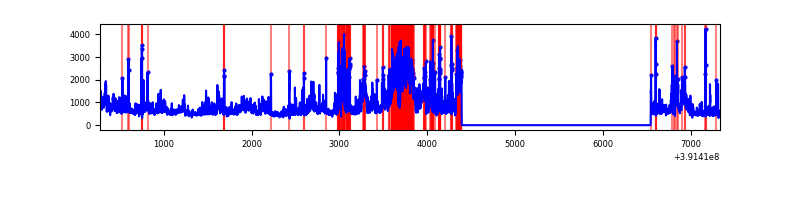 |
Top three noisy pixels from each quadrant. If the there are fewer than three noisy pixels in the level2.evt file, extra rows are filled as -1
| Pixel properties | Quadrant properties | ||||||
|---|---|---|---|---|---|---|---|
| Quadrant | DetID | PixID | Counts | Sigma | Mean | Median | Sigma |
| A | 10 | 83 | 161368 | 1307.7 | 614 | 603 | 122.9 |
| A | 13 | 254 | 7570 | 56.67 | 614 | 603 | 122.9 |
| A | 13 | 6 | 7077 | 52.66 | 614 | 603 | 122.9 |
| B | 5 | 236 | 177810 | 1554.32 | 607 | 591 | 114.0 |
| B | 5 | 255 | 166261 | 1453.03 | 607 | 591 | 114.0 |
| B | 4 | 171 | 54542 | 473.18 | 607 | 591 | 114.0 |
| C | 9 | 187 | 1466264 | 11083.74 | 578 | 584 | 132.2 |
| C | 0 | 10 | 224117 | 1690.4 | 578 | 584 | 132.2 |
| C | 15 | 214 | 200882 | 1514.69 | 578 | 584 | 132.2 |
| D | 12 | 227 | 1623073 | 11397.49 | 584 | 571 | 142.4 |
| D | 10 | 118 | 138426 | 968.38 | 584 | 571 | 142.4 |
| D | 12 | 233 | 89985 | 628.1 | 584 | 571 | 142.4 |
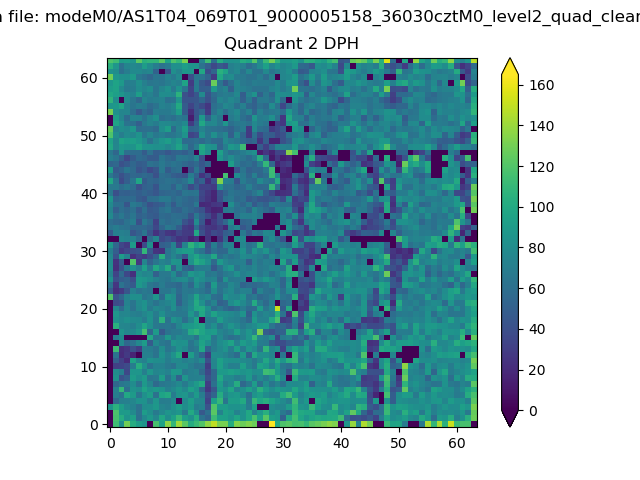
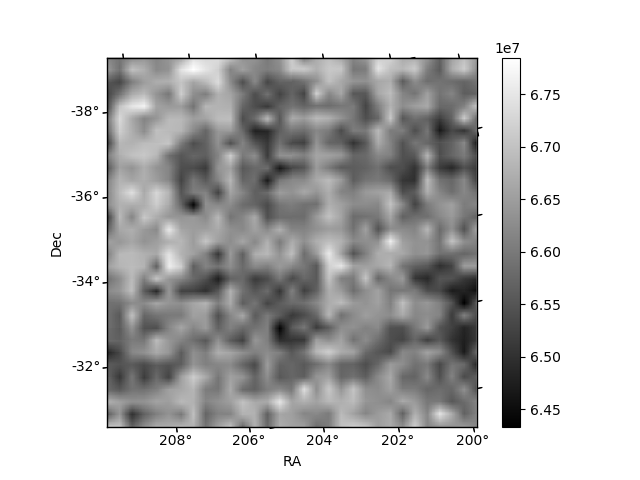
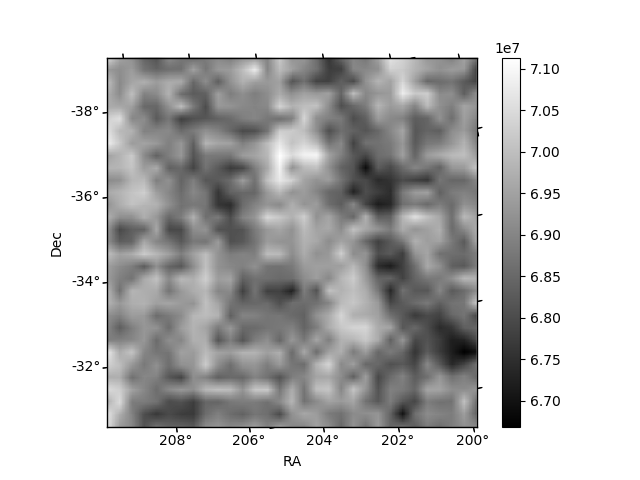
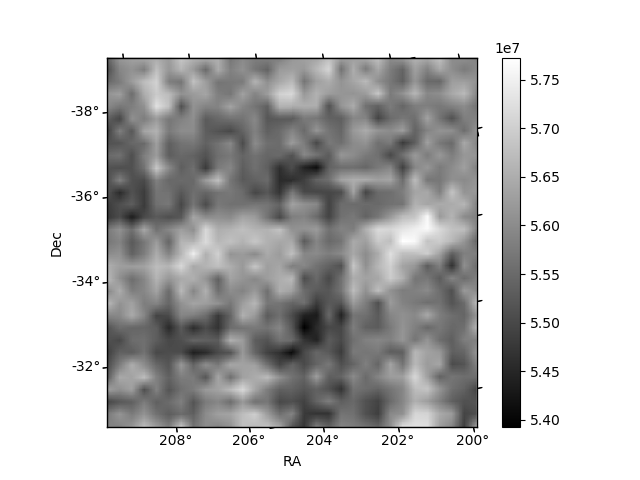
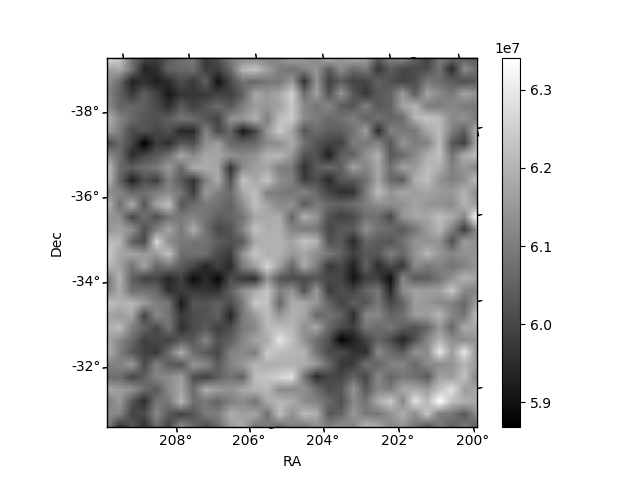
Histogram calculated using DETX and DETY for each event in the final _common_clean file
| Quadrant A | 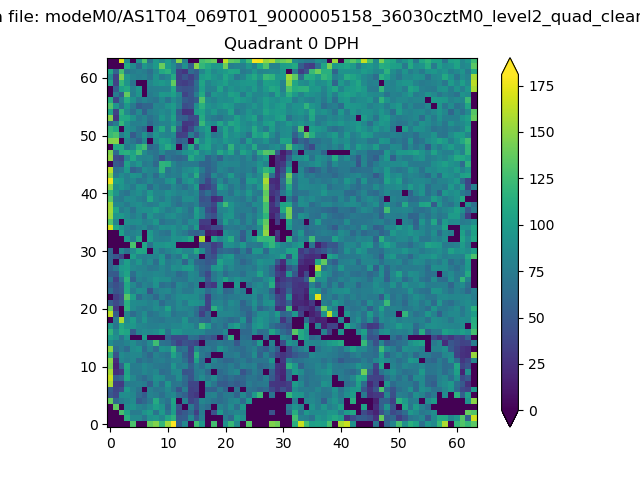 |
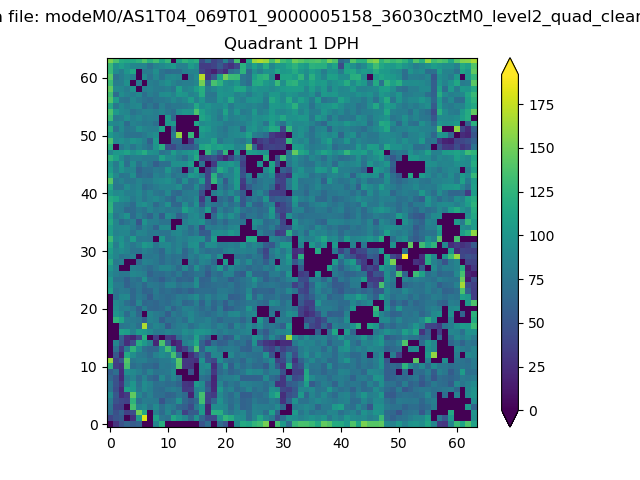 |
Quadrant B |
|---|---|---|---|
| Quadrant D | 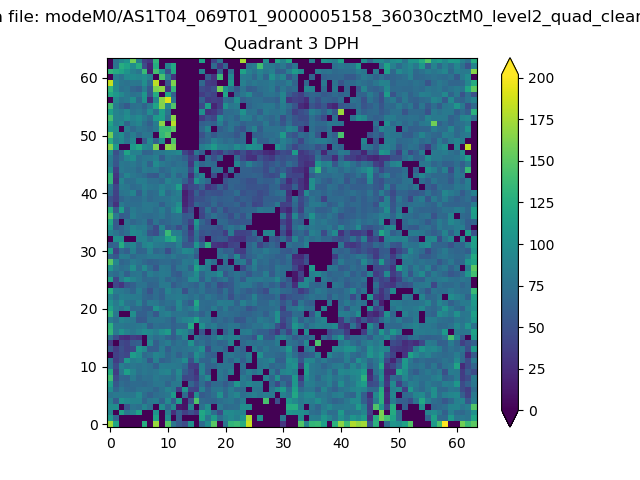 |
 |
Quadrant C |
| Plot type | Count rate plots | Images |
|---|---|---|
| Comparison with Poisson distribution Blue bars denote a histogram of data divided into 1 sec bins. Red curve is a Poisson curve with rate = median count rate of data. |
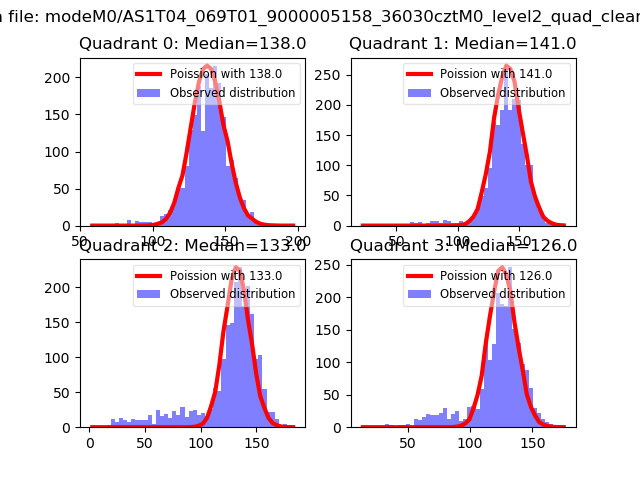 |
 |
| Quadrant-wise count rates Data is divided into 100 sec bins |
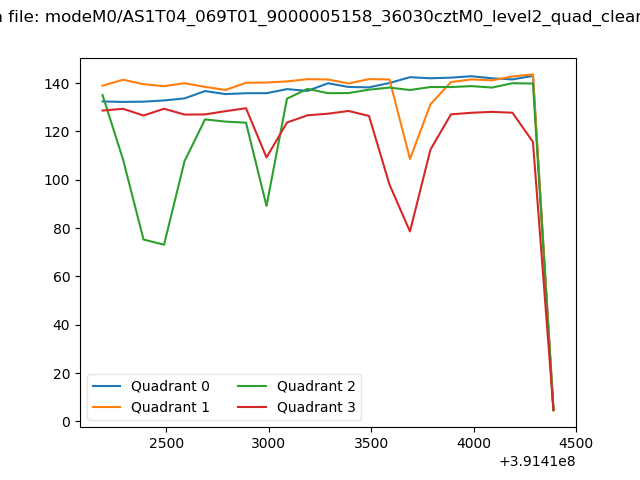 |
|
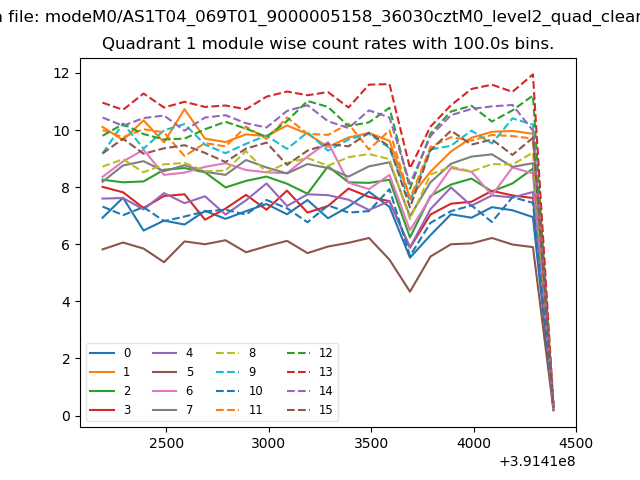
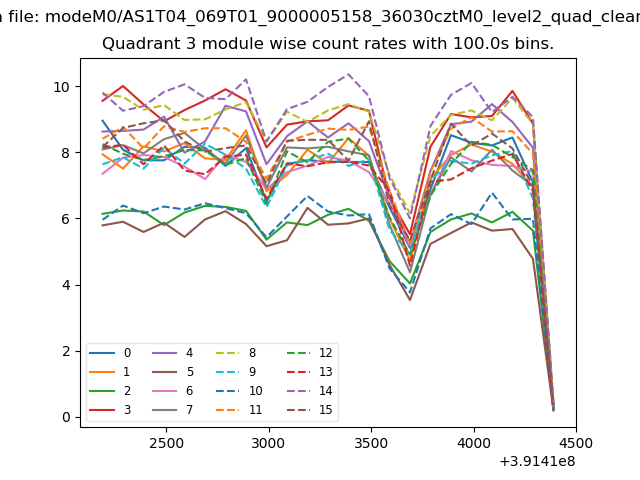
| Module-wise count rates for Quadrant A Data is divided into 100 sec bins |
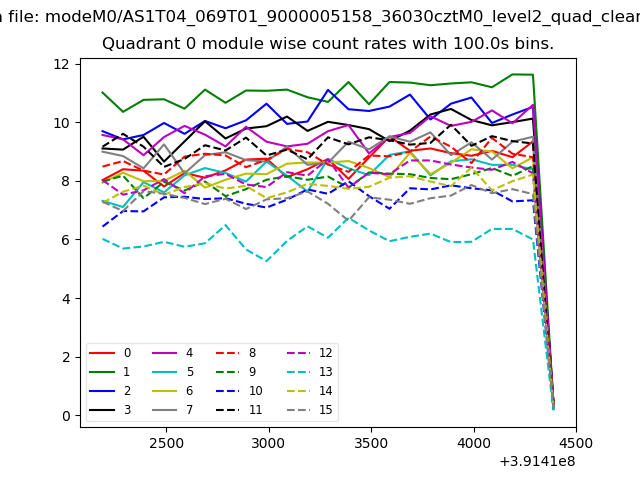 |
 |
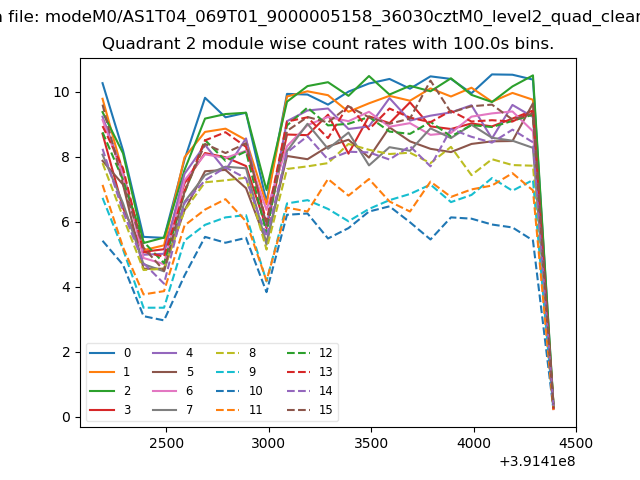
| Module-wise count rates for Quadrant B Data is divided into 100 sec bins |
 |
 |
| Module-wise count rates for Quadrant C Data is divided into 100 sec bins |
 |
 |
| Module-wise count rates for Quadrant D Data is divided into 100 sec bins |
 |
 |
| Parameter | Plot |
|---|---|
| CZT HV Monitor | 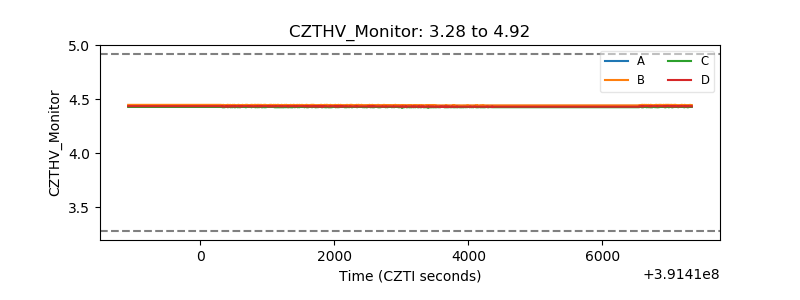 |
| D_VDD | 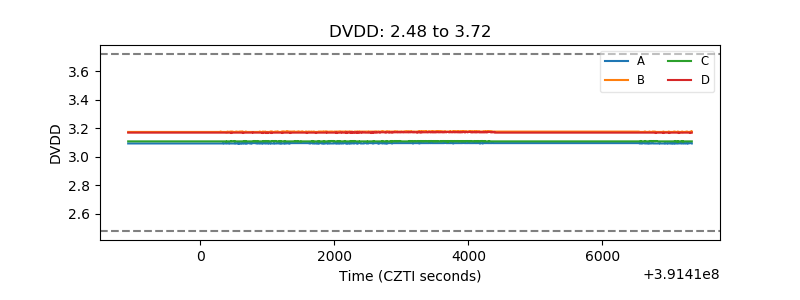 |
| Temperature 1 | 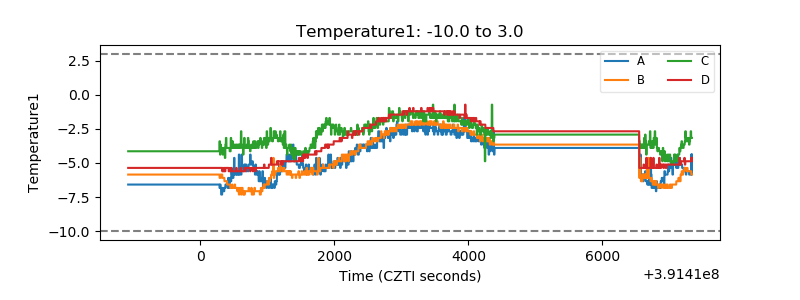 |
| Veto HV Monitor | 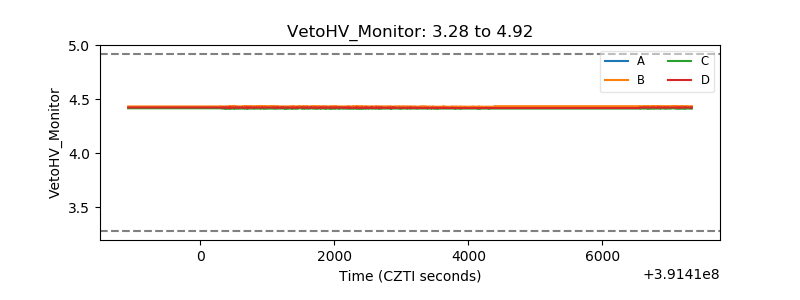 |
| Veto LLD | 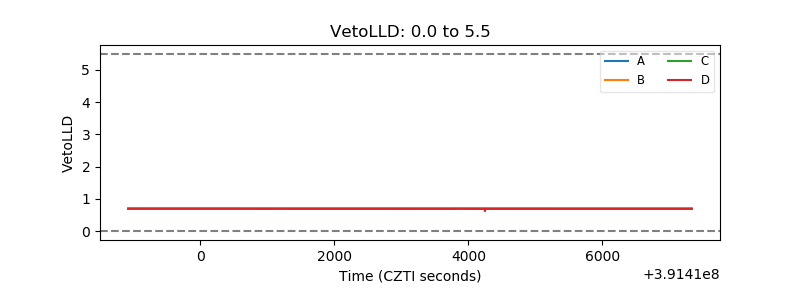 |
| Alpha Counter | 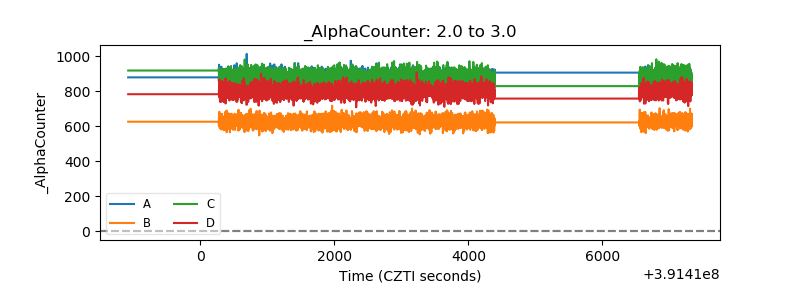 |
| _CPM_Rate | 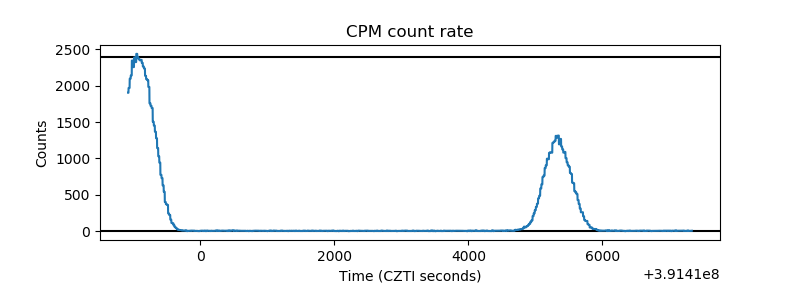 |
| CZT Counter | 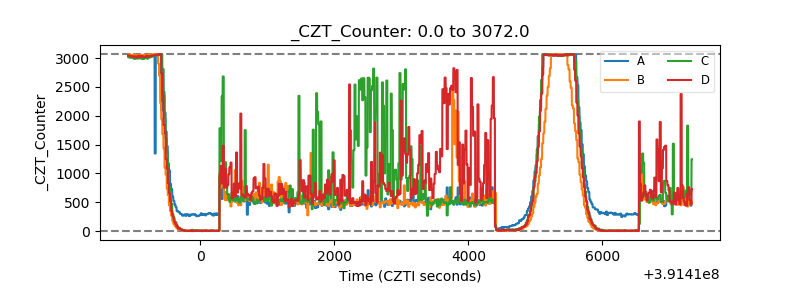 |
| +2.5 Volts monitor | 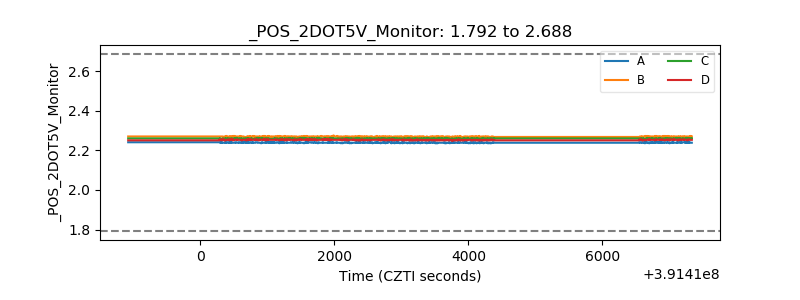 |
| +5 Volts monitor | 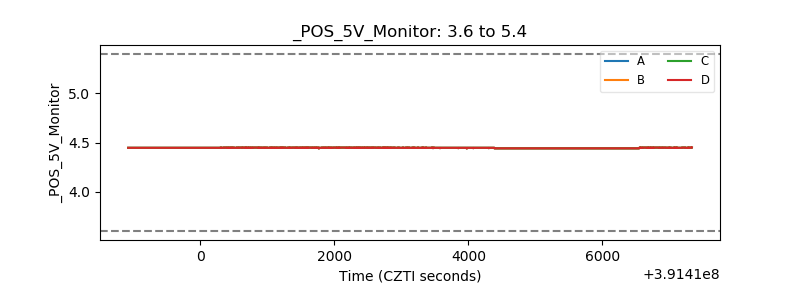 |
| _ROLL_ROT | 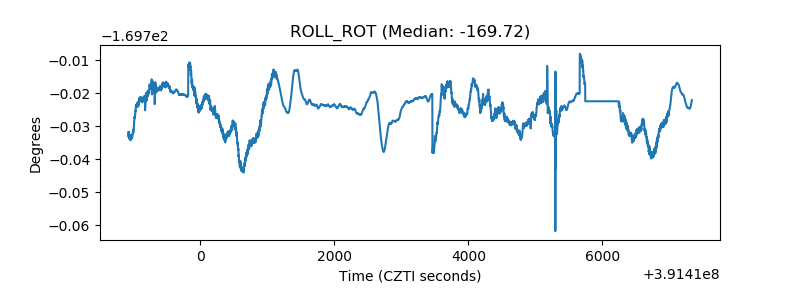 |
| _Roll_DEC | 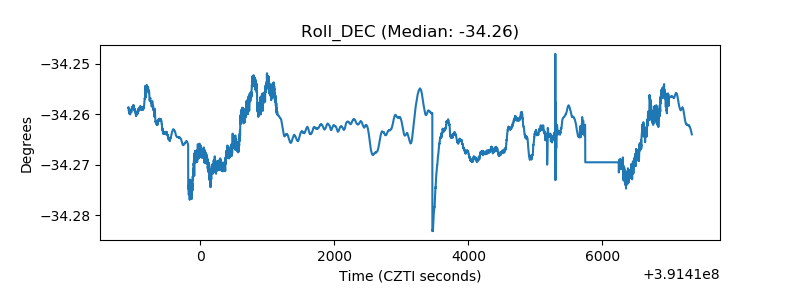 |
| _Roll_RA | 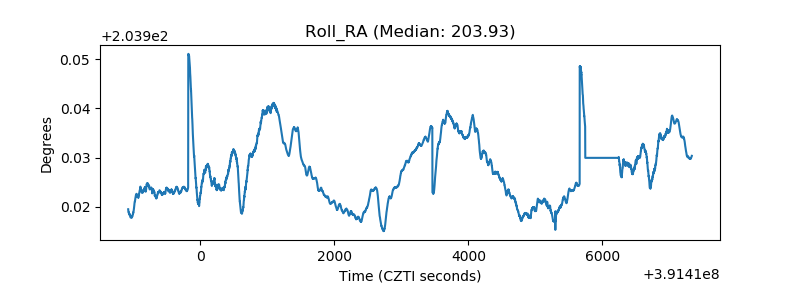 |
| Veto Counter | 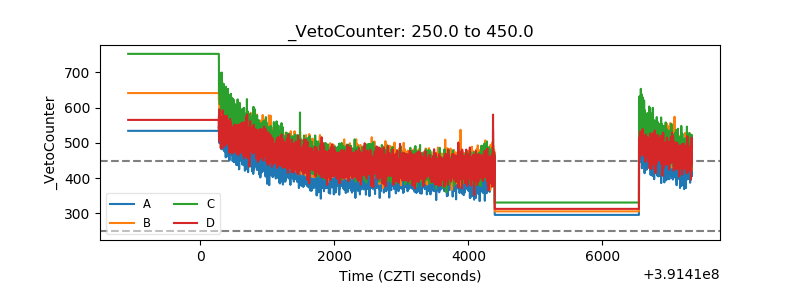 |