| Param | Original file | Final file |
|---|---|---|
| Filename | modeM0/AS1T04_069T01_9000005158_36026cztM0_level2.evt | modeM0/AS1T04_069T01_9000005158_36026cztM0_level2_quad_clean.evt |
| Size (bytes) | 463,515,840 | 65,341,440 |
| Size | 442.0 MB | 62.3 MB |
| Events in quadrant A | 2,561,909 | 414,637 |
| Events in quadrant B | 2,900,466 | 416,979 |
| Events in quadrant C | 3,106,666 | 397,305 |
| Events in quadrant D | 5,104,324 | 373,791 |
| Mode M0 | |||
|---|---|---|---|
| Quadrant | BADHDUFLAG | Total packets | Discarded packets |
| A | 0 | 11082 | 3 |
| B | 0 | 12119 | 2 |
| C | 0 | 12410 | 2 |
| D | 0 | 18828 | 2 |
| Mode M9 | |||
|---|---|---|---|
| Quadrant | BADHDUFLAG | Total packets | Discarded packets |
| A | 0 | 26 | 0 |
| B | 0 | 26 | 0 |
| C | 0 | 26 | 0 |
| D | 0 | 27 | 0 |
| Mode SS | |||
|---|---|---|---|
| Quadrant | BADHDUFLAG | Total packets | Discarded packets |
| A | 0 | 110 | 0 |
| B | 0 | 110 | 0 |
| C | 0 | 110 | 0 |
| D | 0 | 110 | 0 |
| Quadrant | Total seconds | Saturated seconds | Saturation percentage |
|---|---|---|---|
| A | 5361 | 8 | 0.149226% |
| B | 5361 | 59 | 1.100541% |
| C | 5361 | 169 | 3.152397% |
| D | 5361 | 581 | 10.837530% |
Noise dominated data is calculated using 1-second bins in cleaned event files. If a bin has >2000 counts, and if more than 50% of those come from <1% of pixels, then it is considered to be noise-dominated and hence unusable.
| Quadrant | # 1 sec bins | Bins with >0 counts | Bins with >2000 counts | High rate bins dominated by noise | Noise dominated (total time) | Noise dominated (detector-on time) | Marked lightcurve |
|---|---|---|---|---|---|---|---|
| A | 7094 | 5362 | 1 | 1 | 0.01% | 0.02% | 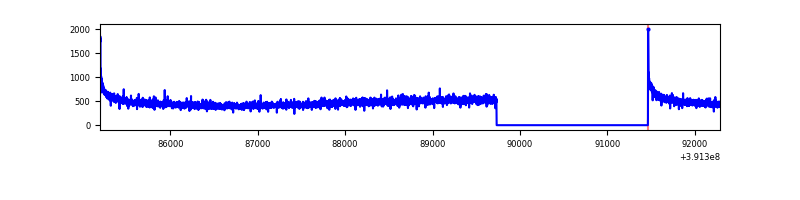 |
| B | 7094 | 5362 | 28 | 28 | 0.39% | 0.52% | 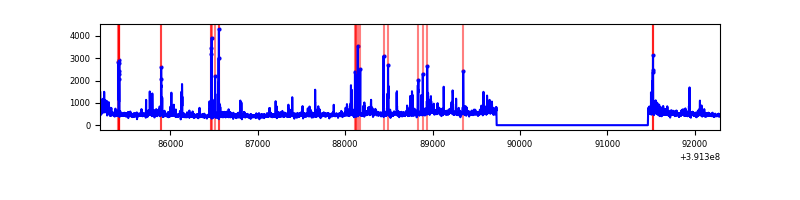 |
| C | 7094 | 5362 | 135 | 135 | 1.90% | 2.52% | 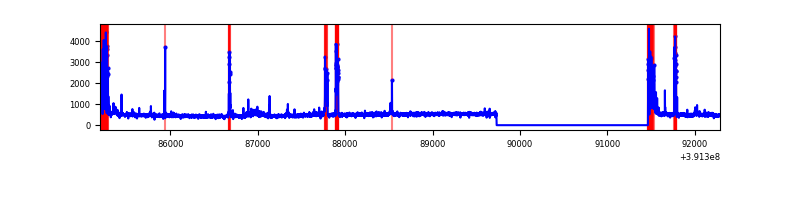 |
| D | 7094 | 5362 | 601 | 601 | 8.47% | 11.21% | 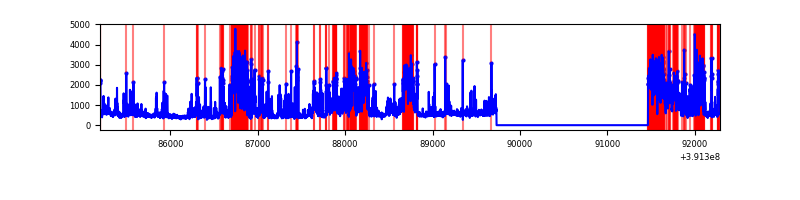 |
Top three noisy pixels from each quadrant. If the there are fewer than three noisy pixels in the level2.evt file, extra rows are filled as -1
| Pixel properties | Quadrant properties | ||||||
|---|---|---|---|---|---|---|---|
| Quadrant | DetID | PixID | Counts | Sigma | Mean | Median | Sigma |
| A | 10 | 83 | 164745 | 1296.27 | 619 | 607 | 126.6 |
| A | 13 | 254 | 8089 | 59.09 | 619 | 607 | 126.6 |
| A | 3 | 137 | 6612 | 47.42 | 619 | 607 | 126.6 |
| B | 4 | 171 | 178850 | 1498.13 | 618 | 602 | 119.0 |
| B | 0 | 213 | 89078 | 743.62 | 618 | 602 | 119.0 |
| B | 0 | 190 | 79395 | 662.24 | 618 | 602 | 119.0 |
| C | 0 | 10 | 338459 | 2419.19 | 594 | 600 | 139.7 |
| C | 9 | 187 | 223348 | 1594.95 | 594 | 600 | 139.7 |
| C | 15 | 214 | 220729 | 1576.2 | 594 | 600 | 139.7 |
| D | 12 | 227 | 1831941 | 12865.42 | 577 | 561 | 142.3 |
| D | 12 | 235 | 525787 | 3689.7 | 577 | 561 | 142.3 |
| D | 10 | 118 | 153363 | 1073.43 | 577 | 561 | 142.3 |
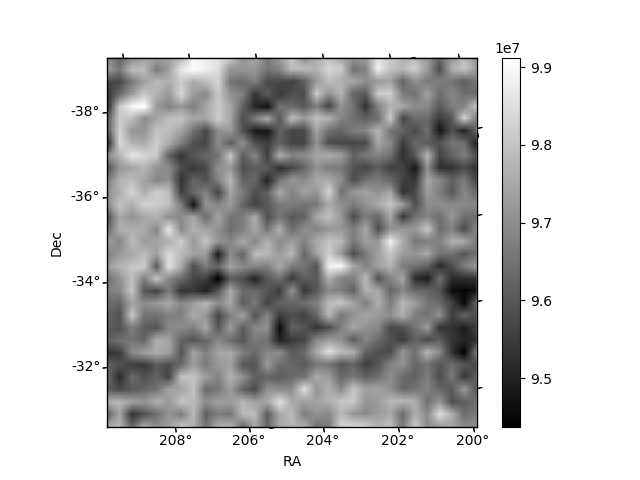
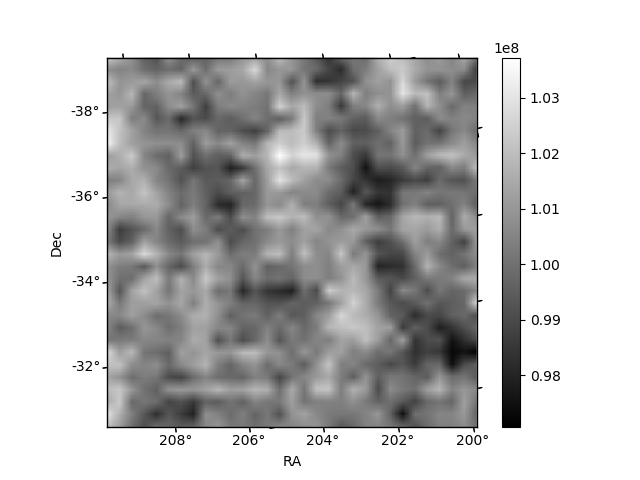
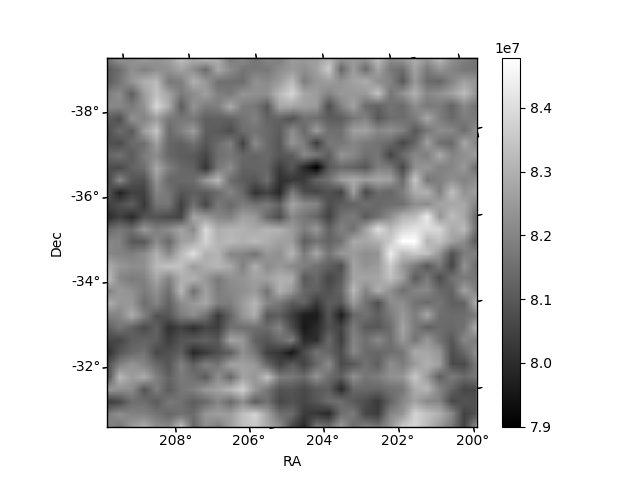
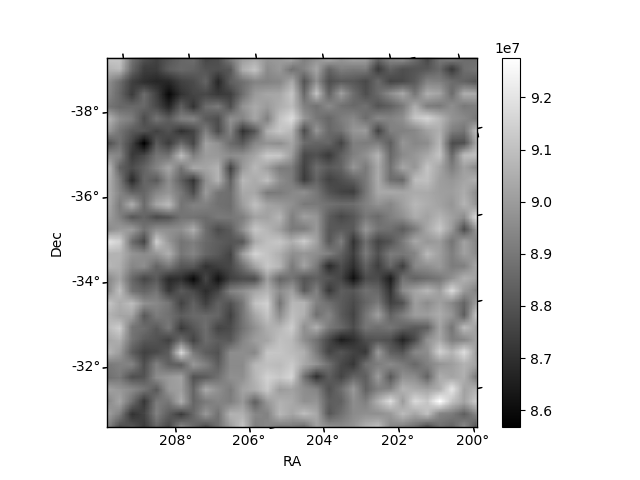
Histogram calculated using DETX and DETY for each event in the final _common_clean file
| Quadrant A | 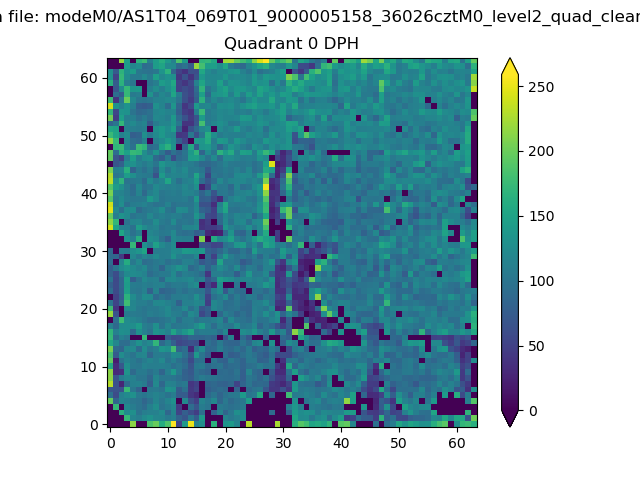 |
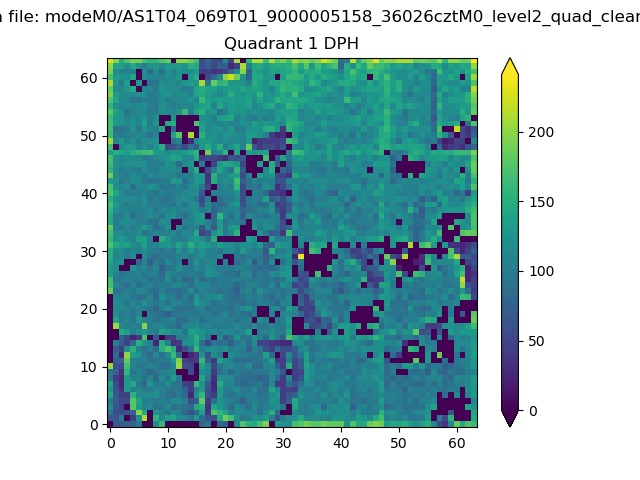 |
Quadrant B |
|---|---|---|---|
| Quadrant D | 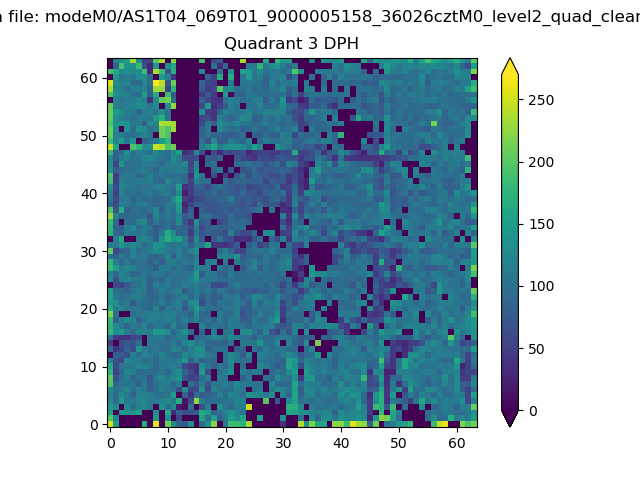 |
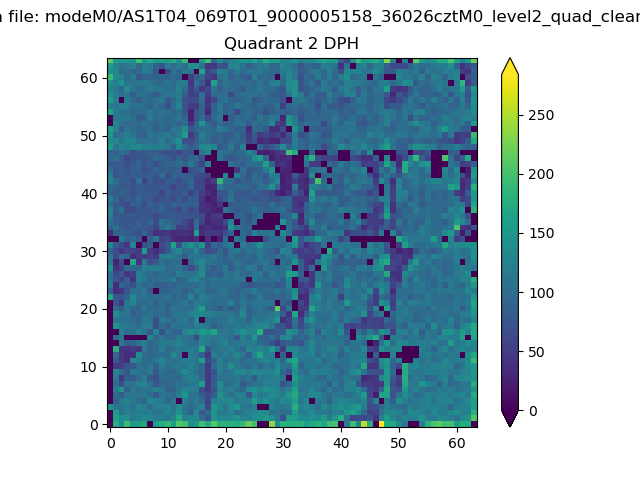 |
Quadrant C |
| Plot type | Count rate plots | Images |
|---|---|---|
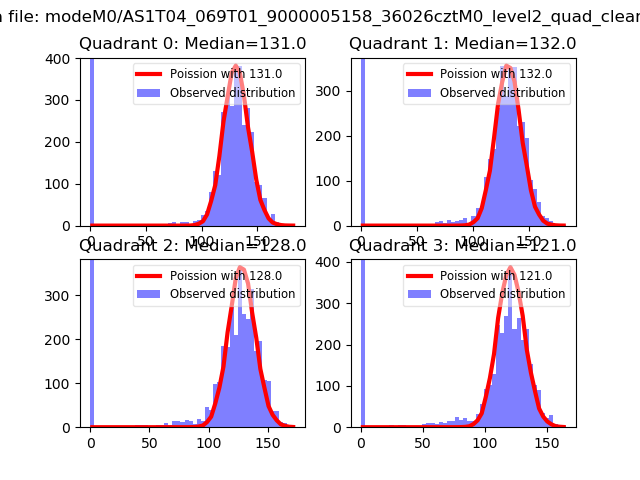
| Comparison with Poisson distribution Blue bars denote a histogram of data divided into 1 sec bins. Red curve is a Poisson curve with rate = median count rate of data. |
 |
 |
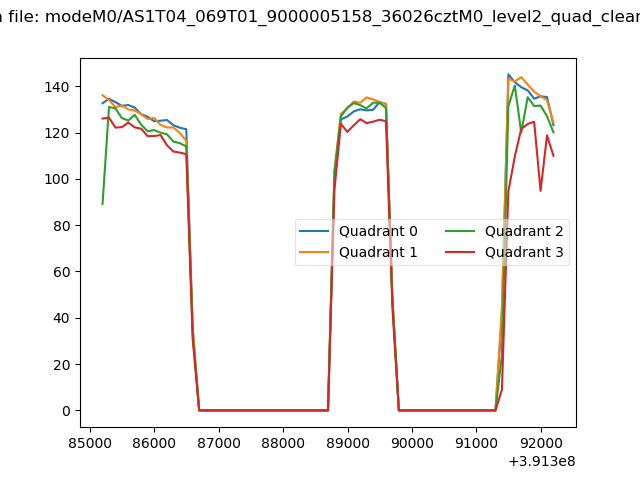
| Quadrant-wise count rates Data is divided into 100 sec bins |
 |
|
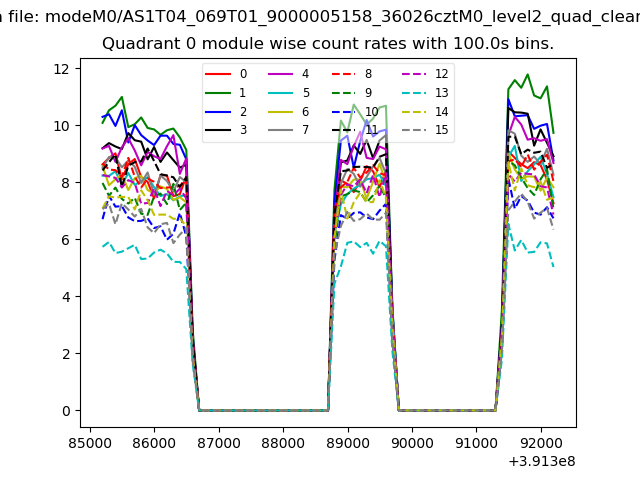
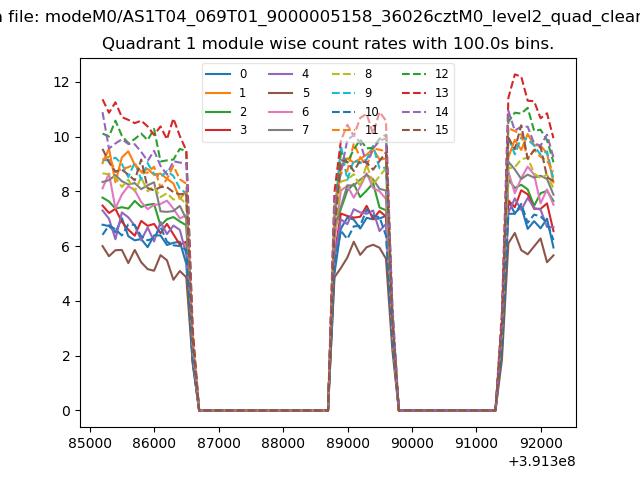
| Module-wise count rates for Quadrant A Data is divided into 100 sec bins |
 |
 |
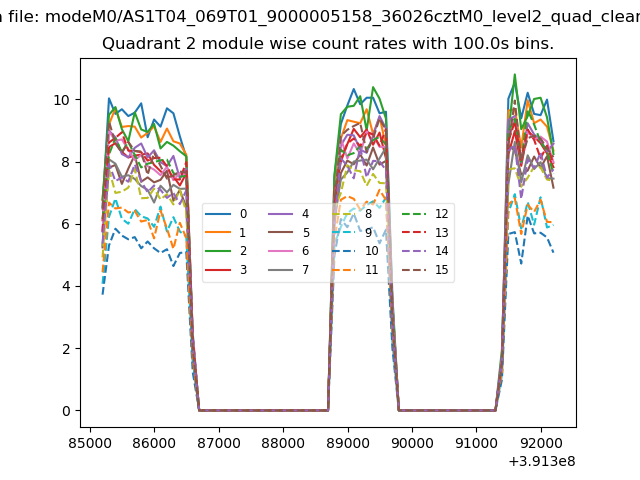
| Module-wise count rates for Quadrant B Data is divided into 100 sec bins |
 |
 |
| Module-wise count rates for Quadrant C Data is divided into 100 sec bins |
 |
 |
| Module-wise count rates for Quadrant D Data is divided into 100 sec bins |
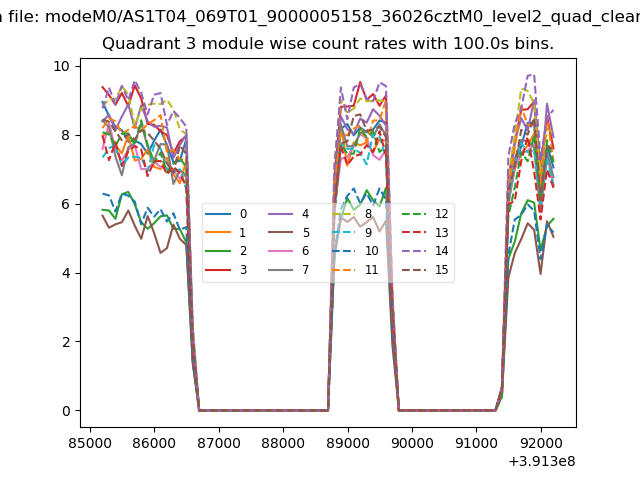 |
 |
| Parameter | Plot |
|---|---|
| CZT HV Monitor |  |
| D_VDD | 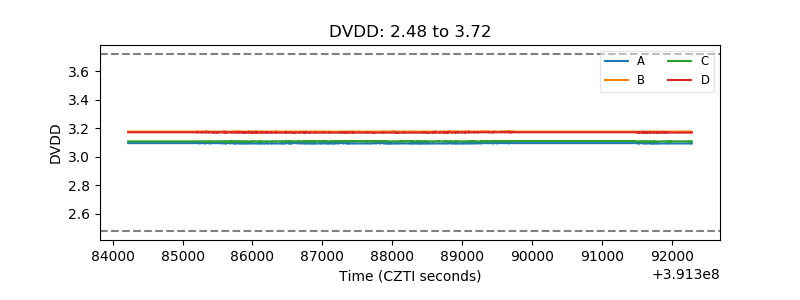 |
| Temperature 1 | 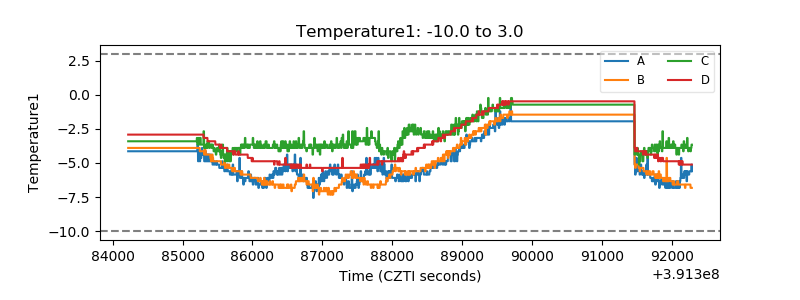 |
| Veto HV Monitor | 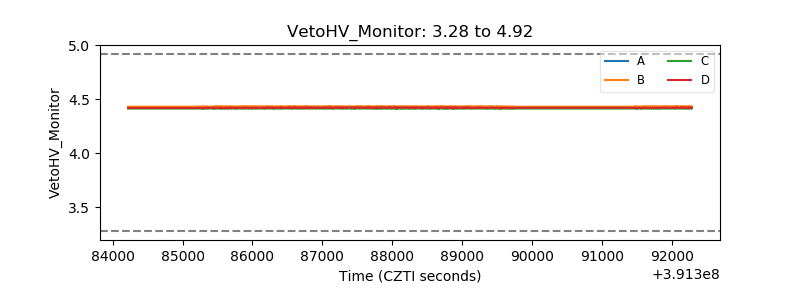 |
| Veto LLD | 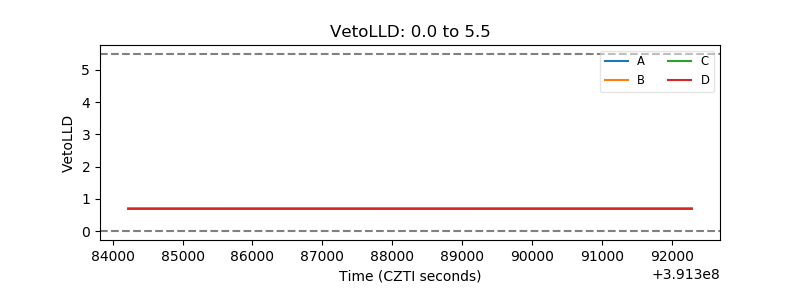 |
| Alpha Counter | 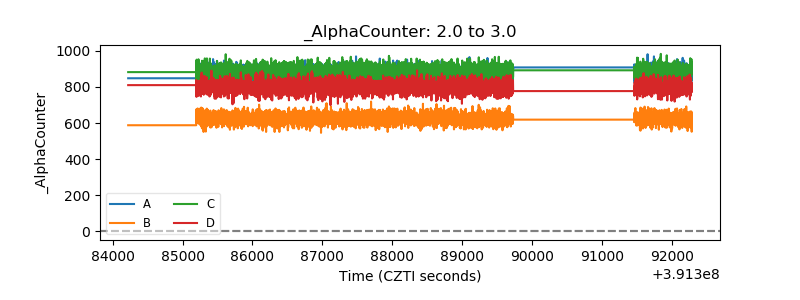 |
| _CPM_Rate | 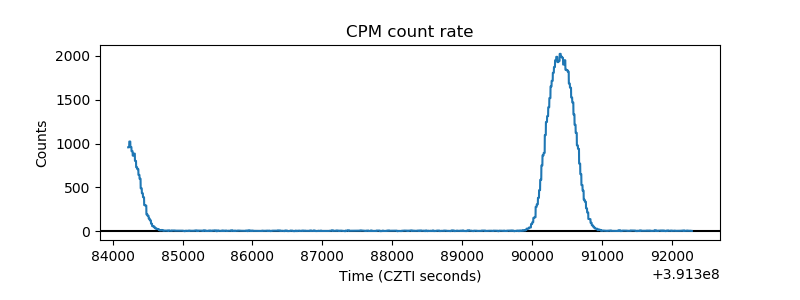 |
| CZT Counter | 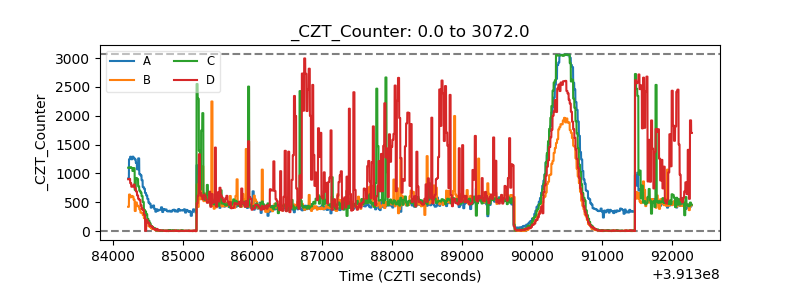 |
| +2.5 Volts monitor | 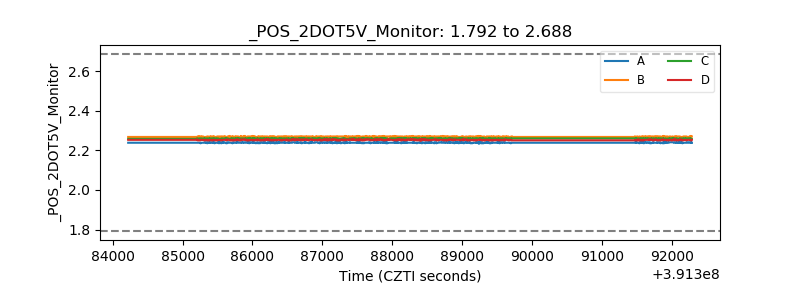 |
| +5 Volts monitor | 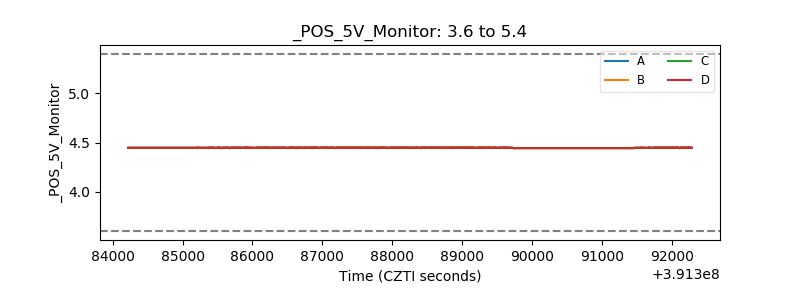 |
| _ROLL_ROT | 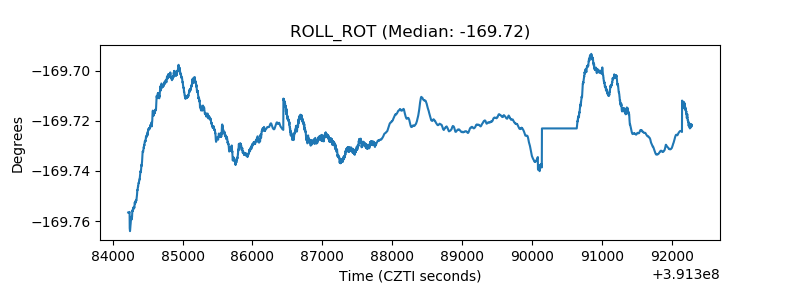 |
| _Roll_DEC | 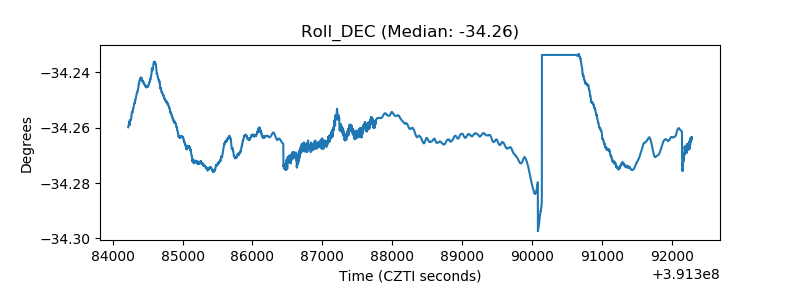 |
| _Roll_RA | 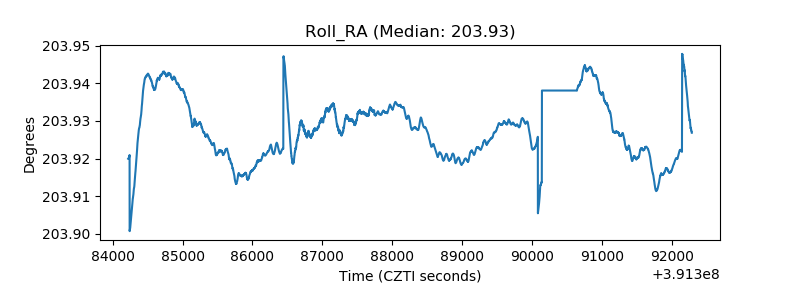 |
| Veto Counter | 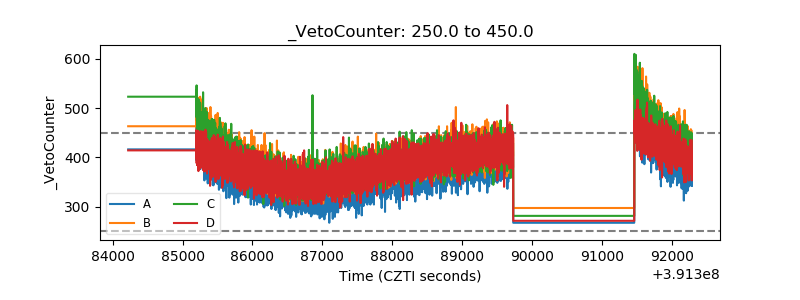 |